Physiographic Environments of New Zealand - Information Document for Regional Councils - Our Land ...
←
→
Page content transcription
If your browser does not render page correctly, please read the page content below
Physiographic Environments of
             New Zealand
     Information Document for Regional Councils

                   Lisa Pearson and Clint Rissmann

Land and Water Science Report 2018/16
June 2018

                     www.landwaterscience.co.nz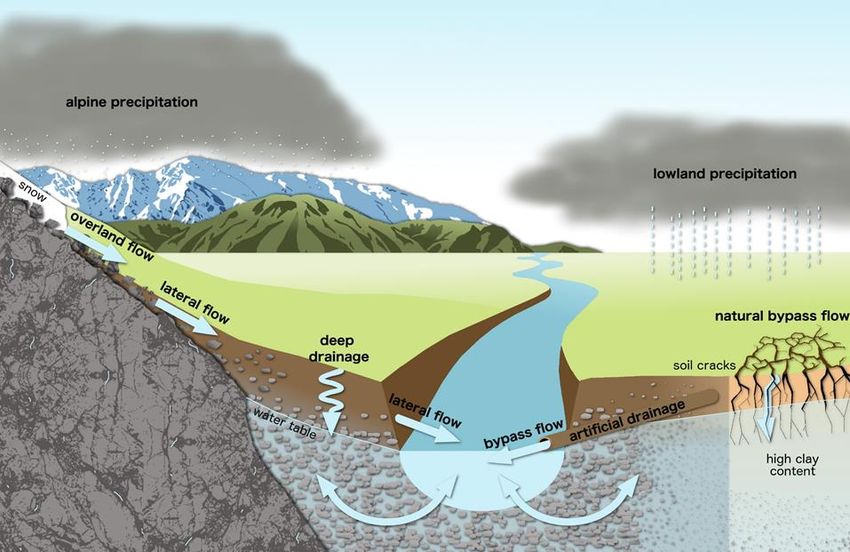
Physiographic Environments of New Zealand:
                           Information Document for Regional Councils

Prepared by
Lisa Pearson and Clint Rissmann

Land and Water Science Ltd.
www.landwaterscience.co.nz
61c Leet Street
Invercargill, 9810
New Zealand

Corresponding Author
Pearson , L.
Contact number: 03 214 3003
Email: lisa@landwatersci.net

Document Information
Land and Water Science Report No: 2018/16
Report Date: 1.06.2018
Project Number: 17060

Land and Water Science Report 2018/16                                   i
Project Number: 17060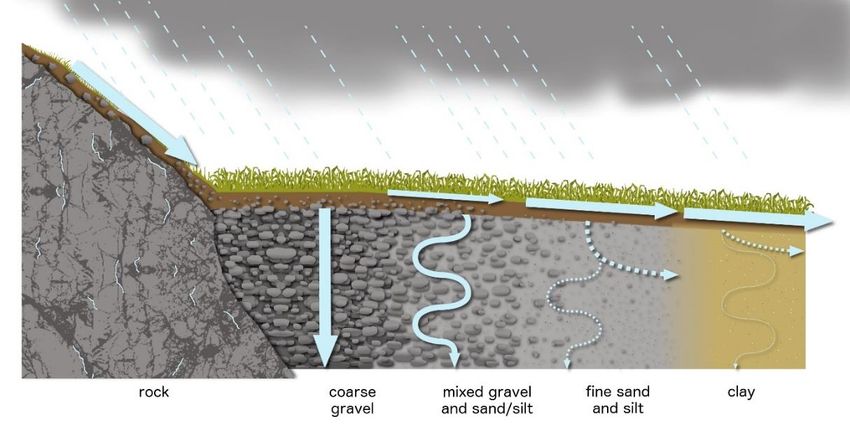
Table of Contents

List of Figures ......................................................................................................................................... iii
List of Tables .......................................................................................................................................... iii
Abstract ................................................................................................................................................... 1
1      Introduction .................................................................................................................................... 2
    1.1        National Policy Statement for Freshwater Management ....................................................... 3
    1.2        Benefit of Physiographic Science ............................................................................................ 3
    1.3        Scale ........................................................................................................................................ 4
2      Project Affiliations and Support ...................................................................................................... 4
    2.1        Project Team ........................................................................................................................... 4
    2.2        Our Land and Water National Science Challenge ................................................................... 4
    2.3        Regional Authorities................................................................................................................ 4
3      Current Applications and Relevant Work ....................................................................................... 5
    3.1        Living Water (Department of Conservation and Fonterra Cooperative) ................................ 5
    3.2        Sustainable Farming Fund ....................................................................................................... 6
    3.3    Envirolink Advice Grants (Waterways Centre for Freshwater Management, University of
    Canterbury and Lincoln University) .................................................................................................... 6
       3.3.1           Suitability of national datasets for physiographic mapping ........................................... 6
       3.3.2           Small advice grants ......................................................................................................... 7
4      Physiographic Approach – Overview of Methodology ................................................................... 7
    4.1        Hydrological Process-Attribute Layer (H-PAL) ........................................................................ 9
    4.2        Redox Process-Attribute Layer (R-PAL) ................................................................................. 10
    4.3        Physiographic Environments – Conceptual Model ............................................................... 11
    4.4        Validation and Performance Testing..................................................................................... 13
5      Data Requirements ....................................................................................................................... 13
    5.1        Water quality data ................................................................................................................ 13
       5.1.1           PENZ Test Set ................................................................................................................ 13
       5.1.2           Historical SOE or other water quality data ................................................................... 15
    5.2        Spatial data ........................................................................................................................... 15
    5.3        Local and regional expert knowledge ................................................................................... 15
6      Project Deliverables ...................................................................................................................... 15
7      Proposed Funding Structure for PENZ .......................................................................................... 16
8      Actions required by each Regional Council................................................................................... 17
9      Testimonials .................................................................................................................................. 17
10 Acknowledgements....................................................................................................................... 17
11 References .................................................................................................................................... 18
Appendix 1 – Sustainable Farming Fund (SFF) Application................................................................... 20
Appendix 2 - Hill Laboratory Test Sets ................................................................................................. 33

Land and Water Science Report 2018/16                                                                                                                        ii
Project Number: 17060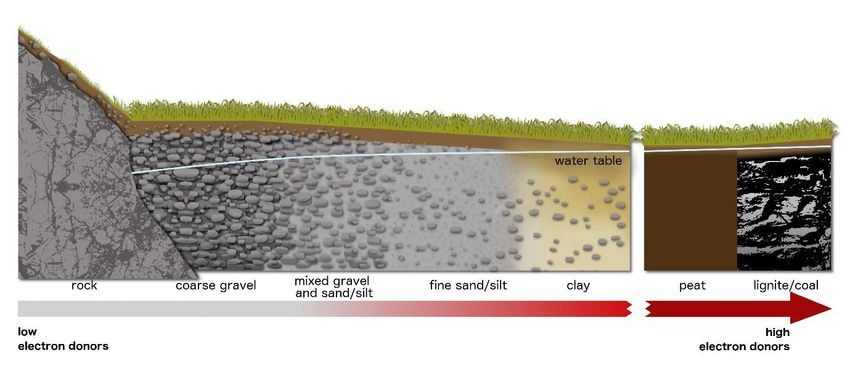
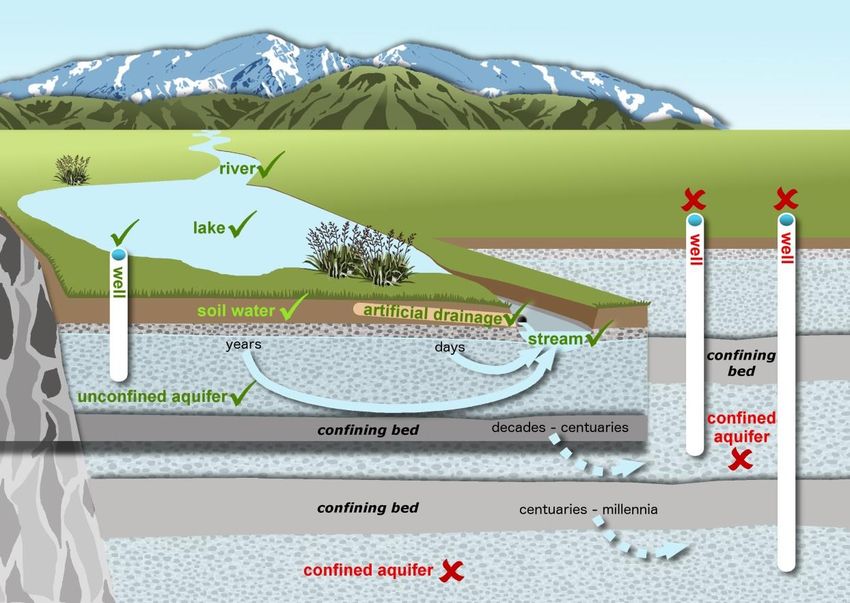
List of Figures

Figure 1: Illustration of the connectivity of water resources, including soil water, surface and shallow
groundwater. The green tick marks show the hydrologically connected settings included in the
physiographic approach, red crosses identify settings that are excluded.............................................. 2
Figure 2: Example of the physiographic mapping undertaken for the Waituna Catchment, Southland
(Rissmann et al. 2018b)........................................................................................................................... 6
Figure 3: Summary of steps to develop the physiographic mapping method (Rissmann et al. in prep.).
................................................................................................................................................................ 8
Figure 4: Fine scale hydrological pathways. ........................................................................................... 9
Figure 5: Soil texture gradient in the unsaturated zone controlling deep drainage, lateral flow and
overland flow. ....................................................................................................................................... 10
Figure 6: Redox process attribute gradient controlling denitrification, solubility, leachability and
mobility of redox sensitive species in soils, aquifers and surface water. ............................................. 11
Figure 7: Physiographic classes in the Aparima Catchment, Southland. .............................................. 12

List of Tables

Table 1: Surface and groundwater chemical analytes needed for classification and validation of PALs.
.............................................................................................................................................................. 14
Table 4: Current Funding Structure ...................................................................................................... 16

Land and Water Science Report 2018/16                                                                                                                          iii
Project Number: 17060
Abstract

The Physiographic Environments of New Zealand (PENZ) a two-year project (mid 2017- mid 2019)
that links fresh water to the land. Understanding this relationship is crucially important as it is a
major influence over water composition, and hence quality. Landscape features can account for
more than twice the variability in water quality than land use alone. For this reason, it is important
to include landscape attributes in any attempt to explain ‘how’ and ‘why’ water quality varies across
a catchment or region. The Physiographic Science turns existing thinking on its head because it uses
the signals in water to trace the water’s journey through the landscape. The project is made possible
through collaboration and funding from Our Land and Water National Science Challenge and
Regional Authorities. The regions currently undertaking physiographic mapping are Northland,
Auckland, Waikato, Bay of Plenty, Manawatu-Wanganui, and Canterbury.
For regions around NZ that have opted to join the project, national and regional water composition
and quality data sets are used in conjunction with existing geospatial layers to map the set of
processes (hydrological and redox) that control the spatial variability of water. The method uses
scientifically rigorous techniques to bring together data for climate, topography, geology, soils, and
hydrological controls with analytical chemistry at a national scale. It will also be ground-tested using
expert local knowledge. The resulting product will be “Physiographic Environments of New Zealand”
– a freely-accessible, high resolution map that explains the ‘how’ and ‘why’ water quality varies
spatially.
The method used in the project has been peer-reviewed both nationally and internationally
(Rissmann et al., 2016). It was also ratified by Our Land and Water National Science Challenge, which
has provided partial funding for the project. Unlike the crown research institutes and universities
also involved in the national science challenges, this project is being developed out of an
independent consultancy, and hence the need to obtain Regional Council support and funding to
map each region.
This document presents a high-level overview of the physiographic science including a general
introduction to the methodology, data requirements from regional authorities, and introduces the
project team and affiliations. Also included in this document is a project timeline for deliverables and
funding structure.

Land and Water Science Report 2018/16                                                                  1
Project Number: 17060
1    Introduction

Water quality can vary spatially across the landscape, even when there is similar land uses or
pressures in a catchment. These differences in water quality occur because of the natural spatial
variation in the physical landscape, which alters the composition of the water through coupled
physical, chemical and biological processes. The water composition (of dissolved and particulate
constituents) provides information about its origin, the pathway it has travelled and the processes to
which it has been subjected. Of most significance to surface water quality are the processes
occurring in the soil zone and shallow unconfined aquifers, as they are highly connected
hydrologically to surface water (Figure 1). Identifying, mapping, and classifying these landscape
features across an area forms the basis of the physiographic approach, making it possible to
accurately predict the water chemistry of shallow groundwater and surface water. For example, all
regional ground water nitrate, phosphorus and E. coli hotspots were accurately identified and
constrained spatially for the Southland region (Rissmann, 2012; Rissmann et al., 2012; Snelder et al.,
2016).
The physiographic approach was developed at Environment Southland, led by Dr Clint Rissmann,
alongside policy development for the regional plan. The Physiographic Environments of New
Zealand project takes this research a step further by producing a national scientific classification for
knowledge transfer, independent from policy development. The physiographic approach is based on
peer reviewed scientific principles, applicable not just to Southland but the whole of New Zealand
and many other regions of the world (Peters, 1994; Clark and Fritz, 1997; Kendall and O’Donnell,
1998; Indamar, 2012; and others). Currently, the physiographic framework is being used for the
Waituna Catchment for Living Water, a Department of Conservation and Fonterra partnership, to
provide a basis for targeted investments to mitigate losses from farms across the catchment.

Figure 1: Illustration of the connectivity of water resources, including soil water, surface and shallow
groundwater. The green tick marks show the hydrologically connected settings included in the physiographic
approach, red crosses identify settings that are excluded.

Land and Water Science Report 2018/16                                                                        2
Project Number: 17060
1.1    National Policy Statement for Freshwater Management
Under the National Policy Statement for Freshwater Management (NPS-FM; MfE, 2014), regional
authorities are required to maintain or improve water quality through regional plans to set
freshwater objectives and limits. Local authorities must ensure there are appropriate controls on
land use, discharges and water takes to meet a freshwater objective for both water quantity and
quality.
The need for regional authorities to understand the major drivers of water quality outcomes and
inherent risk is critical for planning purposes, resource consent activities, and targeted locations for
cost-effective water management strategies (or mitigations). Objective A1 of the NPS-FM requires
councils to adopt a holistic or whole catchment response using a variety of tools and methods. The
physiographic conceptual framework provides a tool for councils to effectively manage to freshwater
objectives for a catchment/region.

1.2    Benefit of Physiographic Science
Physiographic Environments provide a visual, spatial platform to explain ‘how’ and ‘why’ water
composition, water quality state, and inherent water quality risks vary across a landscape or
catchment (Rissmann et al., 2018; Pearson et al., 2018). They can be used to understand the controls
and estimate the concentration of redox sensitive species (dissolved oxygen, nitrate, nitrite,
ammonia, dissolved manganese, dissolved iron, sulphate) and indirectly sensitive species, such as
soluble forms of phosphorus. Sediment and microbial contaminants are not directly included in the
assessment; however Physiographic Environments can discriminate between clarity, turbidity and
microbial (E. coli) risk between mapped environments (Snelder et al., 2016). A sediment specific
physiographic layer is currently being developed for Northland Regional Council.
Physiographic Environments can be used in a wide range of applications across a regional authority;
including resource consent applications for assessment of environmental effects, informing land
management decisions and farm environmental plans to target mitigation approaches, and assisting
with future policy and planning. The Physiographic Environments provide context to existing
empirical models (such as Overseer Nutrient Budgets, CLUES, LUCI and other catchment models), as
they are based on a recognition of those soil features that are most critical to water quality
outcomes and that may not be recognised or incorporated within existing geospatial layers. For this
reason, Physiographic Environments allow for a more rigorous spatial understanding of the fate of
contaminants once they leave the root zone. This includes their subsequent transport and
attenuation potential prior to reaching a water body. Water quality mitigation approaches can
therefore be targeted to the Physiographic Environment, thus optimising expenditure and increasing
success.
Physiographic Environments are useful for:
•        Improving understanding of the processes driving surface and groundwater quality,
         particularly variation in water quality patterns in the region
•        Better understanding of risks of land uses to water bodies
•        Identification or refinement of freshwater management units under the National Policy
         Statement for Freshwater Management 2014,
•        Setting of freshwater quality objectives and limits,
•        Development of appropriate (i.e. targeted and effective) regulatory and non-regulatory land
         management initiatives for maintaining and improving water quality.

Land and Water Science Report 2018/16                                                                 3
Project Number: 17060
1.3 Scale
The physiographic approach explains water quality variation in small (greater than 2nd order) to
large order drainage basins and local scale aquifers. The ‘Physiographics of Southland’ could explain
and accurately estimate longitudinal variation in surface and shallow groundwater across Southland,
including locating all groundwater hotspots (for nitrogen, phosphorus and E. coli), and most
importantly explain why they form where they do, despite often similar land use pressures.
At the farm scale, physiographic environments work by providing key context to the farm setting and
the underlying controls over water quality outcomes. For Southland, Dr Ross Monaghan, Senior
Scientist at AgResearch, used the physiographic zones to tailor mitigations to each zone, which
Environment Southland’s farm extension team use to provide context to the advice they give to
farmers.
2 Project Affiliations and Support
PENZ will be primarily developed by a Project Team at Land and Water Science, and in affiliation with
Our Land and Water National Science Challenge and Regional Authorities. The project relies on
funding and guidance from Regional Councils across New Zealand and without their input it is not
possible to classify every region. The roles of each of these groups is outlined below.
2.1 Project Team
The research and development of PENZ will be undertaken at Land and Water Science, led by Dr
Clint Rissmann.
The key people involved at LWS are:
• Dr Clint Rissmann – Project Leader, Director, and Adjunct Senior Fellow at the
Waterways Centre for Freshwater Management, University of Canterbury and Lincoln
University.
• Dr Lisa Pearson – Project Manager, Lead Environmental and Earth Scientist
• Dr Monique Beyer – Environmental Engineer and Hydrologist
• Mr Matt Couldrey – GIS Analysist and Environmental Scientist
• Ms Jessie Lindsay – GIS Analyst and Environmental Scientist
2.2 Our Land and Water National Science Challenge
Physiographic Environments of New Zealand project is incorporated with the Our Land and Water
(OLW) National Science Challenge, which aims “to enhance primary sector production and
productivity while maintaining and improving our land and water quality for future generations”.
The project integrates directly with two key challenge themes, Sources and Flows - Lead by Dr MS
Srinivasan and Dr Richard Muirhead, and Land Use Suitability - Lead by Dr Scott Larned and
Professor Richard McDowell. A key requirement of the PENZ project is the alignment and integration
of this work with the Sources and Flows and Land Use Suitability themes.
2.3 Regional Authorities
A key requirement of the PENZ programme has been to obtain co-funding from regional authorities
throughout New Zealand, to facilitate application of the physiographic approach in as many regions
Land and Water Science Report 2018/16 4
Project Number: 17060as possible. Physiographic mapping for contracted regions in the North Island commenced in early
2018, including development of hydrological process attribute and redox process attribute layers.
The project also requires experts from the regional authorities for local expert knowledge and supply
of regional water quality datasets for validation and ground truthing of the final product. Regional
council input will help shape the final outputs.
The councils currently involved with the project are:
• Northland Regional Council
• Auckland Council
• Waikato Regional Council
• Bay of Plenty Regional Council
• Horizons Regional Council
• Environment Canterbury
In addition, a high-resolution sediment layer is currently being undertaken for Northland Regional
Council due to the particular importance of sediment loss for the region. This work leverages off
existing geospatial layers including a radiometric survey of the region.
3 Current Applications and Relevant Work
This section details other projects and scoping work that has been undertaken in regions and
catchments around NZ.
3.1 Living Water (Department of Conservation and Fonterra Cooperative)
Over the past year we have been collaborating with Living Water (DOC/Fonterra Partnership) and
local landowners to undertake high-resolution physiographic mapping of the Waituna Catchment,
Southland (Rissmann et al., 2018a; Pearson et al., 2018a; Pearson et al., 2018b; Rissmann and Beyer,
2018). The key aim of the project was to support water quality and biodiversity investment decisions
for the catchment, and to assist the partnership in achieving their aim of “finding solutions to enable
farming, freshwater, and healthy ecosystems to thrive side-by-side”. To achieve this, we created
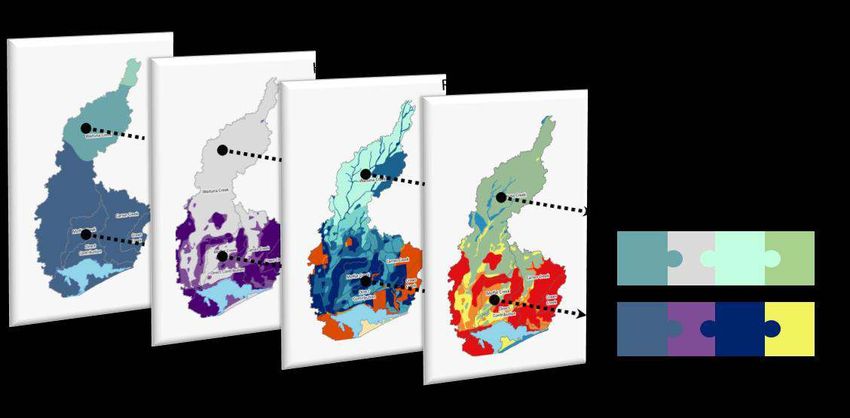
high-resolution physiographic science process-attribute layers for the catchment (Figure 2). The
hydrological and redox process-attribute layers were identified to be the key controls over water
quality outcomes in the Waituna Catchment.
Two Story Maps (online interactive maps) were produced for the catchment, which show the
physiographic maps and natural variation in mobility of nitrogen (nitrate, organic N), phosphorus
(dissolved reactive and particulate), sediment, and microbes.
Story Map 1: Background and Technical Information
https://e3s.maps.arcgis.com/apps/MapJournal/index.html?appid=0c0fc1fa5afa423eb63d85bd9a1ec980
Story Map 2: Physiographic Maps and Inherent Risk
https://e3s.maps.arcgis.com/apps/MapJournal/index.html?appid=73571ecdd1e14f3eb3d07166952b897d
Additional information on the application of the physiographic approach to the Waituna Catchment
can be found in a recently published paper (Rissmann et al., 2018b), which was presented at the
Massey University, Fertilizer and Lime Research Centre Workshop.
http://flrc.massey.ac.nz/workshops/18/Manuscripts/Paper_Rissmann_2018.pdf.
Land and Water Science Report 2018/16 5
Project Number: 17060Figure 2: Example of the physiographic mapping undertaken for the Waituna Catchment, Southland (Rissmann
et al. 2018b).
3.2 Sustainable Farming Fund
Over the next six months we are particularly looking forward to collaborating with numerous industry
and local stakeholders on the Ministry for Primary Industries, Sustainable Farming Fund Project (2018
– 2021) which commences in July 2018. Through this project, we aim to work with farmers, industry
groups, and community groups to establish a spatial platform to allow landowners to access mapping
layers developed through the physiographic science approach. Ultimately, this will allow industry
groups and landowners to better understand the landscape controls on water quality, and to have the
required information to implement management procedures to allow for the maintenance and
improvement of water quality. Examples of ‘on the ground’ management practices that can be
implemented and which are informed by physiographic science include: land use management
practices (e.g., changes to nutrient and stock rates and inputs), implementation of physical mitigation
measures (e.g., riparian planting of waterways; peak runoff structures to reduce sediment during high
flow/rainfall events), optimisation of the timing of fertiliser and Farm Dairy Effluent irrigation, and
provision of spatial context to existing farm extension programmes.
For more information on this project see the SFF application in Appendix 1 or contact Lisa at Land and
Water Science (lisa@landwatersci.net).
3.3 Envirolink Advice Grants (Waterways Centre for Freshwater Management,
University of Canterbury and Lincoln University)
3.3.1 Suitability of national datasets for physiographic mapping
An Envirolink medium advice grant was completed for Northland Regional Council to assess the
suitability of national datasets for physiographic mapping for the region (Rissmann et al., 2017).
Attributes within national soil (FSL, SMAP), geological (NZLRI, QMAP), topographical (DEM), and
hydrological (REC) datasets were identified to recognise landscape gradients specific to water
quality. These attributes were compared against radiometric imagery which is a direct measure of
the spatial heterogeneity of the land surface and is relevant to deciphering the key landscape
Land and Water Science Report 2018/16 6
Project Number: 17060controls over water quality. While the project was specific to Northland, the findings have been incorporated into the physiographic methodology for the national application. 3.3.2 Small advice grants Envirolink small advice grants regarding provision of technical advice were undertaken for Marlborough, Tasman District Council (Lovett and Rissmann, 2018a) and West Coast Regional Council (Lovett and Rissmann, 2018b). The primary aims of these projects were to engage with regional council staff to transfer knowledge on the application of physiographics to the respective regions. This engagement was essential to allow regional council staff to better understand the physiographic approach, the work required in application of the science, and potential benefits for water resources management at a regional and catchment scale. 4 Physiographic Approach – Overview of Methodology Identifying the landscape features which control the spatial variation in water quality is the basis of the physiographic method (Rissmann et al., 2016). Landscape features can account for more than twice the variability in water quality than land use alone (Johnson et al., 1997; Hale et al., 2003; Dow et al., 2005; King et al., 2005; Shiels, 2010; Becker et al., 2014). Natural gradients in landscape features, which we term attributes, govern the variation in the key processes that determine water composition, water quality outcomes and risk. For example, it is widely recognised that soil zone denitrification is driven by gradients in soil drainage class. While poor water quality is unlikely to occur in the absence of intensive land use, similar intensities of land use don’t always result in the same water quality issues if the underlying landscape attributes are different (e.g. different assemblages of soils, geology and hydrology). The physiographic method involves mapping the gradients in the processes governing variation in water composition as individual process-attribute layers (PAL) using GIS mapping software. National and international literature provides evidence that most differences in water quality outcomes, for a given land use pressure, across a landscape can be explained through the combination of hydrology and redox processes alone. The application of the physiographic method nationally will involve the development of these two key PALs, which are described further in the following sections. Other processes that control variation in water composition are atmospheric and weathering (erosion and deposition). These processes are necessary for a detailed understanding of water composition (e.g. hydrochemical facies and mineral saturation indices); however, they are not directly linked to water quality (i.e. nutrients, sediment, and microbiological indicators). The signals in water (chemistry) are used to verify the effective properties of the landscape. This process is important for: (i) linking landscape compartments (i.e., land surface, soil, aquifer, surface waters); (ii) understanding the relative significance of each compartment over water composition, and; (iii) refining pre-existing maps of landscape attributes that may not have been mapped with water in mind, or do not contain the key attributes governing water quality outcomes. With this integrated perspective in mind, the ultimate aim of the physiographic method is to produce a number of classed process-attribute GIS layers that depict the spatial coupling between process signals in water and landscape attribute gradients. The steps for physiographic mapping of the landscape are summarised in Figure 3. Land and Water Science Report 2018/16 7 Project Number: 17060
Figure 3: Summary of steps to develop the physiographic mapping method (Rissmann et al. in prep.).

Land and Water Science Report 2018/16                                                                8
Project Number: 17060
4.1       Hydrological Process-Attribute Layer (H-PAL)
The hydrological PAL represents the landscape controls over:
      •       Water source - where the water in a stream or aquifer originates from i.e. alpine, hill
              country, lowland precipitation altitude and age.
      •       Recharge mechanism - the broad scale mechanism/process by which water reaches an
              aquifer or stream i.e. proximal land surface recharge or distal.
      •       Water pathway - fine scale mechanism/process controlling the pathway water takes i.e.
              bypass flow, overland flow, lateral drainage and deep drainage (Figure 4).

Figure 4: Fine scale hydrological pathways.

For example, a physical attribute, such as soil texture (or particle size), is one control over the water
pathway through the landscape (Figure 5). A coarse textured gravel is at one end of the gradient,
where water can move rapidly down through the soil (by deep drainage) and surface runoff
(overland flow) is uncommon. As the soil particles weather (decreasing in size) to silt and clay size
fractions at the other end of the gradient, the hydrological pathway changes. Finer textured soils
typically have a slower permeability or infiltration rate (
Figure 5: Soil texture gradient in the unsaturated zone controlling deep drainage, lateral flow and overland
flow.
4.2 Redox Process-Attribute Layer (R-PAL)
The redox PAL represents the combined influence of:
• Soil (unsaturated zone) oxidation-reduction potential.
• Geological (aquifer) oxidation-reduction potential.
Redox processes are a type of chemical process in soil and shallow groundwater that govern a
multitude of parameters including but not limited to: the concentration of the dissolved forms of
nitrate and nitrite, oxygen, manganese, iron, sulphate, and heavy metals. Redox also indirectly
controls the leachability and mobility of P species in soils, aquifers and subsequently surface waters.
The physical attributes of soil and geology such as those identified above, can be used to explain
biogeochemical processes occurring in the landscape, as they are important for the oxidation-
reduction (redox) process (Figure 6). In basic terms, the redox state is characterised as the presence
of oxygen (oxic) or absence (anoxic) of oxygen, however it is more accurately described as chemical
reactions which involve the transfer of electrons. The chemical species which loses the electron
(increase in oxidation state) is oxidised, while the chemical species that gains the electron (decrease
in oxidation state) is reduced. Typically, well drained soils are characterised as oxidising, while poorly
drained soils are characterised as reducing.
Denitrification is a redox reaction that deals specifically with the transformation of nitrogen, in
which oxidised nitrogen (nitrate, NO3-) accepts an electron and is reduced to nitrous oxide (NO or
N2O) or nitrogen gas (N2). Denitrification is also a biological process as microbes (bacteria) drive the
chemical process.
Land and Water Science Report 2018/16 10
Project Number: 17060Figure 6: Redox process attribute gradient controlling denitrification, solubility, leachability and mobility of redox sensitive species in soils, aquifers and surface water. Mapping of these physical attributes at high resolution allows a site-specific understanding of the processes occurring which influence water quality. Such information is important to a range of environmental concerns including low dissolved oxygen in surface waters, where leached nitrate is likely to be removed by denitrification, where phosphorus is likely to be leached and/or more mobile within soils and aquifers. A spatially refined redox PAL will also enable an understanding of where shallow groundwater is likely to contain elevated manganese, iron, and arsenic (in areas with arsenic bearing minerals), limiting its potential as a drinking water source. Soil zone redox processes, in conjunction with nitrogen load, also determine the magnitude of soil zone greenhouse gas emissions, such as nitrous oxide, methane and carbon dioxide. 4.3 Physiographic Environments – Conceptual Model Physical, chemical and biological attributes are inherently coupled within a landscape, which means that similar settings in the landscape have a similar combination of attributes and can be used to form the basis of Physiographic Environments. If a set of attributes are known, the ability to predict other attributes or water composition increases (becomes statistically significant). Before physiographic environments can be delineated, we first need to let the water tell the story. Given water composition evolves as it passes through the landscape, the chemical composition of the water can be analysed to tell the waters story – what landscape has it passed through? What processes have altered its chemistry? The presence or absence of chemical signatures (including particulate material) in the water reveals the process-attribute gradients the water has experienced along its path prior to reaching the point where the water body was sampled. This is critical in validating not only the mapped attributes used to define the physiographic boundaries, but also ensures we’re not imposing a pre-determined framework on the environment. If inconsistencies are identified, it’s not the water composition that is incorrect, it’s our understanding of the processes that have occurred in the environment that need to be refined. The gradients across the process-attribute layers are subsequently grouped into classes, delineated statistically by the water quality and chemical data using cluster analysis (Rissmann et al. 2016). The number of classes is determined by statistical significance. Each class represents a unique combination of physical, chemical and biological attributes. This is completed for each process- attribute layer (H-PAL, R-PAL). In order to estimate water quality indicators (e.g. DRP), governed by one or more key processes (e.g., hydrology and redox) it is necessary to combine and intersect each Land and Water Science Report 2018/16 11 Project Number: 17060
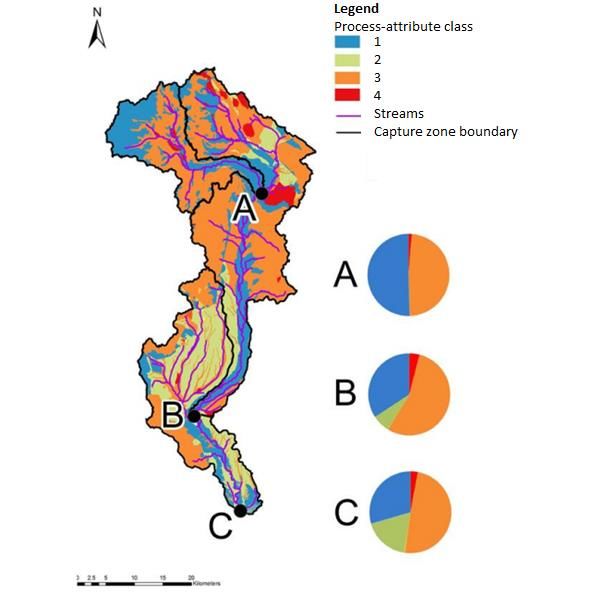
classed PAL using GIS spatial software. Combining the PALs allows those areas with similar controls
over water composition and quality (assemblages of process-attribute classes) to be identified.
These areas are termed Physiographic Environments.
The real power of the physiographic environments arises when a capture zone (watershed) is
overlaid. Figure 7 presents an example of classes from the Aparima Catchment in Southland. Points
A, B and C are surface water sampling points. The pie charts present the proportion of each
Physiographic Environment (or ‘Physiographic Unit’) on an area basis within the capture zone of
each surface water sampling point. Here the proportion of each class within a streams capture zone
determines the water quality signals at the sampling point. Further, quantifying the proportion of a
Physiographic Environment unit within each capture zone is able to accurately estimate the
longitudinal variation in water quality along the stream reach. In Southland, physiographic mapping
is so accurate that it can be used to estimate water composition for stream reaches without
monitoring data (Snelder and Dey, 2016).

Figure 7: Physiographic classes in the Aparima Catchment, Southland.

Land and Water Science Report 2018/16                                                                 12
Project Number: 17060
4.4        Validation and Performance Testing
Physiographic process-attribute layers (PALs) and Physiographic Environments are the product of a
water driven, statistically guided, classification of process-attribute gradients. As such, each PAL can
also be used as a standalone layer. There are three ways the to assess the ability of Physiographic
Environments to estimate surface and shallow ground water quality:
      1.       A hierarchical stratification of water data by PAL classes that proceeds by manually
               sorting water quality site data according to PAL classes (Rissmann et al., 2016);
      2.       A statistical assessment of the ability of Physiographic Environments and/or PAL classes
               to predict water parameters (Snelder and Dey, 2016), and;
      3.       A statistical assessment of the between zone variation in water quality (Snelder et al.,
               2016).
Performance testing of the outcomes of the Physiographics of Southland provided evidence that
water composition (and quality) varied in a highly consistent manner according to the proportion of
a given physiographic unit within a capture zone. The accuracy of the method for estimating surface
water composition likely reflects:
      •        The well-mixed/integrated nature of stream flow which may be viewed as a weighted
               mean of the drainage area.
      •        Evaluation against steady-state values (i.e. medians).
      •        The observation that the water compositional data set for each surface water site was
               broadly representative of the known flow range.
For aquifer systems, physiographic mapping was able to accurately identify and constrain the spatial
extent of previously defined groundwater nitrate, phosphorus and E. coli hotspots (Rissmann, 2012;
Rissmann et al., 2012; Snelder and Dey, 2016). The water source (recharge altitude), recharge
mechanism and redox setting were also accurately estimated for regional, unconfined aquifer
systems.

5     Data Requirements

PENZ requires regional water quality data and national spatial datasets to produce the national
classification. The spatial datasets are maintained by Crown Research Institutes and are typically
freely available for download and use. Others require data agreements with the host organisation.
Local and regional expert knowledge is required to improve the resolution of the data available.

5.1        Water quality data
The soil zone and shallow unconfined aquifers exert the most influence on surface water quality, as
they are highly connected hydrologically to surface water. Therefore, it is critical that the same
analytes are measured in both surface and groundwater samples to allow the controls over water
composition to be understood.

5.1.1       PENZ Test Set
For classification and validation of the PALs and Physiographic Environments, water samples should
be collected and analysed for the analytes identified in Table 1. These analytes are those that are
hydrologically conservative or redox sensitive. Hill Laboratories test set details are included in
Appendix 2 of this document.

Land and Water Science Report 2018/16                                                                  13
Project Number: 17060
Table 1: Surface and groundwater chemical analytes needed for classification and validation of PALs.
Hydrological PAL Redox PAL
Surface water (field or Alkalinity (Total) Dissolved Oxygen
lab filtered sample) Sodium (dissolved) Iron (dissolved)
Potassium (dissolved) Manganese (dissolved)
Calcium (dissolved) Sulphate
Magnesium (dissolved)
Silica (dissolved reactive)
Boron (dissolved)
Bromide
Fluoride*
Iodine (dissolved)*
Surface water (sample Nitrogen (Total Kjeldahl) Nitrogen (Nitrate+Nitrite)
not filtered in field) Electrical Conductivity
Chloride
Dissolved non-purgeable Organic
Carbon
Groundwater Alkalinity (Total) Dissolved Oxygen
Sodium (dissolved) Iron (dissolved)
Potassium (dissolved) Manganese (dissolved)
Calcium (dissolved) Sulphate
Magnesium (dissolved) Nitrogen (Nitrate+Nitrite)
Silica (dissolved reactive)
Boron (dissolved)
Bromide
Nitrogen (Total Kjeldahl)
Electrical Conductivity
Chloride
Dissolved non-purgeable Organic
Carbon
* Non-essential analytes
The groundwater test set is the same as the National Groundwater Monitoring Programme (NGMP),
operated by GNS Science in collaboration with regional authorities. The only additional analyte is a
field measurement of dissolved oxygen.
We recommend that each Regional Council complete 3 surface water sampling runs and 2 for
groundwater to aid with classification of the hydrological and redox gradients, with each sample
analysed for their usual water quality suite plus the set of parameters outlined in Table 1.
Surface water sampling events should be completed for each of the following flow conditions:
• Low (baseflow)
• Median
• High
Groundwater sampling of unconfined aquifers and/or artesian aquifers connected to surface water
bodies should be during the following water level conditions:
• High (winter/early spring)
• Low (summer/early autumn)
Land and Water Science Report 2018/16 14
Project Number: 17060Note that the groundwater levels should be recorded prior to sampling. Bore construction
information (screen depth, final depth, bore logs) should be provided for each sampled bore if
available.
5.1.2 Historical SOE or other water quality data
To supplement the PENZ test set and aid in validation any additional surface or groundwater water
quality data can be used. If a sub-set of the regions SOE network was sampled for PENZ, please
provide data for all other sites in the region (ideally a 5-10-year data record).
5.2 Spatial data
As physiographic environments extend through the soil zone and unconfined shallow aquifers, a
combination of existing national spatial datasets can be used to identify and map the necessary
process-attribute gradients for a region.
The following existing national datasets can be used to delineate the spatial boundaries of attributes
at a national level:
• Digital elevation model (8m DEM) - topography
• River environment classification (REC1-3) – river lines
• NIWA Virtual Climate Network – climate, precipitation
• NZLRI - soils, geology, topography
• S-Map - soils (incomplete national coverage)
• QMAP - geology and land surface age
• GNS Science Isoscape – stable isotopes of precipitation
• GNS Science Aquifer Potential
• Land cover database (LCDB4.1)
These datasets can be augmented by Regional Council data if necessary.
5.3 Local and regional expert knowledge
While the national datasets provide a good basis for mapping (especially for national coverage and
consistency), they can be limited by the spatial scale of the original surveys. For example, during the
development of the ‘Physiographics of Southland’, the water chemistry data for surface and
groundwater samples near Edendale identified that there must be strong electron donors (i.e. lignite
geology), due to strongly reducing groundwater signatures, including the absence of elevated nitrate
in the water, however these lignite deposits were not mapped in the geological data from QMAP.
Local and expert regional knowledge is therefore key for interpretation and understanding small
scale inconsistencies between the water signature and the mapped attributes to be able to produce
the most spatially accurate map from a water quality perspective for each region.
6 Project Deliverables
The PENZ project will be completed over two years starting July 2017 to the end of June 2019. Year 1
will focus on the science development followed by Year 2 application and regional validation. As part
of the funding requirement for Our Land and Water (OLW), quarterly project milestone reporting to
the OLW Directorate is required.
Land and Water Science Report 2018/16 15
Project Number: 17060The key deliverables for PENZ are a combination of geospatial layers, technical report(s) and
scientific journal articles.
The GIS layers will be produced for each collaborating region of New Zealand are:
1. Hydrological Process-Attribute Layer – water source, recharge mechanism and flow pathway
maps
2. Redox Process-Attribute Layer – unsaturated and shallow saturated zone redox maps
3. Physiographic Environments for New Zealand – areas with similar hydrological and redox
classes for which water quality risk (N, P, S, M) is similar.
The layers will be available as GIS shapefiles in addition to a web or application-based portal, such as
Google Earth. A supporting technical report will accompany the geospatial layers.
We initially had planned user guides and technical information sheets to support the Physiographic
Environments of New Zealand Map to be developed through an Envirolink Tool Grant (approximately
260K). However, the application submitted in 2017 was unsuccessful. It is possible to resubmit this
application in October 2018 with increased Regional Council support.
Our Land and Water requires the publication of a method paper to be published in an international
scientific journal. In February 2018, we presented at the Fertilizer and Lime Research Centre’s annual
conference introducing a method for integrated landscape mapping of water quality controls for
farm planning (Rissmann et al., 2018). This concept paper, along with the work undertaken in the
regions will be used to produce the final version.
7 Proposed Funding Structure for PENZ
The funding requirements are set out below and include a request to proceed with an initial
investment from each region. The planned funding structure for the project is summarised in Table
21. Operating concurrently with Year 2 of the PENZ project is a Sustainable Farming Fund Project to
make the physiographic science accessible and relevant to farmers. See Section 3.2 and Appendix 1
for more information on this project.
As the national application of the Physiographic approach is being undertaken by a private
consultancy, Land and Water Science Limited, we need to request partial payment in advance to
cover project costs. Envirolink grants are available for eligible councils. Two medium advice grants
($20,000)2 would be required to produce the 2 PALs and an unclassed Physiographic Environments
layer for a region.
Table 2: Current Funding Structure
Project Phase Funding Source Contribution Subtotal
Year 1: Science Our Land and Water NSC $70k $160,000
Development Regional Councils (currently 6 $15k per council* – $90,000
regions)
Year 2: Application Our Land and Water NSC $30k $120,000
and Validation Regional Councils (currently 6 $15k per council* – $90,000
regions)
* eligible councils can use Medium Advice Envirolink Grants
1
Funding structure does not reflect the timing of project costs and expenditure.
2
Includes overheads for the Waterways Centre of $5,000.
Land and Water Science Report 2018/16 16
Project Number: 170608 Actions required by each Regional Council
• Contact Lisa Pearson at Land and Water Science, Invercargill at lisa@landwatersci.net or on
(03) 214 3003 for further information or to arrange a contract for your region.
• Add the additional analytes to the regional SOE water quality sampling for a minimum of 3
surface water quality runs and 2 groundwater quality runs.
• Provide both surface and groundwater historic water quality data for the region (ideally 5-
10-year period).
• Eligible councils can request the Envirolink templates drafted for the PENZ project.
9 Testimonials
“The Physiographic Approach is a unique and holistic methodology that has revealed insights yet
unrecognised into the drivers of water hydrochemistry and quality.”
Peter Almond, Associate Professor - Soil and Physical Sciences,
Faculty of Agriculture and Life Sciences
Lincoln University
“The project entitled “Physiographics of Southland” is a remarkable achievement in interdisciplinary
water quality research. Just because of the data-intensive work using state-of-the-art GIS, the
project is laudable. What is more significant is its use of a large amount of research-quality data to
identify mechanisms that control surface water and shallow groundwater quality, and not simply use
the data for some form of black-box statistical analysis. I find the approach taken here compelling
and a significant advance on other interdisciplinary approaches worldwide. It is strongly research-
based, and pushes the state-of-the-art in terms of field science, data collection, and data analysis.”
Professor Mark Milke
Department of Engineering and Natural Resources,
University of Canterbury
10 Acknowledgements
We would like to acknowledge the contribution Environment Southland has made to this research.
The Physiographic approach was developed by the Science Team, as part of the Southland Science
Programme over several years. For more information on the ‘Physiographics of Southland’ see
http://waterandland.es.govt.nz/southland-science/physiographic-zones.
The conceptual graphics used in this document and those from the Physiographics of Southland
were produced by Janet Hodgetts, SciArt.
Land and Water Science Report 2018/16 17
Project Number: 1706011 References
Becker, J. C., Rodibaugh, K. J., Labay, B. J., Bonner, T. H., Zhang, Y., & Nowlin, W. H. (2014).
Physiographic gradients determine nutrient concentrations more than land use in a Gulf Slope
(USA) river system. Freshwater Science, 33(3), 731–744.
Clark, I.D. and Fritz, P. (1997). Environmental Isotopes in Hydrogeology. Taylor & Francis.
Hale, S. S., Paul, J. F., & Heltshe, J. F. (2004). Watershed landscape indicators of estuarine benthic
condition. Estuaries, 27(2), 283–295. http://doi.org/10.1007/BF02803385
Hughes, B., Wilson, K., Rissmann, C., and Rodway, E. (2016). Physiographics of Southland:
Development and application of a classification system for managing land use effects on water
quality in Southland. Environment Southland Technical Report 2016/11.
Hughes, B. and Wilson, K. (2016). Guide for using the Southland physiographic zones technical
sheets. Environment Southland report 2016/12.
Indamar, 2012: The Use of Geochemical Mixing Models to Derive Runoff Sources and Hydrologic
Flow Paths. Forest Hydrology and Biogeochemistry. pp 163-183. Part of the Ecological Studies
book series (ECOLSTUD, volume 216). Springer Link Publishing.
Johnson, L., Richards, C., Host, G., & Arthur, J. (1997). Landscape influences on water chemistry in
Midwestern stream ecosystems. Freshwater Biology, 37(1), 193–208.
Kendall, C., and McDonell, J.J., (1998). Isotope Tracers in catchment hydrology. Elsevier, Amsterdam.
King, R. S., M. E. Baker, D. F. Whigham, D. E. Weller, T. E. Jordan, P. F. Kazyak, and M. K. Hurd. 2005.
Spatial considerations for linking watershed land cover to ecological indicators in streams.
Ecological Applications 15:137–153.
Lovett, A. and Rissmann, C. (2018a) Evaluation of the physiographic method for the Tasman Region.
Land and Water Science Report 2018/04. 26p.
Lovett, A. and Rissmann, C. (2018b). Advice for application of the physiographic method to the West
Coast Region. Land and Water Science Report 2018/08. 6p.
Ministry for Environment, (2014). National Policy Statement for Freshwater Management. ME1155.
Pearson, L., Rissmann, C., and Lindsay, J. (2018a). Waituna Catchment: Risk Assessment. Land and
Water Science Report 2018/02. Prepared for Living Water. 43p.
Pearson, L., Rissmann, C., and Lindsay, J. (2018b). Waituna Catchment: Physiographic Stocktake.
Land and Water Science Report 2018/03. Prepared for Living Water. 90p.
Peters, N. E. (1994). Biogeochemistry of small catchments: A tool for environmental research.
Biogeochemistry of Small Catchments: A Tool for Environmental Research, 207–228.
https://doi.org/10.1029/93WR02950.
Rissmann, C., Rodway, E., Beyer, M., Hodgetts, J., Snelder, T., Pearson, L., Killick, M., Marapara, T.,
Akbaripasand, A., Hodson, R., Dare, J., Millar, R., Ellis, T., Lawton, M., Ward, N., Hughes, B.,
Wilson, K., McMecking, J., Horton, T., May, D., and Kees, L. (2016). Physiographics of
Southland Part 1: Delineation of key drivers of regional hydrochemistry and water quality.
Environment Southland Technical Report 2016/3.
Rissmann, C., Marapara, T., Bloomberg, S., Lindsay, J., and Pearson, L. (2017). Evaluation of
geospatial datasets and recognition of landscape gradients specific to water quality. e3
Scientific Report for Northland Regional Council. December 2017. 99p.
Land and Water Science Report 2018/16 18
Project Number: 17060Rissmann, C., Pearson, L., Lindsay, J. Marapara, M., and Badenhop, A. (2018a). Waituna Catchment:
Technical Information and Physiographic Application. Land and Water Science Report
2018/01. Prepared for Living Water, 133p.
Rissmann, C., Pearson, L., Lindsay, J., Beyer, M., Marapara, T., Badenhop, A., and Martin, A. (2018b).
Integrated landscape mapping of water quality controls for farm planning – applying a high
resolution physiographic approach to the Waituna Catchment, Southland. In: Farm
environmental planning – Science, policy and practice. (Eds. L. D. Currie and C.L. Christensen).
http:flrc.massey.ac.nz/publications.html. Occasional Report No. 31. Fertilizer and Lime
Research Centre, Massey University, Palmerston North, New Zealand. 19 pages.
Rissmann, C. and Beyer, M. (2018). Waituna Catchment: Temporal Variation. Land and Water
Science, Report 2018/09. Prepared for Living Water, 11p.
Shiels, D. R. (2010). Implementing landscape indices to predict stream water quality in an agricultural
setting: An assessment of the Lake and River Enhancement (LARE) protocol in the
Mississinewa River watershed, East-Central Indiana.Ecological Indicators, 10(6), 1102–1110.
Snelder, T., and Dey, K. (2016). Assessment of the performance of the Southland physiographic
science framework to estimate shallow ground and surface water composition. Land and
Water People technical report for Environment Southland.
Snelder, T., Hughes, B., Wilson, K., and Dey, K, (2016). Physiographic Zones for the Southland Region:
Classification system validation and testing report. Water Land People report prepared for
Environment Southland. 60p.
Land and Water Science Report 2018/16 19
Project Number: 17060Appendix 1 – Sustainable Farming Fund (SFF) Application
Project Overview
Title Response
Project Number 405475
Project Title Farmer interface for Physiographic Environments
Proposed Start Date 01/07/2018
Proposed End Date 30/06/2021
Amount Requested $444,200.00
Sector Arable;Aquaculture;Dairy;Fibre;Forestry;Horticulture;Meat;Viticulture;Poultry
Sub Sector Grasslands;Vegetables;Grain;Floriculture;Seed
Crops;Cattle;Goats;Sheep;Alpaca;Indigenous;Berry fruit;Kiwifruit;Pip fruit;Tree
crops;Beef Cattle;Deer;Pigs;Wine;Vines;Geese;Commercial Forestry;Farm
Forestry
Region National
Topic Decision Mgmt & Support;Farm Management;Nutrient Management;Soil
Management;Water Quality
Applicant Group Name Land and Water Science Ltd.
Project Details
Project Summary
This project aims to improve water quality by placing state-of-the-art science into the hands of farmers, and
into the heart of their land use decisions. Physiographic Environments of New Zealand (PENZ) shows
farmers how potential contaminants are likely to travel within their farm boundaries, allowing farmers to
consider what actions they can take to minimise water contamination risks. Under this project we would
work with the primary industry groups to create a free web-based spatial platform to help inform farmers
land use decisions. The intent is that this platform would be utilised by individual farmers, farmer-led
catchment groups and be adopted into industry’s extension programmes, to leverage off their existing
extension activities. At the completion of this project, we want farmers, their industry groups and other
trusted advisers to be using the rich information sources, available to them for the first time in an accessible
way, to make informed land use decisions that optimise their natural capital and minimise as far as possible
the impacts of their land use on the environment.
Physiographic Environments of New Zealand (PENZ) is a three-year, Our Land and Water (OLW) affiliated
project that uses a forensic approach to identify links between water and the land to produce a map of
‘how’ and ‘why’ water quality outcomes vary across a catchment (surface water), aquifer (groundwater),
region, or country. Natural variation in landscape features often account for more than twice the
variability in water quality than land use alone[1]. This means that despite similar land use pressures,
Land and Water Science Report 2018/16 20
Project Number: 17060You can also read