Perceiving Music Quality with GANs - Agrin Hilmkil, Carl Thom e, Anders Arpteg
←
→
Page content transcription
If your browser does not render page correctly, please read the page content below
Perceiving Music Quality with GANs

                                                                                Agrin Hilmkil, Carl Thomé, Anders Arpteg
                                                                                                              Peltarion
arXiv:2006.06287v2 [cs.SD] 4 Apr 2021

                                                                    Abstract
                                          Several methods have been developed to assess the percep-
                                          tual quality of audio under transforms like lossy compression.
                                          However, they require paired reference signals of the unaltered
                                          content, limiting their use in applications where references are
                                          unavailable. This has hindered progress in audio generation
                                          and style transfer, where a no-reference quality assessment
                                          method would allow more reproducible comparisons across
                                          methods. We propose training a GAN on a large music library,
                                          and using its discriminator as a no-reference quality assess-
                                          ment measure of the perceived quality of music. This method
                                          is unsupervised, needs no access to degraded material and can
                                          be tuned for various domains of music. In a listening test with
                                          448 human subjects, where participants rated professionally
                                          produced music tracks degraded with different levels and types
                                          of signal degradations such as waveshaping distortion and low-
                                          pass filtering, we establish a dataset of human rated material.
                                          By using the human rated dataset we show that the discrimi-
                                          nator score correlates significantly with the subjective ratings,
                                          suggesting that the proposed method can be used to create a
                                          no-reference musical audio quality assessment measure.

                                                                Introduction
                                        Audio quality is usually estimated by the difference between                 Figure 1: A random sample of mel spectrograms produced by
                                        a clean reference signal y and a listenable output ŷ (Campbell,             the generator for a random selection of genres. One may note
                                        Jones, and Glavin 2009). By computing the error signal with                  the strong harmonics of the Classical segment and contrast
                                        a metric d(y, ŷ), such as the mean squared error (MSE) of                   them with the more distorted ones appearing in Rock.
                                        spectrograms (Hines et al. 2015), a subsequent quality assess-
                                        ment can be realized by interpreting the remaining frequency
                                        content (Thiede et al. 2000).
                                           While straightforward in principle, the MSE does not fol-                    For example, in order to rank live recordings (Li et al.
                                        low human perception (Hines et al. 2015) and it is easy to                   2013) in terms of audio quality, we would first have to time
                                        construct signal pairs with a large distance that sound very                 align the recordings with the studio recording which is a hard
                                        similar, or signals that have a small distance yet sound noth-               problem in itself. Similarly problematic are the cases where
                                        ing alike. Therefore considerable work has been done on de-                  a reference signal is unavailable or does not exist. When
                                        veloping perceptually oriented metrics such as PEAQ (Thiede                  developing style transfer algorithms for musical audio for
                                        et al. 2000), Barbedo’s model (Barbedo and Lopes 2005),                      example (Huang et al. 2019), the current best practice for
                                        Moore’s model (Moore et al. 2004) and PEMO-Q (Huber                          evaluating algorithms is to manually listen to sample outputs
                                        and Kollmeier 2006). The essence is typically to filter the                  and collect a mean opinion score (MOS). This process is
                                        signals in various ways to measure different frequencies dif-                typically labor intensive yet hard to replace.
                                        ferently, inspired by knowledge of the human auditory sys-                      The same fundamental problem hinders musical audio gen-
                                        tem and music cognition (Campbell, Jones, and Glavin 2009).                  eration research (Dieleman, van den Oord, and Simonyan
                                        Aside from depending on extensive domain expertise, these                    2018) and even though rough heuristics like estimating mu-
                                        methods all have a hard requirement on the existence of a                    sical consonance by detecting pitch events could potentially
                                        reference signal, which severely limits their applicability.                 provide some guidance, it is probable that even the most well
considered heuristic would still fail to capture important nu-     different distortions and performed best compared to other
ances like whether a physically plausible timbre is present,       state-of-the-art quality measures.
or whether the piece is performed with an appropriately ex-           A third approach is to consider quality as a ranking prob-
pressive musical performance.                                      lem. By relating multiple versions of the same song like
   In short, there is simply no good method available for deter-   various recordings of the same live performance it is pos-
mining the quality of musical audio and it is crucially missing    sible to retrieve the best sounding versions (Li et al. 2013;
for large scale quality assessment (QA). Instead of relying        Cai 2015). The requirement that signals be grouped is, how-
on subjective listening tests, employing a no-reference QA         ever, too limiting for general use.
measure would speed up algorithm development and promote              An alternative problem formulation is to predict underlying
reproducible research.                                             mix settings by obtaining cues about the signal mixing pro-
   In this work we approach no-reference QA by way of gen-         cess and ideally recovering exact audio effect settings (Fourer
erative modelling. Generative adversarial networks (GANs)          and Peeters 2017). Such cues need to be mapped to perceived
have recently shown promise in modelling musical au-               quality, however, and that is a big task in itself. While there
dio (Donahue, McAuley, and Puckette 2019; Engel et al.             are reasonably objective qualities for speech (e.g. intelligi-
2019). Arjovsky, Chintala, and Bottou (2017) observed in           bility), for musical audio what qualities are important can be
their work that the perceived quality of generated content         ambiguous and highly context-sensitive. For example, distor-
in a GAN correlates with the loss of the critic. Therefore,        tion is expected in rock music and frowned upon in classical
we propose a GAN based method for no-reference QA. The             music.
GAN is trained to model the empirical distribution of music
with high production quality. Its discriminator, adversarially                                Method
trained to detect out of distribution samples, is used as a mea-   Data
sure of perceived quality. This method is unsupervised and         The underlying dataset used is from an online service for
has the advantage of being tunable to different domains, such      music1 of professionally produced, high-quality music. It
as genres, in order to handle interactions between genre and       contains a wide range of music and is curated to conform
perception of audio effects. By establishing human quality         well to contemporary music, as it is intended for use by
ratings on a varied test set of both clean and degraded mu-        content creators. Using their catalog we created a balanced
sic signals we show that the discriminator score correlates        subset (Table 1) of mutually exclusive genres.
significantly with the subjective ratings, and therefore is pre-
dictive of human perception of quality. We further validate
                                                                    Genres                  Tracks       Duration         Ratio
the plausibility of our model by studying the content it gener-                                          [H:M:S]
ates (Figure 1). To promote future work into this area we are
releasing an open source implementation and trained model           Acoustic                  165         6:08:08        7.09%
upon publication.                                                   Blues                     165         7:29:28        8.65%
                                                                    Classical                 165         5:37:29        6.50%
                                                                    Country                   165         7:02:08        8.13%
                      Related work                                  E. & D.                   165         7:16:33        8.41%
Historically there has been great interest in comparing and de-     Funk                      165         5:11:34        6.00%
veloping audio compression methods for signal transmission,         Hip-hop                   165         6:57:50        8.05%
leading to progress in reference based methods (Campbell,           Jazz                      165         6:53:18        7.96%
Jones, and Glavin 2009). The no-reference setting has not           Latin                     165         6:09:53        7.12%
received as much attention. Meanwhile, for image content,           Pop                       165         7:58:05        9.21%
blind quality estimation has progressed with deep belief net-       Reggae                    165         5:56:39        6.87%
works (DBNs) even outperforming state-of-the-art reference          Soul                      165         8:01:44        9.28%
based methods (Tang, Joshi, and Kapoor 2014). Their ap-             Rock                      165         5:50:31        6.75%
proach relied mostly on unsupervised pre-training, though, as       All                      2145        86:41:06         100%
opposed to our method also applied supervised fine-tuning.
   Fully supervised, discriminative models have been applied       Table 1: Summary of the size of the available dataset. Elec-
to audio, although on small datasets. Artifical neural net-        tronica & Dance has been abbreviated E. & D.. Ratio shows
works (ANNs) have been used to map values of perceptually-         the ratio of genre duration to total duration.
inspired features to a subjective scale of perceived qual-
ity (Manders, Simpson, and Bell 2012). Training data con-             Although there is some variation in the number of hours
sisted of values of perceptual measures obtained from ten          available per genre, our training procedure further balances
different excerpts of orchestral music processed by a sim-         this data and ensures that we consume an equal amount of
plified model of a hearing aid with an adaptive feedback           data from each genre. We create a training set (80%), a test
canceller, and corresponding subjective quality ratings from       set for human evaluation (3%) and a reserved set for future
27 normal hearing subjects. Another study found that qual-         use (17%) by uniformly sampling the proportions from each
ity measures employing valid auditory models generalized           genre. All tracks are 48 kHz / 24-bit PCM stereo mixes.
best across different distortions (Harlander, Huber, and Ewert
                                                                      1
2014). Their models were able to predict a large range of                 https://www.epidemicsound.com/music/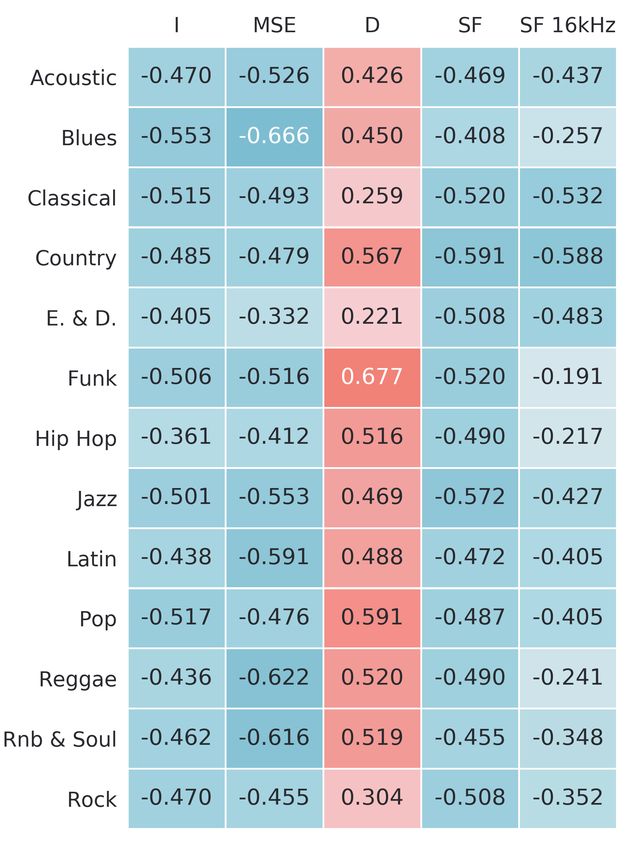
Degrading audio quality                                            segment?”, and may be answered on the ordinal scale: “Bad”,
To include tracks of varying quality we introduce a set of         “Poor”, “Fair”, “Good” and “Excellent”, corresponding to
signal degradations with the following open-source REAPER          numerical values 1-5.
JSFX audio plugins (Frankel and Schwartz 2019):                       Rating aggregation Once all tasks are completed the
                                                                   ratings are aggregated to produce one perceived quality rating
• Distortion (loser/waveShapingDstr) Waveshap-                     per segment. Since participants are listening in their own
  ing distortion with the waveshape going from a sine-like         respective environments we are concerned with lo-fi audio
  shape (50%) to square (100%).                                    equipment, or scripted responses trying to game AMT. Thus
• Lowpass (Liteon/butterworth24db) Low-pass fil-                   we use the median over the mean rating to discount outliers.
  tering, a 24 dB Butterworth filter configured to have a             Cheating The following schemes are applied in an at-
  frequency cutoff from 20 kHz down to 1000 Hz.                    tempt to reduce cheating or participants not following instruc-
• Limiter (loser/MGA JSLimiter) Mastering limiter,                 tions:
  having all settings fixed except for the threshold that was      • Multiple submissions by the same participant despite warn-
  lowered from 0 dB to -30 dB (introduces clipping artifacts).       ings that this will lead to rejection are all rejected
• Noise (Liteon/pinknoisegen) Additive noise on a                  • Tasks completed in a shorter amount of time than the total
  range from -25 dB (subtly audible) to 0.0 dB (clearly audi-        duration of all segments in the task are rejected
  ble).
                                                                   • Tasks where all segments are given the same rating despite
   Plugins were applied separately to each track without ef-         large variation in degradation intensity are rejected
fects chaining. The parameter of each plugin is rescaled to
[0, 100] and considered the intensity of the degradation. Each     • The number of tasks available at any moment is restricted
time a degradation is applied an intensity is randomly chosen        to 50, as a smaller amount has been shown to decrease the
from the uniformly distribution of the range.                        prevalence of cheating (Eickhoff and de Vries 2013)

Human perceived listening quality                                  Music representation
We create a dataset with music segments and their corre-           All tracks are downsampled to mono mixes at 16 kHz / 16-bit
sponding human-perceived listening quality from the test set,      for training the GAN. This limits the highest possible fidelity,
to evaluate our methods effectiveness. This evaluation dataset     but makes it easier to cover longer time-spans while reducing
is made freely available2 . As a convenient method for getting     data loading time and memory-footprint.
human ratings from a wide population we turn to crowd-                Like SpecGAN (Donahue, McAuley, and Puckette 2019)
sourcing the task on Amazon Mechanical Turk (AMT). This            and GANSynth (Engel et al. 2019) we use a time-frequency
has the advantage of allowing significantly larger scale than      representation. This allows us to adopt existing GAN architec-
controlled tests, though introduces some potential problems        tures, which is especially important as GANs are notoriously
such as cheating and underperforming participants, which we        difficult to train and small changes of hyperparameters often
handle as described in this section.                               result in various issues.
   Music segments From the tracks in the test set we ran-             Spectrograms are produced by the short-time Fourier trans-
domly pick 3 segments per track with a duration of 4 seconds,      form (STFT) with 2048 sample-length Hann windows, 256
producing 195 segments. Additional segments of varying             samples apart. A Mel filterbank of 256 bands was applied
quality are created by degrading each original segment once        to the magnitudes in the frequency domain to reduce the
with each degradation type, yielding 975 segments in total.        dimensionality while preserving frequency resolution in the
   Task assignment Tasks to be completed by human par-             middle register. The resulting Mel filtered spectrograms were
ticipants are created to rate segments for their listening qual-   log scaled and individually rescaled to the range [−1, 1].
ity. Segments are randomly assigned to tasks such that each
task contains 10 segments, never contains duplicates and           Model
each segment occurs in at least 5 tasks. Participants may only
perform one task, in order to avoid individuals biases. In total   Despite the similarities between images traditionally mod-
we produce 488 tasks resulting in 4880 individual segment          elled by GANs and the mel spectrograms we aim to model,
evaluations.                                                       there are certain differences that may make modelling harder.
   Task specification During a task, each participant is           In particular, components of individual audio objects tend to
asked to specify which type of device they will use for lis-       be non-local (Wyse 2017), which may be difficult for purely
tening from the list: “smartphone speaker”, “speaker”, “head-      convolutional models to capture due to their limited recep-
phones”, “other”, “will not listen”. If any other option than      tive field. For this reason we use the SAGAN (Zhang et al.
“speaker” or “headphones” is selected that submission is re-       2019), which incorporates self-attention to compute features
jected and the task re-assigned. For each segment in the task      from the full spatial extent of a layer of activation maps. Fur-
we ask the user for an assessment of audio quality, not mu-        thermore, we maintain SAGANs use of the projected cGAN
sical content (Wilson and Fazenda 2016). The question is           (Miyato and Koyama 2018) to allow the model to be tuned
phrased as: “How do you rate the audio quality of this music       individually for the different genres, in line with the expec-
                                                                   tation that for example distortion may be expected in rock
   2
       https://github.com/Peltarion/pmqd                           music yet be perceived as of low quality in classical music.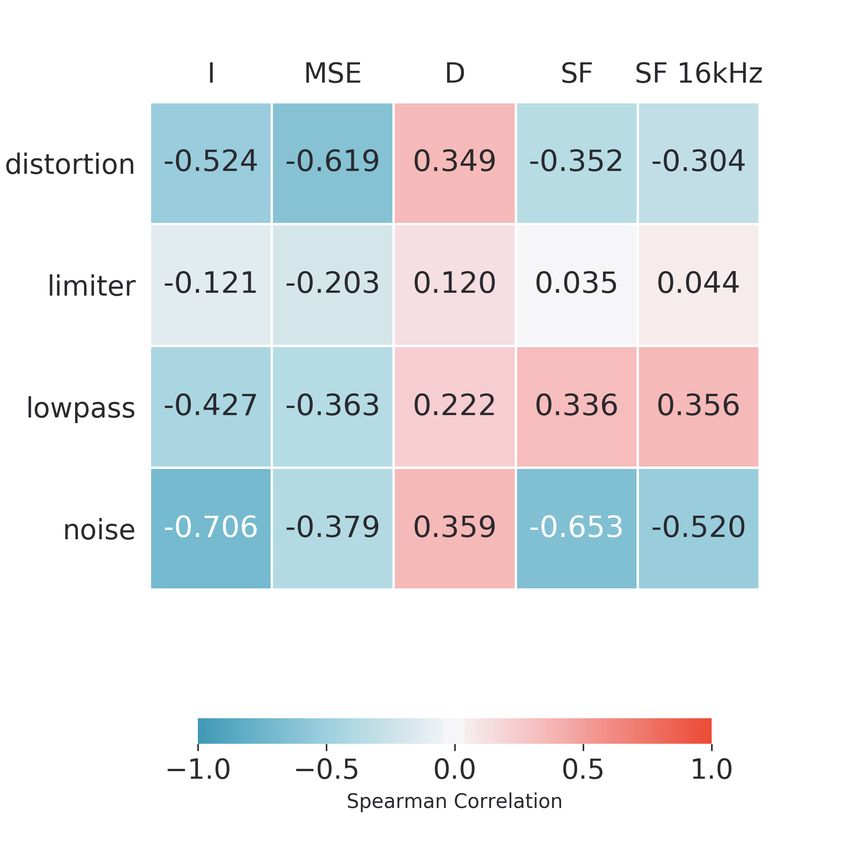
In our case we aim to model the distribution pXy of mel
spectrograms x ∈ Xy from genre y ∈ Y. The generator G
learns a mapping such that G(z, y) ∼ pXy when z ∼ pZ , by
competing against a discriminator D attempting to tell real
samples x apart from generated ones G(z, y). The samples
z ∈ Z are referred to as noise and the dimensionality of
Z and family of pZ are considered hyperparameters. Like
Zhang et al. (2019) we alternate by minimizing the hinge-
losses (Lim and Ye 2017) corresponding to D and G:

        LD = −Ex∼pX [min(0, −1 + D(x, y))]
           − Ez∼pZ [min(0, −1 − D(G(z, y), y)] ,          (1)
        LG = −Ez∼pZ [D(G(z, y), y] .                      (2)

Training parameters                                              Figure 2: Violin plot illustrating the distribution of discrim-
The GAN architecture used is the 256×256 BigGAN (Brock,          inator score for the median human rating of each clip, with
Donahue, and Simonyan 2019) but without applying any of          densities truncated to the observed range of data.
the additional losses, and handling z, y like in SAGAN. We
set the channel width multiplier to 64 for both generator and
discriminator. The input noise z is 120 dimensions sampled       of our method (Table 2). This shows that our method cor-
from a standard normal distribution, N (0, I). Training is       relates in rank to the human rating with a high significance
towered across 4 Titan X Pascal GPUs with 12GB memory            (p = 3.225 · 10−44 ) over the entire rated dataset. Broken
each, which restricted our batch size to 6 samples per tower.    down by different subsets it is seen to perform significantly
The generator is trained with the learning rate 1 · 10−4 and     better on the genres Funk, Pop and Country. Furthermore,
the discriminator with the learning rate 2 · 10−4 . Updates      it shows less significant correlation with the human rating
are done sequentially with the discriminator being updated       when degraded by a limiter or a low-pass filter.
twice for each generator step. Real samples are fed to the
discriminator by randomly sampling tracks from the training      Comparison to other measures
set without replacement, from which a uniformly random           Since we are not familiar with any method for perceptual
segment is selected to construct each batch. Once all tracks     quality scoring without references we choose a number of
have been sampled we consider an epoch to have passed and        well known measures to compare with D. The two first are
restart to produce the next epoch. Training is stopped when      the known degradation intensity and a reference based metric,
a batch of mel spectrograms are generated which look close       and thus do not comprise fair comparisons, yet help put the
to real mel spectrograms. While there are starting to appear     results in context. The selected measures are:
methods for determining when to stop training of GANs we         • I Intensity of the degradation
are not familiar with any that are shown to consistently work
well when generating audio.                                      • MSE Mean Squared Error between the original waveform
                                                                   and the final, possibly degraded waveform
Perceptual scoring                                               • SF Spectral flatness of the audio at the original 48kHz /
In this work we refer to D(x, y) as the discriminator score.       24bit stereo content averaged over the entire clip
When the discriminator score is correlated to human per-         • SF 16kHz Spectral flatness of the audio downsampled to
ceived music quality it is given a mel spectrogram of the          16kHz / 16bit mono
same segment of audio as was rated by human annotators,
but like the training data it is downsampled to 16kHz / 16bit    Spectral flatness (SF), with implementation by McFee et al.
mono mix. Furthermore, the discriminator is provided with        (2019), was chosen since it has been designed to detect noise,
the genre of each sample. This conveniently allows us to         and would form an interesting point of comparison due to
handle the genre dependent qualities.                            the inclusion of noise in the degradations used. To illustrate
                                                                 what is possible at the sample rate available to our method we
                          Results                                also evaluate SF on the same 16kHz downsampled version
                                                                 of the segments consumed by the GAN. All these measures
Correlation with human opinion                                   are shown by their correlation to each other and to the human
We illustrate the distribution of the discriminator score (D)    rating broken down by different subsets in Figure 3. Note that
for different ratings in Figure 2. This shows that the median    the listed measures are expected to have negative correlation
values of D for each rating increase monotonically, suggest-     with the rating, whereas our method (D) is expected to have
ing that the method may be particularly suitable for ranking     a positive correlation, whereby the most relevant comparison
collections of data. Similar to Tang, Joshi, and Kapoor (2014)   is by magnitude.
we study the Spearman correlation between our method and            The measure with the strongest absolute correlation to the
the collected ratings of clips to evaluate the effectiveness     human rating is MSE at −0.510 (Figure 3a). Our method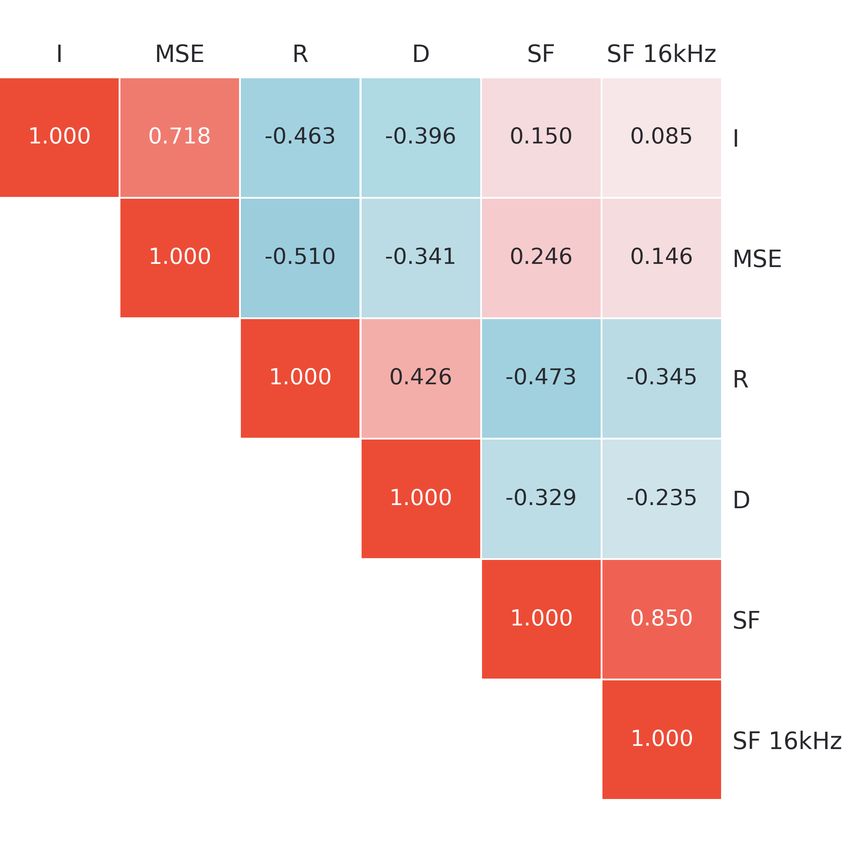
(a) (b) (c)
Figure 3: (a) Pairwise correlation between measures, (b) Correlation to median human rating by degradation type, (c) Correlation
to median human rating by genre. R median human rating, I intensity of degradation, MSE between original and degraded clip, D
(ours) discriminator score, SF spectral flatness at 48kHz and SF 16kHz spectral flatness at 16kHz. Of particular interest is the
sign change in (b) for SF and SF 16kHz. Furthermore, for some genres D is significantly more correlated to the median rating
than other measures, including MSE and I.
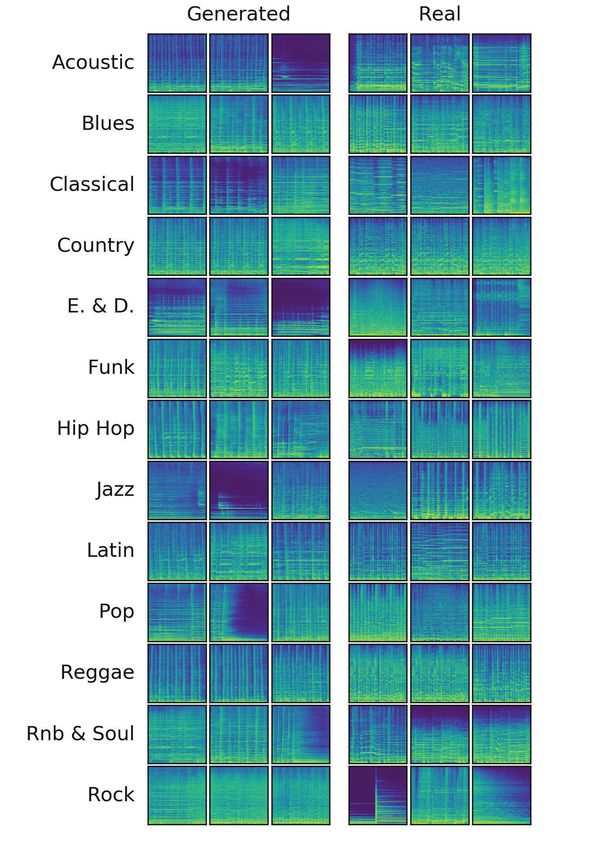
D is close in magnitude (0.426) and performs significantly capture behaviors like clear attack, decay, sustain and release
better than SF (−0.345) when using the same fidelity content, phases. Furthermore, we see expected differences between
though slightly lower than SF at the full 48 kHz / 24bit genres such as stronger harmonics in classical music whereas
(−0.473). Despite this, SF is not a generally useful predictor rock appears more distorted.
of human rating, as can be seen by the sign changes for A larger sample of generated and real mel spectrograms
both versions across different types of degradation (Figure is shown in Figure 4. By comparing the generated samples
3b). Our method D on the other hand maintains a monotonic against the real we see several important differences. Most
correlation with human rating. Surprisingly, when broken noticeable is that the real mel spectrograms tend to have
down by genres (Figure 3c), our method D outperforms all stronger and more synchronized harmonics and larger varia-
other measures, including the parameter of the generating tion among samples. Two common failures of the generated
process I and the reference based MSE, on the genres Funk, spectrograms are their unsynchronized attack phases and
Hip-Hop and Pop. seemingly missing parts of spectrograms.
Effect of degradation intensity Conclusion and discussion
By studying column I of Figure 3b the effect of the intensity We have shown that a GAN discriminator is indeed predictive
for each degradation may be studied. It is clear that adding of the perceived quality of music. The discriminator score
noise is by far the strongest detriment to perceived quality has a significant correlation with human perceived quality for
(ρs (R, I) = −0.706), whereas the limiter barely produces the data presented. Compared to some constructed measures
a significant effect on the rating (ρs (R, I) = −0.121). In it performs favorably, showing a slightly weaker correlation
Figure 3c we see that the lowest rank correlation between than measures with reference or ground truth knowledge. The
intensity and rating across genres is for Hip Hop (−0.361), spectral flatness at the full 48kHz / 24 bit material does show
which is likely due to the genre regularly incorporating some a correlation to the human rating of larger magnitude due to
of the chosen degradations as sound effects. the strong effect of noise on the quality. It is for that reason,
however, not generally applicable across different types of
Generation degradations. The discriminator score is shown to have a
As a final verification that the GAN does learn to model the notably strong correlation with perceived quality for certain
distribution of mel spectrograms we qualitatively study a set genres, including Hip-Hop. This is of particular interest since
of generated samples. A random sample of generated mel Hip-Hop is among the most challenging genres, seen by
spectrograms is shown in Figure 1. This shows that generated the weak correlation of degradation intensities and other
samples often contain clearly defined harmonics and is able to measures to the perceived quality of content.Subset Correlation p-value
Genre
Acoustic 0.426 1.400 · 10−4
Blues 0.450 5.657 · 10−5
Classical 0.259 2.468 · 10−2
Country 0.567 1.110 · 10−7
E. & D. 0.221 5.662 · 10−2
Funk 0.677 2.664 · 10−11
Hip Hop 0.516 2.123 · 10−6
Jazz 0.469 2.166 · 10−5
Latin 0.488 1.031 · 10−5
Pop 0.591 2.321 · 10−8
Reggae 0.520 1.752 · 10−6
Rnb & Soul 0.519 1.871 · 10−6
Rock 0.304 7.909 · 10−3
Degradation
Distortion 0.349 5.937 · 10−7
Limiter 0.120 9.380 · 10−2
Lowpass 0.222 1.830 · 10−3
Noise 0.359 2.638 · 10−7
All 0.426 3.225 · 10−44
Table 2: Spearman correlation between discriminator score
and median rating with significance values for different sub-
sets across genres, types of degradation and all data.
Interestingly, the GAN discriminator is able to perform
this task without access to any type of degradation during
training and without a reference at test time, making the
method attractive to use. Though we do not discount the Figure 4: Generated and real log-scaled Mel spectrograms
possibility that training discriminative models on annotated from each genre in the dataset.
datasets might be fruitful, defining a broad range of negative
examples (i.e. low quality musical audio) requires extensive
domain knowledge of music production, composition and batch size during training such as in (Brock, Donahue, and
acoustics. In our work we are circumventing this by only Simonyan 2019) would be a readily available method for
modeling positive examples of high quality musical audio. improving the GAN.
This also means adapting it to new domains like other genres • The discriminator’s ability to perceive quality could be
becomes simple, and requires no fundamental exploration of related to its importance in performing anomaly detection.
the applicable types of degradation. As there are multiple methods of performing anomaly
detection using GANs (Schlegl et al. 2017) it would be
Suggested directions of future work interesting to compare such methods to the one presented
The advantages of this method and these first positive results here.
warrant further work into audio perception through generative
modelling. Therefore, as a final remark, we would like to • The discriminator score’s correlation with human rating
suggest a few directions for future work to further explore should be benchmarked against a more perceptually accu-
this method. rate metric such as PEAQ instead of MSE.
• The human rated data quality should be improved. It would
be interesting to not only increase the magnitude of the References
crowdsourced listening, but those findings should also [2017] Arjovsky, M.; Chintala, S.; and Bottou, L. 2017.
in the future be expanded to include controlled trials to Wasserstein generative adversarial networks. In Proceedings
improve and verify the quality of the data. of the 34th International Conference on Machine Learning,
• Improving the performance of the GAN. As we show in the 214–223. Sydney, Australia: PMLR.
results the generated mel spectrograms do exhibit certain [2005] Barbedo, J. G. A., and Lopes, A. 2005. A new cogni-
convincing features yet show plenty of room for improve- tive model for objective assessment of audio quality. Journal
ment. In particular, increasing the stability by a larger of the Audio Engineering Society 53(1):22–31.[2019] Brock, A.; Donahue, J.; and Simonyan, K. 2019. Large ACM International Conference on Multimedia, MM ’13, 63–
scale GAN training for high fidelity natural image synthe- 72. New York, NY, USA: ACM.
sis. In Proceedings of the 7th International Conference on [2017] Lim, J. H., and Ye, J. C. 2017. Geometric gan. arXiv
Learning Representations. New Orleans, LA, USA: OpenRe- preprint arXiv:1705.02894.
view.net.
[2012] Manders, A. J.; Simpson, D. M.; and Bell, S. L. 2012.
[2015] Cai, J. 2015. Music content analysis on audio quality Objective prediction of the sound quality of music processed
and its application to music retrieval. Master’s thesis, Dept. by an adaptive feedback canceller. IEEE Transactions on
of Computer Science, National University of Singapore, Sin- Audio, Speech, and Language Processing 20(6):1734–1745.
gapore. [2019] McFee, B.; McVicar, M.; Balke, S.; Lostanlen, V.;
[2009] Campbell, D.; Jones, E.; and Glavin, M. 2009. Audio Thomé, C.; Raffel, C.; Lee, D.; Lee, K.; Nieto, O.; Zalkow,
quality assessment techniques: A review, and recent develop- F.; Ellis, D.; Battenberg, E.; Yamamoto, R.; Moore, J.; Wei,
ments. Signal Processing 89(8):1489–1500. Z.; Bittner, R.; Choi, K.; nullmightybofo; Friesch, P.; Stöter,
[2018] Dieleman, S.; van den Oord, A.; and Simonyan, K. F.-R.; Thassilo; Vollrath, M.; Golu, S. K.; nehz; Waloschek,
2018. The challenge of realistic music generation: mod- S.; Seth; Naktinis, R.; Repetto, D.; Hawthorne, C.; and Carr,
elling raw audio at scale. In Proceedings of the 32nd Confer- C. 2019. librosa/librosa: 0.6.3.
ence on Neural Information Processing Systems, 8000–8010. [2018] Miyato, T., and Koyama, M. 2018. cGANs with pro-
Montréal, Canada: Curran Associates, Inc. jection discriminator. In Proceedings of the 6th International
[2019] Donahue, C.; McAuley, J.; and Puckette, M. 2019. Conference on Learning Representations. Vancouver, BC,
Adversarial audio synthesis. In Proceedings of the 7th In- Canada: OpenReview.net.
ternational Conference on Learning Representations. New [2004] Moore, B. C.; Tan, C.-T.; Zacharov, N.; and Mattila,
Orleans, LA, USA: OpenReview.net. V.-V. 2004. Measuring and predicting the perceived quality
[2013] Eickhoff, C., and de Vries, A. P. 2013. Increasing of music and speech subjected to combined linear and non-
cheat robustness of crowdsourcing tasks. Information Re- linear distortion. Journal of the Audio Engineering Society
trieval 16(2):121–137. 52(12):1228–1244.
[2019] Engel, J.; Agrawal, K. K.; Chen, S.; Gulrajani, I.; Don- [2017] Schlegl, T.; Seeböck, P.; Waldstein, S. M.; Schmidt-
ahue, C.; and Roberts, A. 2019. GANSynth: Adversarial neu- Erfurth, U.; and Langs, G. 2017. Unsupervised anomaly de-
ral audio synthesis. In Proceedings of the 7th International tection with generative adversarial networks to guide marker
Conference on Learning Representations. New Orleans, LA, discovery. In Proceedings of the 25th International Confer-
USA: OpenReview.net. ence on Information Processing in Medical Imaging, 146–
157. Boone, NC, USA: Springer International Publishing.
[2017] Fourer, D., and Peeters, G. 2017. Objective char-
[2014] Tang, H.; Joshi, N.; and Kapoor, A. 2014. Blind image
acterization of audio signal quality: applications to music
quality assessment using semi-supervised rectifier networks.
collection description. In Proceedings of the 2017 IEEE
In Proceedings of the IEEE Conference on Computer Vision
International Conference on Acoustics, Speech and Signal
and Pattern Recognition, 2877–2884. Columbus, OH, USA:
Processing, 711–715. New Orleans, LA, USA: IEEE.
IEEE.
[2019] Frankel, J., and Schwartz, J. 2019. Reaper jsfx sdk. [2000] Thiede, T.; Treurniet, W. C.; Bitto, R.; Schmidmer, C.;
[2014] Harlander, N.; Huber, R.; and Ewert, S. D. 2014. Sporer, T.; Beerends, J. G.; and Colomes, C. 2000. Peaq - the
Sound quality assessment using auditory models. Journal of itu standard for objective measurement of perceived audio
the Audio Engineering Society 62(5):324–336. quality. Journal of the Audio Engineering Society 48(1):3–29.
[2015] Hines, A.; Gillen, E.; Kelly, D.; Skoglund, J.; Kokaram, [2016] Wilson, A., and Fazenda, B. M. 2016. Perception of
A.; and Harte, N. 2015. Visqolaudio: An objective audio audio quality in productions of popular music. Journal of the
quality metric for low bitrate codecs. The Journal of the Audio Engineering Society 64(1):23–34.
Acoustical Society of America 137(6):449–455. [2017] Wyse, L. 2017. Audio Spectrogram Representations
[2019] Huang, S.; Li, Q.; Anil, C.; Bao, X.; Oore, for Processing with Convolutional Neural Networks. In Pro-
S.; and Grosse, R. B. 2019. Timbretron: A ceedings of the First International Workshop on Deep Learn-
wavenet(cycleGAN(CQT(audio))) pipeline for musical tim- ing for Music, 37–41.
bre transfer. In Proceedings of the 7th International Confer- [2019] Zhang, H.; Goodfellow, I.; Metaxas, D.; and Odena,
ence on Learning Representations. New Orleans, LA, USA: A. 2019. Self-attention generative adversarial networks. In
OpenReview.net. Proceedings of the 36th International Conference on Machine
[2006] Huber, R., and Kollmeier, B. 2006. Pemo-q - a new Learning, 7354–7363. Long Beach, California, USA: PMLR.
method for objective audio quality assessment using a model
of auditory perception. IEEE Transactions on audio, speech,
and language processing 14(6):1902–1911.
[2013] Li, Z.; Wang, J.-C.; Cai, J.; Duan, Z.; Wang, H.-M.;
and Wang, Y. 2013. Non-reference audio quality assessment
for online live music recordings. In Proceedings of the 21stYou can also read