Peculiarities of Fe and Ni Diffusion in Polycrystalline Cu

Page created by Floyd Fischer
 
CONTINUE READING
Peculiarities of Fe and Ni Diffusion in Polycrystalline Cu
materials
Article
Peculiarities of Fe and Ni Diffusion in Polycrystalline Cu
Alexey Rodin * and Ainur Khairullin

                                          Department of Physical Chemistry, National University of Science and Technology “MISiS”, NUST “MISiS”, 4,
                                          Leninsky pr-t, Moscow 119049, Russia
                                          * Correspondence: rodin@misis.ru

                                          Abstract: The peculiarities of Ni and Fe diffusion in polycrystalline Cu and Cu-Fe alloys at a
                                          650–750 ◦ C temperature range were studied. It was shown that the bulk diffusion coefficients
                                          were in a good agreement with the available literature data obtained for different temperature con-
                                          centration ranges. The obtained     values of  the Ni GB diffusion triple product could be described
                                                                          −165 kJmol −1
                                                                        
                                          as sδDb = 8.8 × 10 − 13 × exp                  m3 s−1 . The obtained values were an order of magnitude
                                                                              RT
                                          less than the values obtained by the radiotracer method. This fact was explained by the negative
                                          segregation of Ni at the Cu GB. A stronger negative segregation of Fe in the copper GB reduced
                                          the penetration depth of iron along the GB because of an additional (negative) “driving” force; this
                                          explained why there was no advanced grain boundary diffusion. Another peculiarity of the Fe
                                          diffusion that was confirmed was the significant supersaturation of the Cu-based solid solution near
                                          the Fe/Cu interface.

                                          Keywords: diffusion; grain boundary; copper; segregation

                                          1. Introduction
                                                Diffusion in grain boundaries (GBs) has been of great interest for the last 70 years due
                                          to a significant (several orders of magnitude) difference between the GB and bulk diffusion
                                          coefficients. This effect is especially pronounced at moderate and low temperatures (below
                                          0.7 Tm , where Tm is the melting point); the mass transport in polycrystals associated with
                                          the flux of the diffusant in the GB becomes dominant over the direct flow through the grain
Citation: Rodin, A.; Khairullin, A.       volume. Over these years of research, various methods to study grain boundary diffusion
Peculiarities of Fe and Ni Diffusion in   and approaches to their accurate mathematical treatment have been developed, so that
Polycrystalline Cu. Materials 2023, 16,   we can now postulate that a foundation for predicting the behavior of various elements in
922. https://doi.org/10.3390/             polycrystalline systems has already been constructed.
ma16030922                                      The attempt to enlarge the approaches—developed for bulk diffusion to GB diffusion,
Academic Editor: Frank Czerwinski
                                          but taking into account the peculiarities of this object—looks natural. For example, the
                                          basic method for the experimental determination of diffusion parameters is the radiotracer
Received: 14 November 2022                method (see e.g., [1]), which can be described as a diffusion of the tracer in its dilute solution
Revised: 11 January 2023                  in a matrix. A matrix can be a one-component system or a multicomponent system and
Accepted: 12 January 2023                 the concentration dependence of the diffusion coefficient can be obtained by measuring
Published: 18 January 2023                parameters at different concentrations of the alloying elements. A more complex approach,
                                          both in creating a physical model and in the mathematical description, is based on the study
                                          of the mutual diffusion of elements in a wide concentration range because the diffusion
                                          of two or more components (generally speaking, not independent) is accompanied by a
Copyright: © 2023 by the authors.
                                          possible phase formation, pore formation, shift of interface and other effects that must be
Licensee MDPI, Basel, Switzerland.
This article is an open access article
                                          taken into account. The situation with grain boundaries is even more complicated because
distributed under the terms and
                                          they are not the same, even within one sample. Their properties are very sensitive to
conditions of the Creative Commons        the angle of grain misorientation, the presence of impurities, the possibility of boundary
Attribution (CC BY) license (https://     migration and other effects [2]. In this sense, a comparison of the grain boundary diffusion
creativecommons.org/licenses/by/          data obtained by different authors requires a deep analysis, especially if different methods
4.0/).                                    for the determination of parameters are used. It is necessary to underline that in the

Materials 2023, 16, 922. https://doi.org/10.3390/ma16030922                                               https://www.mdpi.com/journal/materials
Peculiarities of Fe and Ni Diffusion in Polycrystalline Cu
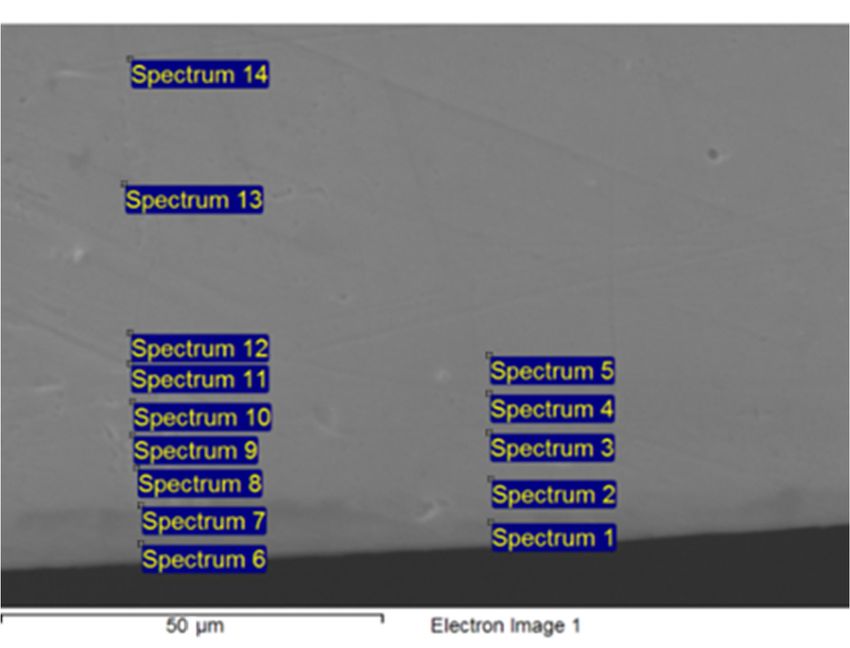
Materials 2023, 16, 922                                                                                             2 of 11

                          practically important temperature regime of moderate temperatures (close to 0.5 Tm ), the
                          grain boundary    diffusion can be described by a so-called triple product P = sδDb , where
                          s = ccb x=±δ/2 is the GB enrichment factor (ratio of the GB and bulk concentrations), δ is
                                   

                          the grain boundary width and Db is the GB diffusion coefficient. This is because the bulk
                          diffusion determines not only the direct flux from the surface into the grain, but also the
                          flux from the GB to the grain [1,2]. It is evident that the greater the GB segregation factor,
                          the greater the triple product and the deeper the penetration of the diffusant along the GB.
                               In this paper, we present a comparative analysis of the results of the study of the
                          bulk and GB diffusion obtained by different methods (the methods of radiotracer isotopes
                          and a microprobe analysis (EPMA)) for iron and nickel in copper. As additional data to
                          the discussion, the results of the computer modeling for these systems as well as for a
                          cobalt–copper system were used.
                               The choice of the system was based on scientific interest of a system with negative GB
                          segregation (segregation factor s < 1) [3,4], but Cu-Fe alloys are of a practical interest as a
                          soft magnetic material [5] as well as being conductive materials with enhanced mechanical
                          and wear-resistant properties [6]. Fe-based coatings allow the improvement of wear
                          resistance for several tools [7,8]. The stability of the microstructure and properties at
                          elevated temperatures are connected to the diffusion properties of polycrystalline alloys.
                               The bulk and GB diffusion of the chosen systems have been studied in a number
                          of works. One can observe a good agreement between the bulk diffusion data both for
                          Ni [9–14] and Fe [9,15–18] diffusion in Cu. Regarding the GB diffusion, the difference in
                          the results is significant.
                               Triple product values for Ni in Cu obtained by autoradiography [19–21] demonstrate
                          a difference of two orders of magnitude. The most reliable data, obtained by the radio-
                          tracer technique [22], provided intermediate values; however, the data obtained by an
                          electron probe microanalysis (EPMA) [23] obtained an order of magnitude with higher
                          values than [22]. This is surprising, because radiotracer methods typically provide the
                          characteristics for the fastest GB [24].                                          n          o
                               According to [25], the triple product of Fe diffusion is P = 9.1 × 10⁻¹² exp −121kJ/mol
                                                                                                                  RT     ,
                          but this could only be determined in a temperature range of 949–1247 K, which is more than
                          0.7 Tm . Our results [26–28] demonstrated the absence of a concentration excess near the GB
                          in comparison with the bulk at high (above 1073 K) and low (below 873 K) temperatures;
                          thus, the GB diffusion parameters could not be determined. On the other hand, the triple
                          product recalculated from the growth rate of cobalt–iron particles at the GBs of a copper
                          alloy at 823 and 873 K showed the absence of any anomalies [29], providing a reasonable
                          value for the GB triple product close to Cu self-diffusion.
                               In order to ascertain the possible reasons of these contradictions, a diffusion study with
                          an enlarged time–temperature range was conducted for an Fe-Cu system. Special attention
                          was paid to the correct treatment of the results; thus, the experiment was conducted both
                          for the cross-section and the foils at the same temperatures. In order to study the possible
                          effect of Fe on the diffusion characteristics of the grain boundaries in Cu, the effect of the
                          alloying of Cu by Fe was studied by using Fe and Ni as diffusants.

                          2. Materials and Methods
                                An energy dispersive X-ray microanalysis (EDX) was used to determine the concen-
                          tration of the diffusing elements near the grain boundary and far from it. It allowed us to
                          obtain the data by a direct comparison of the penetration depths of the elements. If there
                          was a significant difference in the penetration depths, there was the possibility of separately
                          determining the parameters of the GB and bulk diffusion. The accuracy of this method
                          does not exceed 0.1%; therefore, only data above 0.2–0.3% were taken into account for the
                          analysis.
Materials 2023, 15, x FOR PEER REVIEW                                                                                                          3 of 11

      Materials 2023, 16, 922
                                 method does not exceed 0.1%; therefore, only data above 0.2–0.3% were taken into ac- 3 of 11
                                 count for the analysis.
                                       For the research, copper of 99.995% purity, iron of 99.99% purity, chemically pure
                                 (better than 99%) nickel and iron sulfates (NiSO4·7H2O and FeSO4·7H2O) were used.
                                              For the research, copper of 99.995% purity, iron of 99.99% purity, chemically pure
                                       The Cu-Fe alloys were prepared by dissolving the master alloys (containing 1.25%
                                        (better than 99%) nickel and iron sulfates (NiSO4 ·7H2 O and FeSO4 ·7H2 O) were used.
                                 iron) in liquid copper at a temperature of 1200 °C in Ar with the small addition of a H2
                                              The Cu-Fe alloys were prepared by dissolving the master alloys (containing 1.25%
                                 atmosphere. The melts were kept for 4 h at this temperature                           and cooled down by re-
                                        iron) in liquid copper at a temperature of 1200 ◦ C in Ar with the small addition of a H2
                                 moving the quartz reactor from the furnace under the conditions of a weak Ar flux.
                                        atmosphere. The melts were kept for 4 h at this temperature and cooled down by removing
                                       The
                                        theingots
                                            quartz(diameter
                                                      reactor from of about    20 mm)under
                                                                       the furnace        were the
                                                                                                keptconditions
                                                                                                       at a temperature
                                                                                                                     of a weak of 1050    °C in an Ar
                                                                                                                                   Ar flux.
                                 atmosphereThe  foringots
                                                     20 h. (diameter
                                                              They wereofcut  about 20 mm) were kept at a temperature of 1050 ◦these
                                                                                   into  discs  of  approximately         3 mm     thickness;       C in an Ar
                                 were carefully
                                        atmosphere  cleaned,
                                                        for 20 h.thinned    by deformation
                                                                    They were      cut into discs(70%)     and polished.
                                                                                                    of approximately        3 mmAfter   that, recrys-
                                                                                                                                     thickness;    these were
                                 tallization  annealing
                                        carefully  cleaned, was   carriedby
                                                                thinned     out   in a hydrogen
                                                                               deformation      (70%)atmosphere
                                                                                                        and polished.  at 1000
                                                                                                                            After°Cthat,
                                                                                                                                     for 1recrystallization
                                                                                                                                            h.
                                       The  iron  content     in  the  samples      was   determined     by
                                        annealing was carried out in a hydrogen atmosphere at 1000 C for 1 h.  atomic    emission
                                                                                                                          ◦            spectroscopy
                                 with inductively
                                              The iron coupled
                                                          contentplasma.       Two types
                                                                    in the samples            of samples with
                                                                                        was determined                0.4 at%
                                                                                                              by atomic          and 0.3
                                                                                                                            emission        at% were with
                                                                                                                                         spectroscopy
                                 obtained.
                                        inductively coupled plasma. Two types of samples with 0.4 at% and 0.3 at% were obtained.
                                       An electrochemical
                                              An electrochemical  deposition     fromfrom
                                                                        deposition       sulfate  aqueous
                                                                                              sulfate  aqueous electrolytes
                                                                                                                     electrolyteswaswasusedused to to
                                                                                                                                                    pro-
                                                                                                                                                      produce
                                 duce the   sample     for   the  diffusion    study.    The  electrolyte     for  the   nickel
                                        the sample for the diffusion study. The electrolyte for the nickel deposition comprised   deposition      com-
                                 prisednickel
                                         nickelsulfate
                                                 sulfate(250(250g/L),
                                                                  g/L),boric
                                                                         boricacid
                                                                                acid(30(30  g/L)and
                                                                                          g/L)    andsodium
                                                                                                        sodium      chloride
                                                                                                                 chloride    (10(10  g/L)
                                                                                                                                  g/L)   asas
                                                                                                                                            wellwell
                                                                                                                                                   as as
                                                                                                                                                       distilled
                                 distilled
                                        water. The Fe deposition comprised iron sulfate (250 g/L), potassium sulfate(150
                                           water.   The   Fe   deposition    comprised      iron  sulfate   (250  g/L),   potassium      sulfate     (150 g/L)
                                 g/L) and
                                        andoxalic
                                              oxalicacid
                                                      acid(4(4g/L).
                                                                g/L).TheThetime
                                                                              time was
                                                                                     was selected
                                                                                           selected inin
                                                                                                       order
                                                                                                         order  toto
                                                                                                                   obtain
                                                                                                                      obtain a a2020μm-thick
                                                                                                                                      µm-thicklayer.layer. The
                                 The samples
                                        sampleswerewereannealed
                                                           annealedininquartz
                                                                          quartzampoules
                                                                                     ampoulesand  andevacuated
                                                                                                        evacuatedtotoa a1010 mm
                                                                                                                              −3 − 3 mm HgHg vacuum.
                                                                                                                                                 vacuum.
                                       Another    type of
                                              Another     typesample    was was
                                                                 of sample     an 18anμm-thick
                                                                                         18 µm-thick CuCu foilfoil
                                                                                                                 with
                                                                                                                    withFeFe onononeoneside,
                                                                                                                                         side,as aspro-
                                                                                                                                                     produced
                                 ducedinin[23,24].
                                             [23,24].Typical
                                                       Typical     views
                                                                views   of of
                                                                            thethe    diffusion
                                                                                 diffusion        couple
                                                                                              couple         cross-section
                                                                                                       cross-section            (points
                                                                                                                           (points         1–5 corre- with
                                                                                                                                     1–5 correspond
                                 spondthe with
                                            bulkthe    bulk diffusion
                                                   diffusion    measurementsmeasurements
                                                                                     and pointsand 6–14points
                                                                                                         are the6–14       are the measurements)
                                                                                                                    GB diffusion      GB diffusion and
                                 measurements)       and   the  reverse   side   of  the  annealed    foil
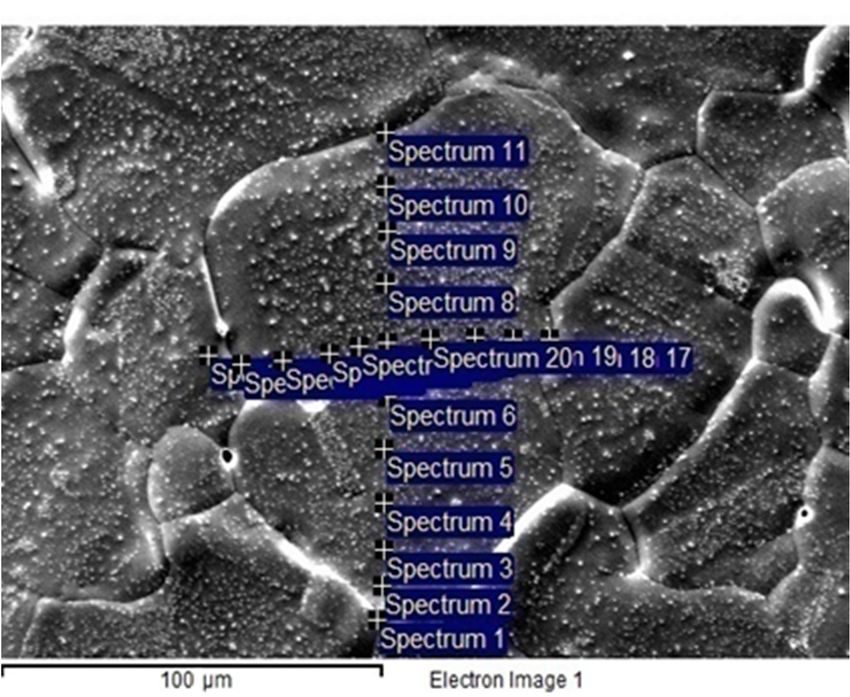
                                        the reverse side of the annealed foil are presented in Figure 1.   are   presented     in  Figure    1.

                                                                                          (a)
                                        Figure 1. Cont.
Materials 2023, 15, x FOR PEER REVIEW                                                                                                       4 of 11
         Materials   2023,16,
           Materials2023,  15,922
                               x FOR PEER REVIEW                                                                                                        4 of1111
                                                                                                                                                      4 of

                                                                                                (b)   (b)
                                   Figure 1. SEM 1.
                                           Figure
                                          Figure  images:
                                                   1. SEM    (a) surface
                                                       SEM images:
                                                             images:  (a) of the cross-section
                                                                          surface               of Cu-Ni
                                                                                   of the cross-section
                                                                                          cross-section ofdiffusion
                                                                                                        of Cu-Ni    couple;couple;
                                                                                                           Cu-Ni diffusion
                                                                                                                  diffusion (b) the (b)
                                                                                                                            couple;  foil after
                                                                                                                                      (b)the
                                                                                                                                          thefoil
                                                                                                                                              foilafter
                                                                                                                                                   after
                                   annealing (opposite
                                           annealing     to Fe layer
                                                       (opposite  to side).
                                                                     Fe layer  side).
                                          annealing (opposite to Fe layer side).

                                           3.3.Results
                                   3. Results  Results
                                           3.1.
                                            3.1.Ni
                                                 NiDiffusion
                                   3.1. Ni Diffusion
                                                   Diffusion
                                               The                                                                                                ◦ C;
                                                Thediffusion
                                        The diffusion diffusionofofnickel
                                                        of nickel  into   into
                                                                        pure
                                                                    nickel into pure
                                                                                 purecopper
                                                                               copper          was
                                                                                                 wasstudied
                                                                                        was studied
                                                                                        copper                  atat
                                                                                                                   temperatures
                                                                                                          at temperatures
                                                                                                        studied                   ofof
                                                                                                                             of 650
                                                                                                                     temperatures    650
                                                                                                                                    and  and
                                                                                                                                       650750 750750
                                                                                                                                            and
                                          with  the  alloys  containing                                                                           ◦ C.
                                   °C; with°C;
                                            thewith   thecontaining
                                                 alloys   alloys      0.3 0.3
                                                                          andand
                                                                 containing    0.3
                                                                                0.4%0.4%
                                                                                   and     iron,
                                                                                         0.4%
                                                                                      iron,       the
                                                                                               iron,
                                                                                             the       temperatures
                                                                                                      the   temperatures
                                                                                                  temperatures          were
                                                                                                                     were     650,
                                                                                                                           were
                                                                                                                          650,      700
                                                                                                                                  650,
                                                                                                                                700 and  and
                                                                                                                                       700    750750
                                                                                                                                            and
                                                                                                                                          750
                                          Typical
                                   °C. Typical     concentration
                                           °C. Typical
                                               concentration        profiles
                                                         concentration
                                                                profiles      at the
                                                                         profiles
                                                                          at the   at GB
                                                                                  GB  andand
                                                                                      the  GB   in the
                                                                                               and
                                                                                            in the   in bulk
                                                                                                    bulk theareare
                                                                                                              bulk  presented  in Figure
                                                                                                                    are presented
                                                                                                                presented              2. 2. 2.
                                                                                                                                   in Figure
                                                                                                                            in Figure

         120

                                                                                 120
         100                                                                                                           this work
                                             this work
                                                                                 100
               80                            calculation                                                               interface Ni-
                                                                                       80                              (0.4Fe+Cu)
     С, аt.%

               60                                                                                                      Wipple
                                                                             С, аt.%

                                             interface Ni-
                                             ('0.4Fe+Cu)                               60                              calculation
               40
                                                                                       40
               20
                                                                                       20
               0
                    0   10         20          30            40
                                                                                        0
                                                                                            0               20             40          60
                                 х, µm                                                                           х, µm
                                 (a)                                                                             (b)
                                   Figure 2. Concentration profiles for bulk (a) and GB (b) diffusion of Ni in Сu + 0.4 Fe at% at T = 700
                                             Figure
                                   °С for 72Figure
                                              h.     2.2.Concentration
                                                         Concentrationprofiles
                                                                       profilesfor
                                                                                forbulk
                                                                                    bulk(a)
                                                                                         (a)and
                                                                                             andGB
                                                                                                 GB(b)
                                                                                                     (b)diffusion
                                                                                                         diffusionofof
                                                                                                                     NiNi
                                                                                                                        inin
                                                                                                                           CuСu + 0.4
                                                                                                                              + 0.4 FeFe
                                                                                                                                      at%at%  at=T700
                                                                                                                                           at T   = 700
                                                                                                                                                      ◦C
                                             °С  for
                                            for 72 h.72  h.
Materials 2023, 16, 922                                                                                                                         5 of 11

                                            The data on bulk diffusion were described by the erf-like equation (solution of the
                                       diffusion equation with the initial condition corresponding with a layer of finite thickness a
                                       and the diffusion coefficient D being constant):

                                                                                                    x−a
                                                                                                       
                                                                         C0         x+a
                                                             C(x, t) =       (erf    √      + erf    √      )                     (1)
                                                                          2         2 Dt            2 Dt

                                           For the data on the grain boundary diffusion, a modified Whipple solution [30] was
                                       used:

                                                                 Cb = C ( x, t) + Cb1 ( x, y, t)
                                                    ∆
                                                                                               0.5  δ                √ 
                                       C0 ∗( x − a) R    1           ( x − a )2           1 Db − D       y−      2(σ −1) D Dt                      (2)
                    Cb1 ( x, y, t) =     √
                                                        σ3/2
                                                             ∗ exp     4σDt       ∗ erfc  2 D −σD      ∗ √ 2 +        sδDb      dσ
                                        4 πDt                                           b               Dt
                                                  1

                                       This was essential because the Whipple solution is valid for the case of the boundary
                                       condition corresponding with a constant concentration on the surface. In our case, this
                                       condition was not fulfilled.
                                             The obtained values of the bulk and grain boundary diffusion (averaged from at least
                                       5 different profiles) parameters are presented in Table 1.

                                       Table 1. Ni bulk diffusion coefficient (D) and GB diffusion triple product (P = sδDb ).

                                                                                                     GB Diffusion Triple Product
                           Bulk Diffusion Coefficient D × 1016 , m2 /s
          ◦C                                                                                               P × 1021 , m3 /s
     T,
                          Pure Cu            Cu + 0.3% Fe           Cu + 0.4% Fe            Pure Cu              Cu + 0.3% Fe        Cu + 0.4% Fe
       750                 1.5                     2.5                  2.4                    2                       5                 2.5
       700                   -                    0.41                  0.4                     -                    0.84                1.2
       650                 0.13                   0.18                  0.12                  0.25                   0.23                0.36

                                            The mean square displacement could be estimated as 10–20% for each D obtained
                                       from the given profile and around 30% for the averaged value at a given temperature. Thus,
                                       we observed only a small difference in the values of the GB diffusion for the pure Cu and
                                       the Cu-Fe alloys. The temperature dependences for the Ni bulk diffusion coefficient and the
                                       P-value are presented in Figure 3 in comparison with the data from [9–14,19–22]. It could
                                       be seen that the values of DNi slightly differed from the other data; PNi was significantly
                                       smaller than the data obtained in [22,23]. Notably, the Wipple approach [30] was used
                                       directly whereas in [23], the data were recalculated from the values obtained with the use
                                       of the Fisher solution for a quasi-stationary approximation [31].
                                            The temperature dependence of the GB diffusion triple product (assuming the absence
                                       of a difference between the data for pure Cu and Cu-Fe alloys) could be expressed as
                                       follows:
                                                                                         −165 kJmol −1
                                                                                                      
                                                                             −13
                                                            sδDb = 8.8 × 10      × exp                   m 3 s −1               (3)
                                                                                              RT

                                       3.2. Results of Bulk and Grain Boundary Diffusion of Iron into Copper and Copper-Based Alloys
                                            The diffusion of iron into pure copper was studied at three temperatures: 650 (138 h),
                                       700 (24, 96, 192 and 312 h) and 750 ◦ C (30 h). The annealing time was varied at one
                                       temperature to estimate the concentration change near the iron/copper interface. For the
                                       copper–iron alloys, the annealing times were 138 and 190 h (650 ◦ C), 49 and 72 h (700 ◦ C)
                                       and 30 h (750 ◦ C). The typical concentration profiles obtained from the EDX analysis are
                                       shown in Figure 4.
Materials
Materials    2023,
          2023, 16,15,
                    922x FOR PEER REVIEW                                                                                                 66of
                                                                                                                                           of 11
                                                                                                                                              11

                                   Figure 3. Arrhenius plots for bulk [9–14] (a) and GB [19–22] (b) diffusion of Ni in Cu, according to
                                   different authors. Points correspond with the data obtained in the present work. Averaged value
                                   for Cu-Fe alloys are presented as triangles.

                                   3.2. Results of Bulk and Grain Boundary Diffusion of Iron into Copper and Copper-Based Alloys
                                        The diffusion of iron into pure copper was studied at three temperatures: 650 (138
                                  h), 700 (24, 96, 192 and 312 h) and 750 °C (30 h). The annealing time was varied at one
                                  temperature to estimate the concentration change near the iron/copper interface. For the
                                    Figure3. 3. Arrheniusplots
                                             Arrhenius      plotsfor
                                                                   forbulk
                                                                        bulk[9–14]
                                                                              [9–14](a)
                                                                                     (a)and
                                                                                         andGB
                                                                                             GB [19–22](b)
                                                                                                         (b) diffusion of
                                                                                                                       of Ni
                                                                                                                          Ni in
                                                                                                                              in Cu, according
                                                                                                                                     according to
                                  Figure
                                  copper–iron       alloys, the annealing       times were   138[19–22]
                                                                                                  and 190 hdiffusion
                                                                                                              (650 °C), 49  andCu,72 h (700 °C)to
                                    different
                                  different     authors.  Points  correspond      with the data obtained  in the present  work.  Averaged   value
                                  and
                                    for 30 hauthors.
                                        Cu-Fe  (750     Points
                                                     °C).
                                                 alloys areThe
                                                               correspond     with the dataprofiles
                                                                typicalasconcentration
                                                            presented       triangles.
                                                                                             obtainedobtained
                                                                                                      in the present
                                                                                                                 fromwork.    Averaged
                                                                                                                        the EDX         value
                                                                                                                                   analysis   for
                                                                                                                                            are
                                  Cu-Fe  alloys   are
                                  shown in Figure 4.   presented  as  triangles.

                                    3.2. Results of Bulk and Grain Boundary Diffusion of Iron into Copper and Copper-Based Alloys
                                         The diffusion of iron into pure copper was studied at three temperatures: 650 (138
                                    h), 700 (24, 96, 192 and 312 h) and 750 °C (30 h). The annealing time was varied at one
                                    temperature to estimate the concentration change near the iron/copper interface. For the
                                    copper–iron alloys, the annealing times were 138 and 190 h (650 °C), 49 and 72 h (700 °C)
                                    and 30 h (750 °C). The typical concentration profiles obtained from the EDX analysis are
                                    shown in Figure 4.

                                   Figure 4.
                                  Figure  4. Typical
                                             Typical concentration
                                                     concentration profiles
                                                                    profiles corresponding
                                                                              correspondingwith
                                                                                             withmeasurements
                                                                                                      measurementsfar
                                                                                                                   faraway
                                                                                                                       away(a)
                                                                                                                            (a)and
                                                                                                                                andnear
                                                                                                                                    neartoto
                                   the GB
                                  the  GB (b)
                                          (b) for
                                              for Fe
                                                  Fe diffusion
                                                     diffusion of
                                                               of Сu
                                                                  Cu ++ 0.3
                                                                        0.3 Fe
                                                                            Fe at.%
                                                                               at.%(T
                                                                                    (T==700
                                                                                         700°С;
                                                                                             ◦ C;t t==4949h).
                                                                                                           h).

                                        The concentration was
                                        The                   was expressed
                                                                   expressed as as the
                                                                                    thedifference
                                                                                        differencebetween
                                                                                                     betweenthethemeasured
                                                                                                                  measuredvalue
                                                                                                                             valueandand
                                  the concentration
                                  the concentration in the matrix
                                                              matrix (0,
                                                                      (0, 0.3
                                                                          0.3 and
                                                                               and0.40.4at%
                                                                                         at%for
                                                                                              forthe
                                                                                                  thedifferent
                                                                                                      differentsamples).
                                                                                                                samples).Vertical
                                                                                                                          Verticallines
                                                                                                                                    lines
                                  showed the distance corresponding with the foil thickness (18 µm), taking into account the
                                  typical depth of the analysis (3 µm).
                                        The maximum concentration (concentration at the Fe/Cu interface) was obtained by
                                    Figure 4. Typical concentration profiles corresponding with measurements far away (a) and near to
                                  approximating the diffusion profile to a zero depth, as posited in [26,27]. To determine the
                                    the GB (b) for Fe diffusion of Сu + 0.3 Fe at.% (T = 700 °С; t = 49 h).
                                  DFe and Cs, the erfc-like equation was used:
                                         The concentration was expressed as the difference  
                                                                                               x − a between the measured value and
                                                                                                      
                                    the concentration in the matrix  C ((0, t) =
                                                                         x, 0.3   CS0.4
                                                                                and    erfc     √ the different samples). Vertical lines
                                                                                          at% for                                      (4)
                                                                                              2 Dt
Materials 2023, 16, 922                                                                                                                      7 of 11

                                      It is important to note that CS was almost the same for all times of annealing at a given
                                 temperature (see Table 2); thus, Equation 4 could be used. On the other hand, it decreased
                                 with an increase in the temperature (Table 3). This indicated that if one could usually use
                                 Cs as a solubility at this temperature (C0 ), here, it was only a value corresponding with a
                                 stationary regime.

                                 Table 2. Results of determination of Cs obtained by the extrapolation of Equation (4) on x = a at
                                 T = 700 ◦ C.

                                       Time               24 h      48 h            72 h               96 h         192 h             312 h
                                      Cs, at.%            2.9        3.1            3.2                3.1              2.7            3.4

                                 Table 3. Bulk diffusion coefficient for Fe-Cu, Fe-(Cu + Fe) and Fe-(Cu + S).

                                     Bulk Diffusion Coefficient D × 1016 , m2 /s                              Max. Conc.,       Solubility,
    T, ◦ C
                    Pure Cu     Cu + 0.3% Fe      Cu + 0.4% Fe     Cu + 0.002% S [27]           [9]              Cs              C0 [32]

     750                  12          11                  18                 10.2               12.7              3.1                 0.21
     700                  4.8         5.5                 5.4                 -                  3.4              3.0                  0.3
     650                  1.7         1.2                 1.7                 1                 0.82              2.2                 0.46

                                        Note the two features of the obtained profiles:
                                 •      The measured values of the concentration profiles were significantly above the solubil-
                                        ity limit at the temperatures of annealing (the solubility at different temperatures is
                                        given in Table 3).
                                 •      The profiles near and far from the grain boundary were practically the same and a
                                        matrix concentration was reached at the same depth.
                                      The level of iron supersaturation in the copper near the surface was determined as the
                                 ratio CS /C0 . At a temperature of 650 ◦ C, the supersaturation was 15; at 700 ◦ C, it was 9
                                 and at 750 ◦ C, it was 5. The value of supersaturation decreased not only due to an increase
                                 in solubility, but also due to a decrease in Cs.
                                      As it was impossible to determine the parameters of the grain boundary diffusion in
                                 the absence of a difference in the profiles of the bulk and GB diffusion, only the average
                                 values of the bulk diffusion coefficients were determined, which are given in Table 3 and
                                 Figure 5. Additionally, data obtained earlier [27] are presented. We noted that the results
                                 were in a good agreement with the previous data.
                                      In order to compare the results with the measured values of the concentration on
                                 the opposite side of the copper foils annealed for different times, the concentrations of Fe
                                 corresponding with 18 µm were calculated (Table 4). The Cs values were also taken from
                                 our measurements and, as one can see, the calculated results were in a good agreement
                                 with the experimental ones for a short time of annealing.

                                 Table 4. Calculated and measured concentration (at.%) far from the GB and the measured value near
                                 to the GB opposite to the diffusant layer side of the foil.

                                                                 Grain Boundary,                                         Calculation Bulk,
                                            Fe-Cu                                          Average Bulk, at.%
                                                                      at.%                                                     at.%
                                          650 ◦ C, 65 h                0.4                        0.3                           0.3
                                         650 ◦ C, 120 h                0.4                        0.3                           0.4
                                          700 ◦ C, 24 h                0.3                        0.3                           0.3
                                          700 ◦ C, 45 h                0.4                        0.4                           0.5
                                          750 ◦ C, 15 h                0.4                        0.4                           0.3
                                          750 ◦ C, 27 h                0.4                        0.3                           0.4
                                          750 ◦ C, 70 h                0.5                        0.4                           1.0
Materials
Materials 2023,
          2023, 15,
                16, x922
                      FOR PEER REVIEW                                                                                                     8 8ofof 11
                                                                                                                                                  11

                                 Figure    Arrheniusplot
                                 Figure 5. Arrhenius plotfor
                                                          forbulk
                                                               bulk diffusion
                                                                  diffusion     of in
                                                                             of Fe  FeCu
                                                                                       in according
                                                                                          Cu according    to different
                                                                                                    to different       authors
                                                                                                                 authors        [9,15–18].
                                                                                                                         [9,15–18]. Points
                                 Points correspond with the  data obtained  in the  present
                                 correspond with the data obtained in the present work.      work.

                                 4. Discussion
                                      In order to compare the results with the measured values of the concentration on the
                                 opposite    side oftothe
                                       According        thecopper   foilsresults,
                                                            presented        annealed     for different
                                                                                    the used               times, the
                                                                                                method obtained          concentrations
                                                                                                                      a reasonable          of Fe
                                                                                                                                       agreement
                                 for the bulk diffusion
                                 corresponding      with 18data
                                                             μmforwereboth    systems.(Table
                                                                          calculated       For the4).case
                                                                                                       TheofCs
                                                                                                             Nivalues
                                                                                                                 diffusion,
                                                                                                                        werethe   concentration
                                                                                                                               also  taken from
                                 profiles
                                 our       were quite symmetric,
                                      measurements       and, as onewith canthesee,interface   corresponding
                                                                                     the calculated               with its
                                                                                                         results were   in initial
                                                                                                                            a good position.  The
                                                                                                                                      agreement
                                 slightthe
                                 with   non-symmetry
                                            experimentalcould
                                                            ones beforexplained
                                                                        a short time  by of
                                                                                          theannealing.
                                                                                               concentration dependence of the diffusion
                                 coefficient. One could expect a notable difference in the diffusion coefficients at different
                                 concentration
                                 Table             ranges
                                        4. Calculated   andbecause
                                                             measured ofconcentration
                                                                           the significant     difference
                                                                                            (at.%) far frominthetheGB
                                                                                                                    melting
                                                                                                                       and thetemperatures
                                                                                                                                measured value  of
                                 near to the
                                 copper   and GBnickel
                                                 opposite     ◦ C diffusant
                                                           to the
                                                        (1084     and 1455layer ◦ C, correspondingly).
                                                                                      side of the foil.      However, as shown in [33], the
                                 concentration dependence of the diffusion coefficient was significant at a high temperature
                                                                                                                          Calculation Bulk,
                                 only. For
                                        Fe-Cuthe temperature     range 900–1000
                                                         Grain Boundary,         at.% ◦ C,Average
                                                                                             the difference     in the mutual diffusivity for
                                                                                                        Bulk, at.%
                                                                                                                                  at.%
                                 different Ni concentrations was almost 100 times; at 850 ◦ C, it was 10 times and at 730 ◦ C,
                                     650 °С,
                                 it was   only653htimes and could    0.4 be observed at a narrow       0.3 concentration range     0.3 near 80%
                                    650  °С,  120  h                 0.4                               0.3
                                 Ni. For other concentration ranges, the diffusion coefficient was of the same value. The          0.4
                                     700 °C, 24 hprofiles obtained
                                 concentration                       0.3 in the present work confirmed 0.3         this fact. The0.3Fe diffusion
                                     700 °C, was
                                 coefficient   45 h also close to the0.4literature data. In both0.4     cases, the bulk diffusion  0.5coefficients
                                 did750
                                      not°C,   15 h on the preliminary
                                           depend                    0.4      alloying of the copper   0.4 with iron.              0.3
                                       Regarding
                                     750  °C, 27 h the Ni GB diffusion,
                                                                     0.4        a significant difference
                                                                                                       0.3 could be seen, with     0.4the experi-
                                 mental   data70measured
                                     750 °C,      h         in a similar
                                                                     0.5 way [23]. First, we noted     0.4 that it was necessary   1.0 to modify
                                 the Whipple equation for the calculation because the conditions did not fully correspond
                                 with
                                 4.    the diffusion from a source, with a constant concentration for both the bulk and GB
                                    Discussion
                                 diffusion. A significant difference from the radiotracer results [22] was reasonable because
                                      According to the presented results, the used method obtained a reasonable agree-
                                 the treatment of the tails of the concentration profiles provided the diffusion coefficient for
                                 ment for the bulk diffusion data for both systems. For the case of Ni diffusion, the con-
                                 the fastest GB but not the average [24]. Taking into account that the scattering of the GB
                                 centration profiles were quite symmetric, with the interface corresponding with its initial
                                 diffusion parameters can be 1–2 orders of magnitude [34], the large scatter of our results and
                                 position. The slight non-symmetry could be explained by the concentration dependence
                                 the difference with the data, as mentioned above, appeared to be natural. We also observed
                                 of the diffusion coefficient. One could expect a notable difference in the diffusion coeffi-
                                 a significant difference in the GB diffusion effective activation energy. The calculated value
                                 cients at different concentration ranges because of the significant                  difference in the melt-
                                 (160 kJ/mol) was significantly higher than the typical value of 12 E (with half the activation
                                 ing temperatures of copper and nickel (1084 °C and 1455 °C, correspondingly). However,
                                 energy of the bulk diffusion being around 100 kJ/mol) and the values obtained in other
                                 as shown in [33], the concentration dependence of the diffusion coefficient was signifi-
                                 works (e.g., 91 and 74 kJ/mol in [13] for Cu samples of different purity). The effective
                                 cant at a high
                                 activation       temperature
                                              energy              only. For
                                                       of GB diffusion          the temperature
                                                                          consists    of two termsrange       900–1000
                                                                                                       connected          °C, activation
                                                                                                                    with the  the difference    in
                                                                                                                                           energy
                                 the mutual     diffusivity  for different     Ni  concentrations       was  almost   100   times;
                                 of diffusion and the enthalpy of segregation. This is the reason why, typically, the activation    at  850 °C,  it
                                 was  10 times
                                 energy           and atGB
                                          of chemical     730diffusion
                                                               °C, it was     onlythan
                                                                           is less   3 times    and could be (the
                                                                                           for self-diffusion     observed
                                                                                                                      enthalpyat aof
                                                                                                                                   narrow    con-
                                                                                                                                      adsorption
                                 centration range near 80% Ni. For other concentration ranges, the diffusion coefficient
Materials 2023, 16, 922                                                                                              9 of 11

                          is negative). However, the results of a number of studies on equilibrium adsorption in
                          copper–nickel systems allowed us to conclude that copper positively segregated in the
                          entire concentration range; thus, the segregation of Ni was negative [3]. It opposes the
                          calculation from the diffusion results, which provided a positive segregation [22]. The
                          difference in the results may have been due to the fact that the radiotracer method requires
                          relatively short times. The determined enrichment coefficient of the GB did not correspond
                          with an equilibrium state or even a quasi-stationary regime. The diffusion process can be
                          described as the movement of the diffusing element along the GB and atoms partly enter
                          the volume from the grain boundary. Thus, on the GB, the concentration is constantly
                          greater than in the adjacent bulk. Studies with non-radioactive isotopes require significantly
                          longer times and the established ratio is closer (although it may still be different) to that of
                          the equilibrium.
                                The absence of the effect of pre-alloying was obtained both in this work and in [22]. It is
                          clear that diffusion, especially isotopic diffusion, is sensitive to changes in the GB structure;
                          thus, it is natural to conclude that the structure of the GB and its kinetic characteristics
                          do not change under the influence of such alloying. In [25], it was concluded that iron
                          negatively segregated and exited from the grain boundaries (or the grain boundary moved
                          from the line of Fe atoms). The same conclusion can be reached by analyzing the results
                          of the computer modeling performed in [35]. Despite the different models taken for the
                          description of the interaction between atoms, the general effect is the same. The close effect
                          for the diffusion of Co in Cu provides the same conclusion that a negative segregation
                          significantly slows down GB diffusion; thus, it cannot be ascertained if the concentration in
                          the bulk is relatively high or not.
                                There are no direct measurements of iron (as well as cobalt) segregation on the surface
                          and at grain boundaries. However, the isotherms of the surface and grain boundary energy
                          of cobalt and iron in copper obtained in [4,36] directly indicated the growth of surface
                          energy at the initial section of the curve, which, according to the Gibbs adsorption equation,
                          indicates a negative adsorption. The enrichment coefficient estimated from this data was
                          approximately equal to 0.1–0.3. As was shown in a modified model of GB diffusion, taking
                          into account the surface energy gradient as an additional driving force [37], the additional
                          term was only important in the case of negative segregation and only in the case of a
                          relatively high concentration level. As was shown, the concentration of iron reached
                          significantly higher values than the solubility limit. The reason for the formation of a
                          supersaturated solid solution was the absence (or almost an absence) of Cu diffusion in
                          iron. In contact with a copper-based solid solution, we obtained almost pure iron instead
                          of an iron-based solid solution. A superimposed solution can be stable for a long time
                          due to the same reasons; for its decay, the formation of a solid solution of copper in iron is
                          necessary.
                                Summarizing the results of the present work and our earlier studies [26–28], we
                          concluded that there was an absence of advanced grain boundary diffusion of iron in
                          copper in undiluted copper-based solutions at a wide temperature range (above 550 ◦ C).
                          This could be explained by the negative adsorption of Fe in Cu, which decreased the p-value
                          and provoked an additional braking force.

                          5. Conclusions
                               The grain boundary diffusion of two elements with negative segregation (Ni and Fe)
                          in Cu was studied. The results of the determination of the bulk diffusion coefficients for
                          Ni and Fe demonstrated the sufficient accuracy of the methods used for the GB diffusion
                          studies. The weak concentration dependence of the bulk diffusion coefficient allowed us
                          to use, in this case, the Wipple solution for the GB diffusion problem, with modifications
                          to the initial and boundary conditions. In contradiction to the literary data, it was shown
                          that Ni GB diffusion at a high concentration was significantly slower than in a dilute
                          solution and could be characterized by a high value of effective activation energy of 160
                          kJ/mol, which could be explained by the negative adsorption of nickel on the Cu GB.
Materials 2023, 16, 922                                                                                                             10 of 11

                                   There was also no concentration dependence for the iron diffusion, although the studies
                                   that were carried out corresponded with supersaturated solid solutions with a maximum
                                   concentration 10–15 times higher than the solubility at a given temperature. Regarding
                                   the grain boundary diffusion of iron, a significant negative adsorption reduced the depth
                                   of the penetration of iron along the GB and explained why there was no advanced grain
                                   boundary diffusion.

                                   Author Contributions: Conceptualization, A.R.; Formal analysis, A.K.; Investigation, A.K.; Data
                                   curation, A.K.; Writing—review & editing, A.R.; Supervision, A.R. All authors have read and agreed
                                   to the published version of the manuscript.
                                   Funding: The work was made with the financial support of the NUST “MISiS” program “Priority-
                                   2030” Agreement # 075-15-2021-1306, dated 30 September 2021.
                                   Institutional Review Board Statement: Not applicable.
                                   Informed Consent Statement: Not applicable.
                                   Conflicts of Interest: The authors declare no conflict of interest.

References
1.    Merher, H. Handbook Diffusion in Solid Metals and Alloys; Springer Nature Switzerland AG: Cham, Switzerland, 1990; Volume 26.
2.    Kaur, I.; Gust, W. Handbook Grain and Interphase Boundary Diffusion Data; Ziegler Press: Stuttgart, Germany, 1989; Volume 1.
3.    Yan, X.; Wang, J.; Swart, H.; Terblans, J. AES study of Cu and S surface segregation in a ternary Ni-Cu(S) alloy in combination
      with a linear heating method. J. Alloys Compd. 2018, 768, 153–157. [CrossRef]
4.    Zhevnenko, S.; Rodin, A.; Smirnov, A. Surface phase transition in Cu–Fe solid solutions. Mater. Lett. 2016, 178, 1–4. [CrossRef]
5.    Liu, S.; Jie, J.; Guo, Z.; Yu, S.; Li, T. A comprehensive investigation on microstructure and magnetic properties of immiscible Cu-Fe
      alloys with variation of Fe content. Mater. Chem. Phys. 2019, 238, 121909. [CrossRef]
6.    Jeong, Y.B.; Jo, H.R.; Park, H.J.; Kato, H.; Kim, K.B. Mechanical properties and microstructural change in (Cu–Fe) immiscible
      metal matrix composite: Effect of Mg on secondary phase separation. J. Mater. Res. Technol. 2020, 9, 15989–15995. [CrossRef]
7.    Badiger, P.V.; Desai, V.; Ramesh, M.R.; Prajwala, B.K.; Raveendra, K. Effect of cutting parameters on tool wear, cutting force and
      surface roughness in machining of MDN431 alloy using Al and Fe coated tools. Mater. Res. Express 2018, 6, 016401. [CrossRef]
8.    Badiger, P.V.; Desai, V.; Ramesh, M.R.; Prajwala, B.K.; Raveendra, K. Tribological behaviour of monolayer and multilayer Ti-based
      thin solid films deposited on alloy steel. Mater. Res. Express 2019, 6, 026419. [CrossRef]
9.    Mackliet, C.A. Diffusion of Fe. Co, and Ni in single crystal of pure Cu. Phys. Rev. 1958, 109, 1964–1970. [CrossRef]
10.   Ikushima, A. Diffusion of Manganese in Single Crystals of Copper. J. Phys. Soc. Jpn. 1959, 14, 111–112. [CrossRef]
11.   Monma, K.; Suto, H.; Oikawa, H. Relation between high-temperature creep and diffusion in alloys (On the relation between
      high-temperature creep and diffusion in nickel-base solid solutions. VII). J. Jpn. Inst. Met. 1964, 28, 308–312. [CrossRef]
12.   Fogelson, R.L.; Ugay, Y.A.; Pokoev, A.V.; Akimova, I.A. X-ray diffraction method for bulk diffusion measurements in polycrys-
      talline materials. Fiz. Tverd. Tela 1971, 13.
13.   Anusavice, K.J.; DeHoff, R.T. Diffusion of the tracers Cu67 , Ni66 , and Zn65 in copper-rich solid solutions in the system Cu-Ni-Zn.
      Metall. Trans. 1972, 3, 1279–1298. [CrossRef]
14.   Macht, M.P.; Naudorf, V.; Dohl, R. DIMETA-82, Diffusion in Metals and Alloys; Kedves, F.J., Beke, D.L., Eds.; Trans Tech Publications:
      Zurich, Switzerland, 1983; p. 516.
15.   Mullen, J.G. Isotope effect in intermetallic diffusion. Phys. Rev. 1961, 121, 1649. [CrossRef]
16.   Barreu, G.; Brunel, G.; Cizeron, G. Determination of the heterodiffusion coefficients at infinite dilution of iron and chromium in
      pure copper. C. R. Acad. Sci. 1971, 272, 1–5.
17.   Bergner, D.; Cyrener, E. Diffusion of foreign elements in aluminum solid solutions. Pt. 3. Investigations into the diffusion of
      silicon in aluminum using the microprobe. Neue Hutte 1973, 18, 356–361.
18.   Sen, S.K.; Dutt, M.B.; Barua, A.K. The diffusion of iron in copper and of nickel in silver. Phys. Status Solidi 1978, 45, 657–663.
      [CrossRef]
19.   Krishtal, M.; Shcherbakov, L.; Mokrov, A.; Markova, N. Parameters of Bulk and Boundary Diffusion in the Copper-Nickel System.
      Fiz. Met. Metalloved 1970, 29, 305.
20.   Yukawa, S.; Sinnot, M.J. Grain Boundary Diffusion of Nickel into Copper. Trans. AIME 1955, 203, 996.
21.   Renouf, T.J. The measurement of grain boundary diffusion by the method of autoradiography. Philos. Mag. 1970, 22, 359–375.
      [CrossRef]
22.   Divinski, S.; Ribbe, J.; Schmitz, G.; Herzig, C. Grain boundary diffusion and segregation of Ni in Cu. Acta Mater. 2007, 55,
      3337–3346. [CrossRef]
23.   Aljeshin, A.N.; Prokofjev, S.I. Diffusion parameters and structure of grain boundaries, close to special Σ5 orientation. Poverkhnost
      Fiz. Khimiya Mech. 1986, 9, 131.
Materials 2023, 16, 922                                                                                                         11 of 11

24.   Divinski, S.; Herzig, C. Grain Boundary Diffusion in Metals: Recent Developments. Mater. Trans. 2003, 44, 14–27.
25.   Ribbe, J.; Esin, V.A.; Divinski, S.V. Grain boundary diffusion of 59 Fe in high-purity copper. Acta Mater. 2019, 165, 431–443.
      [CrossRef]
26.   Prokoshkina, D.; Rodin, A.; Esin, V. About Fe diffusion in Cu. Defect Diffus. Forum 2012, 323–325, 171–176. [CrossRef]
27.   Khairullin, A.; Nikulkina, V.; Zhevnenko, S.; Rodin, A. Peculiarity of grain boundary diffusion of Fe and Co in Cu. Defect Diffus.
      Forum 2017, 380, 135–140. [CrossRef]
28.   Rodin, A.; Khairullin, A. Diffusion and segregation behavior of Fe and Co in Cu. Mater. Lett. 2019, 239, 102–104. [CrossRef]
29.   Vengrenovitch, R.D. On the Ostwald ripening theory. Acta Metall. 1982, 30, 1079–1086. [CrossRef]
30.   Whipple, R. Concentration contours in grain boundary diffusion. Philos. Mag. 1954, 45, 1225–1236. [CrossRef]
31.   Fisher, J.C. Calculation of Diffusion Penetration Curves for Surface and Grain Boundary Diffusion. J. Appl. Phys. 1951, 22, 74–77.
      [CrossRef]
32.   Salje, G.; Feller-Kniepmeier, M. The diffusion and solubility of iron in copper. J. Appl. Phys. 1978, 49, 229. [CrossRef]
33.   Brunel, G.; Cizeron, G.C.; Lacombe, R.C.R. Chemical Diffusion Study of the Matano and Hau Methods in Copper·Nickel Couples
      Between 800 and 1060◦ ; The Variation of Activation Energy as a Function of Concentration. Acad. Sci. 1969, 296, 895.
34.   Rodin, A.; Prokoshkina, D.; Itckovitch, A.; Dolgopolov, N. About the Formation of the Supersaturated Solid Solutions by Diffusion
      Process. Defect Diffus. Forum 2015, 363, 35–39. [CrossRef]
35.   Itckovich, A.; Mendelev, M.; Rodin, A.; Bokstein, B. Effect of atomic complexes formation in grain boundaries on grain boundary
      diffusion. Defect Diffus. Forum 2018, 383, 103–111. [CrossRef]
36.   Zhevnenko, S.N.; Gershman, E. Grain boundary phase transformation in Cu–Co solid solutions. J. Alloys Compd. 2012, 536,
      554–558. [CrossRef]
37.   Bokstein, B.; Rodin, A. Surface tension gradient as additional driving force for grain boundary diffusion. Equilibrium and
      non-equilibrium cases. Metallofiz. Noveishie Tekhnol. 2013, 35, 1223–1230.

Disclaimer/Publisher’s Note: The statements, opinions and data contained in all publications are solely those of the individual
author(s) and contributor(s) and not of MDPI and/or the editor(s). MDPI and/or the editor(s) disclaim responsibility for any injury to
people or property resulting from any ideas, methods, instructions or products referred to in the content.
You can also read