Study of Seismic Performance of Chinese-Style Single-Layer Suspended Ceiling System by Shaking Table Tests
←
→
Page content transcription
If your browser does not render page correctly, please read the page content below
Hindawi
Advances in Civil Engineering
Volume 2021, Article ID 9861722, 14 pages
https://doi.org/10.1155/2021/9861722

Research Article
Study of Seismic Performance of Chinese-Style Single-Layer
Suspended Ceiling System by Shaking Table Tests

          Huanjun Jiang ,1,2 Yong Wang ,1,2 and Liusheng He                                     1

          1
              International Joint Research Laboratory of Earthquake Engineering, Tongji University, Shanghai 200092, China
          2
              State Key Laboratory of Disaster Reduction in Civil Engineering, Tongji University, Shanghai 200092, China

          Correspondence should be addressed to Yong Wang; yongwang0305@163.com

          Received 15 June 2021; Accepted 9 August 2021; Published 14 September 2021

          Academic Editor: Baofeng Huang

          Copyright © 2021 Huanjun Jiang et al. This is an open access article distributed under the Creative Commons Attribution License,
          which permits unrestricted use, distribution, and reproduction in any medium, provided the original work is properly cited.
          During some recent earthquakes, the suspended ceiling system (SCS) in buildings suffered severe damage. The seismic performance
          of SCS attracted more attention from researchers. In this study, full-scale shaking table tests on two Chinese-style single-layer SCSs
          with different boundary conditions are conducted. The seismic damage and earthquake responses, including acceleration,
          displacement, and strain responses, are compared. The effect of the boundary condition on the seismic performance of the SCS is
          studied. It is found that the seismic performance of the SCS is significantly affected by the boundary condition. Compared with the
          SCS with the free condition at the boundary, the damage to the SCS installed with seismic clips at the boundary is much slighter.
          Compared with the SCS with the free condition, the median of acceleration amplification factor (AAF), the peak displacement (PD),
          and maximum strain of the SCS installed with seismic clips are reduced by up to 63%, 99%, and 84%, respectively. At the end of the
          tests, the SCS with the free condition at the boundary completely collapsed with 68% of the panels falling, while only 15% of panels fell
          in the SCS installed with seismic clips. The seismic clips could avoid the falling of the grids from the peripheral support and ensure the
          integrity of the SCS. With the help of seismic clips installed at the boundary, the responses of the ceiling, such as acceleration,
          displacement, and strain, decrease significantly, and thereof, the collapse resistance capacity is improved.

1. Introduction                                                             earthquakes. Extensive postearthquake investigations and
                                                                            experimental studies showed that the failure of the ceiling
The seismic damage to nonstructural components (NSCs) in                    perimeter was one of the major reasons for the failure of the
buildings subjected to moderate or strong earthquakes in                    SCS [8–11]. In particular, the perimeter of Chinese-style
recent years was serious due to their high seismic fragility                single-layer SCS suffered severe damage in earthquakes due
and insufficient seismic design, leading to great economic                    to the lack of reliable connections with the main structures,
loss, interruption of building function, and even serious                   from which the damage usually started and spread to the
injuries and deaths [1–4]. For example, the statistical results             interior of the ceiling. The peripheral grid ends in Chinese-
show that NSCs represent 75% of the loss exposure of US                     style single-layer SCS usually sit freely on the boundary in
buildings to earthquakes and account for over 78% of the                    practice with only a small friction force; therefore, the ceiling
total estimated annualized earthquake loss [5]. Many                        perimeter is extremely prone to collide with the surrounding
buildings remained unoccupied weeks after the 2010–2011                     walls during earthquakes.
Canterbury earthquake sequences due to the damage to                            In recent decades, the seismic performance of the SCS
NSCs [6]. The falling of ceiling boards led to the loss of four             with acoustic lay-in panels was investigated mainly by
lives in the 2011 Tohoku earthquake [7]. As one of the NSCs                 shaking table tests by many researchers [8, 12–20]. Most of
most popularly applied in buildings, the suspended ceiling                  the SCSs tested in the past were typical American-style
system (SCS) with acoustic lay-in panels widely used in                     ceilings, whereas few studies examined the seismic perfor-
public buildings was seriously damaged during recent                        mance of Chinese-style ceilings with different details from
2                                                                                                  Advances in Civil Engineering

American-style ceilings. The main differences between               location was different. The mean value and standard deviation
Chinese- and American-style ceilings are as follows: (1) in        of the pounding gaps are 3.05 mm and 2.08 mm, respectively.
Chinese-style ceilings, threaded rods are mainly adopted to        The mean value of the pounding gaps at different locations is
hang the grid system, while in the American-style ceilings,        regarded as the representative value for future analysis.
hanging wires are adopted, and (2) the perimeter of Chinese-       Figure 2(b) shows the details of the free condition.
style ceilings usually rests on surroundings without any
constraints, while that of American-style ceilings is con-
nected to the surroundings with pop rivets or seismic clips.       2.2.2. Seismic Clip Connection. There are two kinds of
The seismic clip connection constraining the peripheral grid       seismic clip connections (SCCs), that is, fixed connection and
to the boundary was proved to improve significantly the             semifree connection. For fixed connection (FC), two screws in
seismic performance of the SCS [21–23]. However, so far, no        the grid-screw holes and one screw in the middle slot of the
study has been conducted to investigate the effect of the           seismic clip are used for attaching the grid to the seismic clip.
seismic clip connection on the seismic performance of              For semifree connection (SFC), only one screw is put in the
Chinese-style single-layer SCS. Although the seismic clip is       middle slot of the seismic clip, allowing the grid to slide only
recommended to constrain the peripheral grid to the                along its axial direction, while the movement perpendicular to
boundary by Chinese standard J502-2 [24], it is applied            the axial direction of the grid is prevented. In addition, in the
rarely in China in practice, leading to the falling of the         case of SFC, a nominal pounding gap of 19 mm between the
peripheral girds at the boundary and even triggering the           grid end and wall angle is set, whereas no pounding gap exists
continuous collapse of the ceiling during earthquakes. In this     in the case of FC. It should be noted that the actual mean value
paper, the seismic performance of two Chinese-style single-        and standard deviation of the pounding gaps for SFC are
layer SCSs with different boundary conditions is compared           17.33 mm and 1.86 mm, respectively. For the two types of
by shaking table tests. The effect of seismic clips is studied.     SCCs mentioned above, the seismic clips are installed on the
                                                                   perimeter beam using four perimeter screws. Figure 3 shows
                                                                   the details of the seismic clip connection.
2. Chinese-Style Single-Layer Suspended
   Ceiling System
                                                                   3. Test Program
2.1. Constitution of Single-Layer Suspended Ceiling System.
The Chinese-style single-layer SCS considered herein               3.1. Test Setup and Specimen. The steel platform with the
comprises threaded rods, a grid system, and lay-in panels, as      plan dimensions of 12.84 m × 11.64 m and a height of 5.40 m
shown in Figure 1. Threaded rods are suspended from the            is adopted as a test carrier to hang the SCS. Figure 4 shows
bottom of the floor of the platform and adopted for hanging         the steel platform. Three levels along with the height of the
the grid system and lay-in panels. The grid system consists of     platform, table level, ceiling level, and floor level, are con-
main tees, cross tees, sub cross tees, and wall angles, forming    sidered. In order to simulate the boundary condition of the
a module for placing lay-in panels. The connection between         specimen, the perimeter and middle beams are fixed on the
the main tees is achieved by mechanically inserting the main       platform to represent the surrounding walls. Moreover, the
tee end into the socket of the other main tee. The connection      middle beam is adopted to separate the SCS into two
between the main tee and the cross tee is achieved by              comparative ceilings. The measured fundamental frequen-
mechanically inserting two cross tee ends into the socket of       cies of the platform obtained by the transfer function
the main tee. Similarly, the connection between the cross tee      method under white noise are 8.9 Hz in the X direction and
and the sub cross tee is achieved by mechanically inserting        8.4 Hz in the Y direction, respectively.
two sub cross tee ends into the socket of a cross tee. The             The specimen consisting of two parts, B1 and B2, was
threaded rod is directly connected to the main tee by a            designed and constructed. The two parts have the same
hanger, resulting in the single-layer connection between the       layout but different boundary conditions. For B1, the
threaded rod and ceiling grid. The threaded rods and ceiling       boundary condition of the four sides is free. For B2, the
grids are made of steel with the strength grade of Q235            boundary condition is fixed-semifree, which is realized by
having a yield strength of 235 MPa. The lay-in panels are          adopting fixed connections at two adjacent sides and
made of mineral fiber with a mass density of 208 kg/m3.             semifree connections at other sides. The two parts are
                                                                   suspended from the bottom of the same floor of the platform
                                                                   to ensure the same input excitation. The overall view and
2.2. Ceiling Perimeter Connection                                  photo of the specimen are shown in Figure 5. The grid
                                                                   system is suspended by means of threaded rods with a di-
2.2.1. Free Condition. Two different types of boundary              ameter of 8 mm and a length of 1000 mm. The threaded rods
conditions, free condition and seismic clip connection, are        are placed with an interval of 1200 mm. The main tees are
studied in this test. For free condition, the peripheral grid      placed parallel to each other with an interval of 1200 mm
ends just sit on the wall angle fixed on the perimeter beam         along the Y direction. The cross tees with the spacing of
using screws (Figure 2(a)). A clearance named as pounding          600 mm are placed perpendicular to the main tees, and the
gap exists between the peripheral grid end and wall angle. Due     sub cross tees with the spacing of 1200 mm are placed
to the lack of precise control of the installation, the pounding   parallel to the main tees. The wall angles are fixed on the
gap in the SCS with free boundary condition at a different          board of the perimeter beams and middle beams.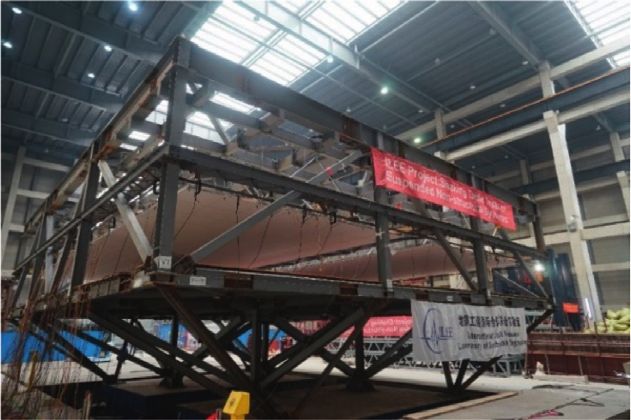
Advances in Civil Engineering                                                                                                                                   3

                                                                     Threaded rod                        Single-layer
                                                   Main-cross tee                                        connection
                                                    connection

                                                                               Sub cross tee
                                                          Cross-sub cross
                                                          tee connection
                                                                                            Cross tee

                                                    Main tee
                                                                                                         Main tee
                                                   connection
                                                                                Lay-in panel

                                                                              (a)
                                                     43

                                                                                      35

                                                                                                                 30
                                                                24                                 24                         24

                                                          (b)                                (c)                        (d)

                                                                        600
                                                            16
                                                            600
                                  22

                                              22                       600

                                        (e)                          (f )                          (g)                             (h)

                                       Main tee                                            Cross tee                      Hanger

                                                                                                                                                    Cross tee
                                                                                                                        Cross tee

                                                                                     Main tee                                            Main tee

                                        (i)                                          (j)                                                  (k)

Figure 1: Constitution of Chinese-style single-layer suspended ceiling system. (a) Single-layer ceiling, (b) main tee, (c) cross tee, (d) sub
cross tee, (e) wall angle, (f ) lay-in panel, (g) threaded rod, (h) hanger, (i) main tee connection, (j) main-cross tee connection, and (k) single-
layer connection.

3.2. Instrumentation. For the platform, there are 3, 4, and 5                       ceiling level. Accelerometers denoted as F1 to F5 are in-
accelerometers installed on table level, ceiling level, and floor                    stalled at floor level.
level, respectively, as shown in Figure 6. Accelerometers                                A total of 30 accelerometers are installed on the ceiling
denoted as T1 to T3 are located on the left table center at                         grids and lay-in panels to monitor the absolute acceleration
table level. The acceleration of the table can be regarded as                       of the specimen. The acceleration of the main tee and the
the input to the platform. Accelerometers denoted as P1 to                          cross tee corresponds to the Y direction and X direction
P4 are placed at the mid-span of each perimeter beam at                             acceleration, respectively. A total of 17 displacement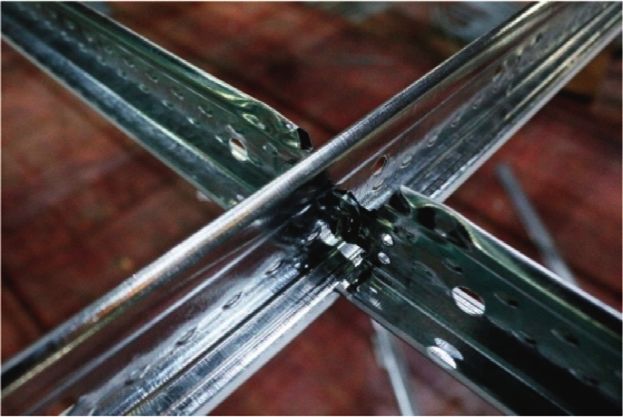
4                                                                                                                                                       Advances in Civil Engineering

                                                                                 Perimeter beam
                                                                                                                        Wall angle

                                                                                         Pounding gap

                                                                                                  Unseating gap
                                                                                                                          Ceiling grid

                                                                                                          (a)
             Pounding gap Unseating gap
                                                                                            Main tee
                                                                            Cross tee                           Strain gauge

                                                                                                                                                                           Free condition
                          Free condition

                                                           Wall angle
                                                                                                                Accelerometer                    Unseating gap Pounding gap
                                           Displacement transducer                           Target
                                                                                                          (b)

                                                 Figure 2: Free condition at boundary. (a) Connection and (b) details of connection.

                                                             Seismic clip                Perimeter beam                    Wall angle      Perimeter-screw hole
              Perimeter screws                                                                                                                                          Grid bulb
                                                                                                                                                                          fixer
                                                                                                                         Seismic clip
                                                  Sliding screw
                                                                   Fixing screws                                          Sliding screw
                                                                                        Pounding gap
                                                                                                                                                          Slot
                                                      Wall angle                                                         Ceiling grid
                                                                                                                                             Clamp
                                Perimeter beam                    Ceiling grid                                  Unseating gap                           Grid-screw hole

                                                     (a)                                                    (b)                                              (c)
                                                             Seismic clip                  Main tee
                                                                         Cross tee                              Strain gauge

                                                                                                                                                                                      Semifree condition
              Fixed condition

                                                      Wall angle
                                                                                                                 Accelerometer              Unseating gap        Pounding gap
                                Displacement transducer                                      Target

                                                                                                          (d)

Figure 3: Seismic clip connection at boundary. (a) Fixed connection, (b) semifree connection, (c) seismic clip, and (d) details of connection.

              Perimeter beam                                 Floor level

                                                                                     Perimeter beam
             Z                                              Middle beam
                            Y Ceiling level                                                                                               Middle beam
                            X                                 Table level

                                                    (a)                                                   (b)                                               (c)

                                   Figure 4: Test setup. (a) Overall view of steel platform, (b) perimeter beam, and (c) middle beam.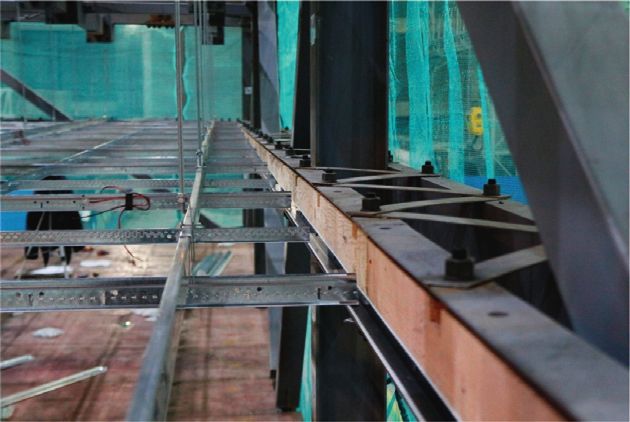
Advances in Civil Engineering 5
Free co
n dition
iti on Semifre Threaded rod
cond e condit
ion
Free
n
itio
ec ond n
Fre itio
B1 c ond Single-layer connection
e d
Fre Fix
n
ec
tio
ond
di
itio Sub cross tee
on
n Lay-in panel
ec
B2
e
ifr
Main tee
Fix
m
ed
Se
con Cross tee
dit
ion
X
Y
(a) (b)
Figure 5: Test specimen. (a) Overall view of the specimen and (b) photo of the specimen.
P3 F3
T2 T3
T1
P2 P4 F2 F4
Y
Z X
P1 F5 F1
Accelerometer in X dir.
Accelerometer in Y dir. Accelerometer in X dir. Accelerometer in X dir.
Accelerometer in Z dir. Accelerometer in Y dir. Accelerometer in Y dir.
Accelerometer in Z dir. Accelerometer in Z dir.
(a) (b) (c)
Figure 6: Accelerometers on the platform. (a) Table level, (b) ceiling level, and (c) floor level.
transducers are placed at the perimeter beams to monitor the generated to explore the failure mechanism of the specimen,
displacement of the specimen relative to the platform. A as shown in Figure 8. Figure 9 presents the BCJ-L2 wave. The
total of 140 strain gauges are attached to the threaded rods, natural wave named SHW6 from Shanghai seismic design
ceiling grids, and lay-in panels to monitor the local strain code [25] is input to a benchmark model of a 128-story
responses of the specimen. Except for lay-in panels with supertall building structure and a 30-story stick model. The
strain rosette installed, two strain gauges are attached to both acceleration response at the 5th floor and the top of the
sides of the same position of each ceiling component, and benchmark model and the acceleration response at the top of
the average of the results obtained from two gauges is the stick model are derived and applied as the input motions
adopted in data analysis. Only the measurement points for (named as SHW6 (5/128), SHW6 (128/128), and SHW6 (30/
subsequent analysis are marked. Figure 7 shows the location 30), respectively). Figure 10 shows the floor acceleration
of instrumentation on the specimen. The hollow one-way time history. All the motions input in the tests are sum-
red arrow and blue arrow represent the positive direction of marized in Table 1. Figure 11 presents the acceleration re-
displacement and acceleration, respectively. sponse spectrum (ARS) with the damping ratio of 5% from
runs 6 to 14 with the same peak acceleration of 0.1 g. After
each run, bidirectional white noise excitation is used to
3.3. Input Motions and Testing Protocol. Three types of evaluate the dynamic properties of the specimen. The peak
motions are used for the input excitations, including sweep floor acceleration (PFA) of the platform is listed in Table 1. It
waves (named as sweep), acceleration responses at different should be noted that the PFA of the platform increases
floors of building structures obtained by time-history significantly from run 26 because of the looseness of some
analysis, and artificial waves from the Building Center of bolts of the platform subjected to the strong inputs.
Japan (named as BCJ-L2). The BCJ-L2 wave with a duration Bidirectional white noise with the PGA of 0.05 g is input
of 120 s is a Japanese artificial earthquake wave representing to identify the dynamic characteristics of the specimen.
level 2 (design basis). The original PGA, PGV, and PGD of However, it is extremely difficult to identify the individual
BCJ-L2 wave are 355.66 cm/s2, 53.37 cm/s, and 42.36 cm, natural frequency of the specimen because the excitation
respectively. The sweep wave that is the sine wave with the intensity is observed to be too low to overcome the initial
variation of frequency from 5.0 Hz to 0.5 Hz or 0.8 Hz is friction force existing in the specimen perimeter, which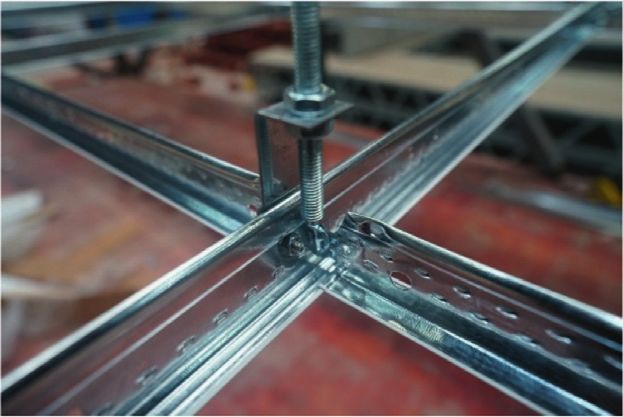
6                                                                                                                                                           Advances in Civil Engineering

                                                        D1                               D4                                      D8                         D11

                                              D40                                                                              S39 (40)                                D12
                                                         A14                                    A15         A10
                                                                                                                                                     S7 (8)
                                                                                                            A11

                                                                                                            A12
                                                                                                                                                                       D16
                                                             A1         A2     A3         A4          A5          A6     A7                A8            A9

                                                             S70 (71)
                                                                                                            A13
                                              D39                                                                                                    S19 (20)          D18

                                                                                                                              S108 (109)                               D19
                                                         A29                                     A30        A25
                                                                                                                                                     S76 (77)

                                                                                                            A26
                                                                                                                                                                       D22
                                                                                                            A27                                         A24
                                                         A16            A17   A18         A19         A20         A21    A22               A23

                                                             S139 (140)

                                             Y                                                              A28
                                                                                                                                                     S88 (89)          D25

                                                    X
                                         Z              D36                          D33                     D31                D29                         D26

                                                              Main tee                                                   Wall angle
                                                              Cross tee                                                  Threaded rod
                                                              Sub cross tee

Figure 7: Instrumentation on the specimen. Notes:        represents displacement transducer;      represents accelerometer; represents
strain gauge on the threaded rod; represents strain gauge on lay-in panel; and represents strain gauge on the main tee, cross tee, and sub
cross tee.

                             0.06
         Acceleration (g)

                             0.03
                             0.00
                            -0.03
                            -0.06
                                    0         10              20              30                40             50                60             70              80           90     100
                                                                                                             Time (s)
                                                                                          Figure 8: Sweep wave.

                            0.050
     Acceleration (g)

                            0.025
                            0.000
                            -0.025
                            -0.050
                                     0       10         20              30          40               50         60             70          80          90            100      110   120
                                                                                                              Time (s)
                                                                                          Figure 9: BCJ-L2 wave.

causes the specimen to move with the platform together.                                                           Furthermore, the response of the specimen under the ex-
Hence, the natural frequency of the specimen derived by the                                                       citation of the sweep wave with the amplitude of 0.15 g is
transfer function method is very close to that of the platform.                                                   used to derive the natural frequency of the specimen.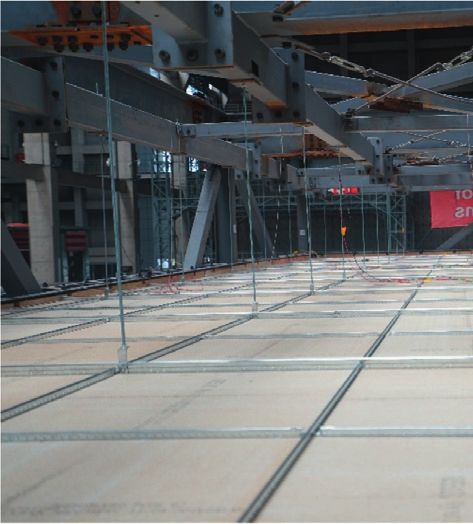
Advances in Civil Engineering 7
0.10 0.10
Acceleration (g)
0.05 0.05
Acceleration (g)
0.00 0.00
-0.05 -0.05
-0.10 -0.10
0 10 20 30 40 50 60 70 0 10 20 30 40 50 60 70
Time (s) Time (s)
(a) (b)
0.2 0.2
0.1 0.1
Acceleration (g)
Acceleration (g)
0.0 0.0
-0.1 -0.1
-0.2 -0.2
0 10 20 30 40 50 60 70 0 10 20 30 40 50 60 70
Time (s) Time (s)
(c) (d)
0.50 0.50
0.25 0.25
Acceleration (g)
Acceleration (g)
0.00 0.00
-0.25 -0.25
-0.50 -0.50
0 30 60 90 120 150 0 30 60 90 120 150
Time (s) Time (s)
(e) (f )
Figure 10: Floor acceleration time history. (a) SHW6 (5/128) wave in X direction, (b) SHW6 (5/128) wave in Y direction, (c) SHW6 (128/128)
wave in X direction, (d) SHW6 (128/128) wave in Y direction, (e) SHW6 (30/30) wave in X direction, and (f) SHW6 (30/30) wave in Y direction.
Table 1: Details of motions input to the specimen and peak floor acceleration of platform.
Target acc. of table (g) PFA of platform (g)
Run no.1 Name of input motion Loading direction
X direction Y direction X direction Y direction
2 Sweep X 0.050 0 0.104 —
4 Sweep Y 0 0.050 — 0.091
6 BCJ-L2 X 0.037 0 0.063 —
8 BCJ-L2 Y 0 0.037 — 0.055
102 SHW6 (5/128) X-Y 0.089 0.070 0.146 0.130
122 SHW6 (128/128) X-Y 0.149 0.132 0.168 0.177
142 SHW6 (30/30) X-Y 0.405 0.377 0.636 0.636
16 Sweep X 0.150 0 0.284 —
18 Sweep Y 0 0.150 — 0.405
20 Sweep X-Y 0.150 0.150 0.368 0.453
22 Sweep X-Y 0.150 −0.150 0.490 0.612
24 Sweep X 0.250 0 0.553 —
26 Sweep Y 0 0.250 — 1.084
28 Sweep X 0.350 0 0.970 —
30 Sweep Y 0 0.350 — 3.350
32 Sweep X 0.500 0 2.053 —
Notes. 1Runs of odd numbers used for white noise excitation with small magnitude are not listed in the table. 2During runs 10 and 12, the floor acceleration
responses at the 5th and 128th floors of the 128-story building subjected to the ground motion SHW6 are input, and during run 14, the floor acceleration
response at the 30th floor of the 30-story building is input.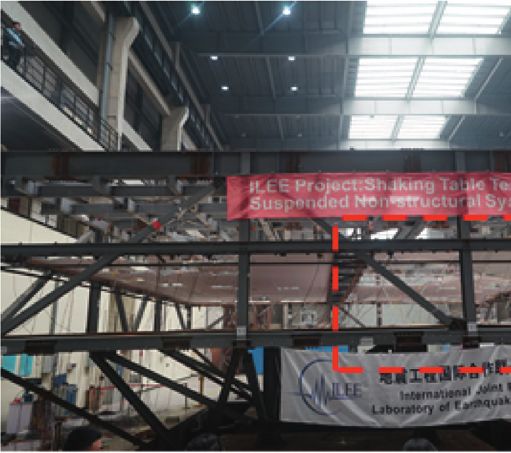
8                                                                                                                Advances in Civil Engineering

              0.8                                                                the static test on the connection, the average compressive
                                                                                 and tensile strengths of the main-cross tee connection are
              0.6                                                                475 N and 1151 N, respectively [27]. No significant damage
                                                                                 continued to occur in B1 while the falling of 11 panels and
    ARS (g)

              0.4                                                                dislodgement of 2 panels occurred in B2 under run 30. After
                                                                                 the last run, B1 completely collapsed with the ratio of falling
              0.2                                                                panels to total panels reaching 68%. Part of main-cross tee
                                                                                 connections failed, and 15% of panels fell in B2. Compared
              0.0                                                                with B1, the damage to B2 is much slighter, indicating that
                    0      1        2         3          4        5        6     the Chinese-style single-layer SCS with seismic clips has
                                          Period (s)                             better seismic performance than the one with free boundary
                                                                                 condition. It should be noted that only the damage to lay-in
                        BCJ-L2                         SHW6(128/128) in Y dir.
                        SHW6(5/128) in X dir.          SHW6(30/30) in X dir.
                                                                                 panels is marked in the last run because the damage to other
                        SHW6(5/128) in Y dir.          SHW6(30/30) in Y dir.     ceiling components is hard to count.
                        SHW6(128/128) in X dir.
Figure 11: Acceleration response spectrum with the damping ratio                 4.2. Acceleration Response
of 5%.
                                                                                 4.2.1. Acceleration Time History. The acceleration time
                                                                                 history of the specimen under sweep waves with a PGA of
Although the friction force can be overcome during the
                                                                                 0.15 g is shown in Figure 14. The channels A12 and A27 are
input with higher intensity, the measured acceleration time
                                                                                 selected to compare the acceleration responses of B1 and B2
history of the specimen is easily disturbed by the high-
                                                                                 in the X direction, respectively. The channels A6 and A21 are
frequency spikes due to the powerful collision between the
                                                                                 selected to compare the acceleration responses of B1 and B2
specimen and perimeter beams.
                                                                                 in the Y direction, respectively. Under 0.15 g sweep waves,
                                                                                 the acceleration response of B2 with seismic clips is sig-
4. Test Results and Discussions                                                  nificantly reduced compared with that of B1 with free
4.1. Damage to SCS                                                               boundary condition. Large acceleration amplification in B1
                                                                                 is caused by the severe pounding occurring at the ceiling
4.1.1. Damage Modes. The damage to B2 with seismic clips is                      perimeter. The movement of end grids in B2 is restrained by
significantly slighter than that to B1 with free boundary                         seismic clips so that the collision with the boundary is
condition. The damage modes of the specimen during the                           reduced.
shaking table tests are summarized in Table 2. The boundary
condition has a significant impact on the damage modes of
                                                                                 4.2.2. Acceleration Amplification Factor. The acceleration
the SCS. B1 suffers more severe damage characterized by the
                                                                                 amplification factor (AAF) is a key parameter affecting the
unseating of grid and buckling of wall angle, while B2 does
                                                                                 seismic performance of the SCS. The AAF is defined as the
not suffer such kind of damage during the loading process,
                                                                                 ratio of the peak ceiling grid acceleration to the peak floor
which proves that the seismic clips play the role in pre-
                                                                                 acceleration. The peak AAF prescribed in Chinese code GB
venting the unseating of the peripheral grids from the wall
                                                                                 50011 (2010) [28] and American code ASCE 7–10 (2010) [29]
angles and improving the seismic performance of the SCS.
                                                                                 takes the values of 2.0 and 2.5 for the SCS, respectively. The
The typical damage to the specimen observed in the tests is
                                                                                 test data under earthquake waves (BCJ-L2, SHW6 (5/128),
shown in Figure 12.
                                                                                 SHW6 (128/128), and SHW6 (30/30)) are used to calculate the
                                                                                 AAF. Figure 15 shows the statistical parameters (maximum,
4.1.2. Damage Evolution. The damage process of the spec-                         minimum, and median) of the AAFs of the specimen. The
imen is demonstrated in Figure 13. No damage to the                              median of the AAF is regarded as the representative value to
specimen was observed before the input motion of run 26.                         compare with the code limit [30, 31]. Most of the AAFs of B1
Under run 26, the unseating of 3 grid ends from the wall                         are larger than the code limit due to the violent collision at the
angle, dislodgement of 2 panels near the unseating location,                     ceiling perimeter while all AAFs of B2 are smaller than the
and shear deformation of 2 columns of main-cross tee                             code limit with the help of seismic clips. Compared with B1,
connections near the X direction ends were found in B1,                          the median AAFs of B2 under earthquake waves are reduced
while B2 remained undamaged. Under run 28, 6 columns of                          by 63% and 37% in the X and Y directions, respectively,
the main-cross tee connections buckled under axial com-                          indicating that the seismic clips could provide the constraint
pressive loads, and all the grid ends and surrounding panels                     at the boundary effectively and significantly reduce the ac-
at both ends in the X direction suffered severe damage in B1.                     celeration response of the SCS. The median AAF of B1 in the
However, only a column of main-cross tee connections                             X direction is larger than that in the Y direction, which is
buckled due to axial compressive loads in B2. The main-                          attributed to smaller horizontal stiffness in the X direction
cross tee connections are vulnerable to axial buckling due to                    than that in the Y direction. According to the test results, most
the reason that the compressive strength of the connection is                    of the AAFs of B1 are larger than the code limit, indicating
much smaller than its tensile strength [6, 26]. According to                     that the code limit is not safe enough for the SCS with free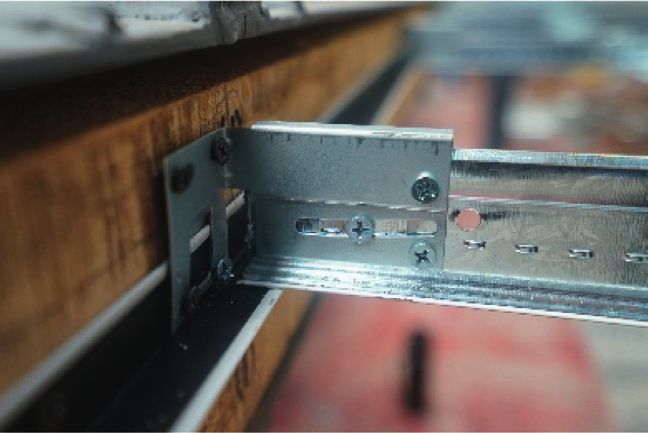
Advances in Civil Engineering                                                                                                                 9

                                   Table 2: Damage modes of the specimen during the shaking table tests.
                                                                                                                              Specimen
Damage no.                                                Damage mode
                                                                                                                        B1                 B2
D1                                                       Unseating of grid                                              Yes                No
D2                                                     Buckling of wall angle                                           Yes                No
D3                               Axial buckling or shear deformation of main-cross tee connection                       Yes                Yes
D4                                                     Dislodgement of panel                                            Yes                Yes
D5                                            Separation of main-cross tee connection                                   Yes                Yes
D6                                                        Falling of panel                                              Yes                Yes
D7                                               Separation of main tee connection                                      Yes                No
D8                                                        Buckling of grid                                              Yes                No
D9                                                     Deformation of hanger                                            Yes                Yes
D10                                                        Falling of grid                                              Yes                Yes
D11                                                      Complete collapse                                              Yes                No

                           (a)                                        (b)                                        (c)

                           (d)                                        (e)                                        (f )

                           (g)                                        (h)                                         (i)

                                                 (j)                                        (k)

Figure 12: Typical damage to the specimen. (a) Unseating of grid, (b) buckling of wall angle, (c) axial buckling or shear deformation of
main-cross tee connection, (d) dislodgement of panel, (e) separation of main-cross tee connection, (f ) falling of panel, (g) separation of main
tee connection, (h) buckling of grid, (i) large deformation of hanger, (j) falling of grid, and (k) complete collapse. Note: the damage modes of
axial buckling and shear deformation of main-cross tee connection are basically similar.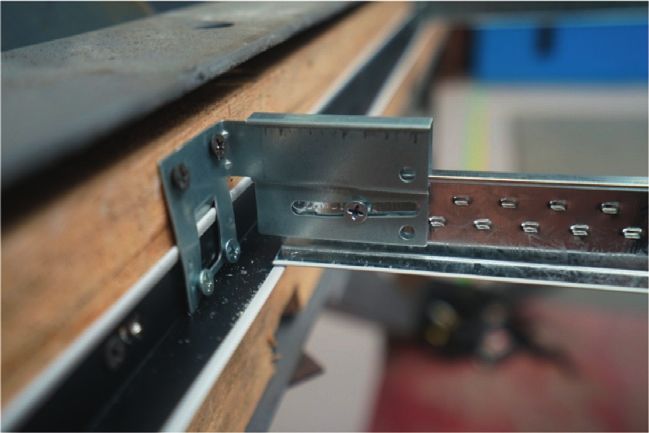
10                                                                                                                                                Advances in Civil Engineering

                                        (a)                                          (b)                                                               (c)

                                                              (d)                                                                (e)

Figure 13: Damage process of the specimen. (a) Before run 26, (b) 0.25 g (Y) sweep (run 26), (c) 0.35 g (X) sweep (run 28), (d) 0.35 g (Y)
sweep (run 30), and (e) 0.5 g (X) sweep (run 32). Notes: represents unseating of grid;   represents buckling of wall angle; represents
axial buckling or shear deformation of main-cross tee connection; represents dislodgement of panel; and represents falling of panel.

                          2                                                                                   2

                          1                                                                                   1
       Acceleration (g)

                                                                                           Acceleration (g)

                          0                                                                                   0

                          -1                                                                                  -1

                          -2                                                                                  -2
                               0   10   20    30   40     50 60     70   80   90   100                             0   10   20   30    40     50 60       70   80   90   100
                                                        Time (s)                                                                            Time (s)

                                   B1                         A12                                                      B1                           A6
                                   B2                         A27                                                      B2                           A21
                                                        (a)                                                                                 (b)

                          Figure 14: Acceleration time history: 0.15 g sweep. (a) Response in X direction and (b) response in Y direction.

boundary condition. On one hand, the code limit is an                                            BCJ-L2, SHW6 (5/128), SHW6 (128/128), and SHW6 (30/
empirical value and lacks sufficient evidence. On the other                                        30), corresponding to the inputs with PGA of 0.037 g,
hand, the code limit does not consider the effect of the                                          0.089 g, 0.149 g, and 0.405 g, respectively, are considered.
boundary condition of the SCS. Therefore, the code limit                                         Under sweep waves, three intensities corresponding to
needs to be further studied and clarified clearly.                                                the inputs with PGA of 0.05 g, 0.15 g, and 0.25 g are
                                                                                                 considered. Whether the inputs are earthquake or sweep
                                                                                                 waves, the PD increases as the PFA increases. Compared
4.3. Peak Displacement. Figures 16 and 17 present the peak                                       with B1, the PDs of B2 are reduced by 65% to 99% and
displacement (PD) versus PFA relationship under                                                  57% to 91% under earthquake and sweep waves, re-
earthquake waves and sweep waves, respectively. Under                                            spectively. The PD of B2 is much lower than that of B1,
earthquake waves, four kinds of input excitations, that is,                                      which implies that seismic clips provide the restraint
Advances in Civil Engineering 11
10
8
6
5.40
AAF
4.05 4
2.73
2
1.38 1.44 1.23
0.86 1.01 0.87
0.90
0 0.80 0.61
X Y X Y
B1 B2
ASCE 7-10(2010) Maximum
GB 50011(2010) Minimum
Test data Median
Figure 15: Acceleration amplification factor of the specimen.
10 10
8 8
6 6
PD (mm)
PD (mm)
4 4
2 2
0 0
0.0 0.1 0.2 0.3 0.4 0.5 0.6 0.7 0.0 0.1 0.2 0.3 0.4 0.5 0.6 0.7
PFA (g) PFA (g)
B1 B1
B2 B2
(a) (b)
Figure 16: Peak displacement under earthquake waves. (a) Response in X direction and (b) response in Y direction.
effectively at the boundary and significantly reduce the grid connection should be improved to avoid the prema-
displacement of the ceiling. ture failure of the connection.
4.4. Strain Response 4.4.2. Maximum Strain versus PFA Relationship.
Figure 18 presents the maximum strain versus PFA rela-
4.4.1. Maximum Strain of Ceiling Component. The maxi- tionship of the representative locations in the ceiling
mum strain of 177 με measured on the ceiling components components under floor earthquake waves (SHW6 (5/128),
before the collapse of the ceiling is much lower than the SHW6 (128/128), and SHW6 (30/30)). The measuring points
yield strain of the ceiling components, which demonstrates on the threaded rod of B1 and B2 correspond to S70(71) and
that all ceiling components roughly remain elastic during S139(140), respectively. The measuring points on the main
the loading runs before the collapse of the ceiling. The tee of B1 and B2 correspond to S39(40) and S108(109),
reason is that the strength of the ceiling components is respectively. The measuring points on the cross tee of B1 and
much larger than that of the grid connections. Hence, most B2 correspond to S19(20) and S88(89), respectively. The
damage to the specimen occurs at the connections rather measuring points on the sub cross tee of B1 and B2 cor-
than the components. The load-carrying capacity of the respond to S7(8) and S76(77), respectively. The measured12 Advances in Civil Engineering
10 10
8 8
6 6
PD (mm)
PD (mm)
4 4
2 2
0 0
0.1 0.2 0.3 0.4 0.5 0.6 0.0 0.2 0.4 0.6 0.8 1.0 1.2
PFA (g) PFA (g)
B1 B1
B2 B2
(a) (b)
Figure 17: Peak displacement under sweep waves. (a) Response in X direction and (b) response in Y direction.
80 50
40
60
Maximum strain (με)
Maximum strain (με)
30
40
20
20
10
0 0
0.1 0.2 0.3 0.4 0.5 0.6 0.7 0.1 0.2 0.3 0.4 0.5 0.6 0.7
PFA (g) PFA (g)
B1 B1
B2 B2
(a) (b)
80 20
60 15
Maximum strain (με)
Maximum strain (με)
40 10
20 5
0 0
0.1 0.2 0.3 0.4 0.5 0.6 0.7 0.1 0.2 0.3 0.4 0.5 0.6 0.7
PFA (g) PFA (g)
B1 B1
B2 B2
(c) (d)
Figure 18: Maximum strain versus PFA relationship of ceiling components. (a) Threaded rod, (b) main tee, (c) cross tee, and (d) sub cross
tee.Advances in Civil Engineering 13
strain on the threaded rod mainly reflects its bending de- References
formation. The measured strain on other grids mainly re-
flects their axial deformation. The maximum strain of all the [1] E. Miranda, G. Mosqueda, R. Retamales, and G. Peckan,
components generally increases as the PFA increases. The “Performance of nonstructural components during the 27
February 2010 Chile earthquake,” Earthquake Spectra, vol. 28,
maximum strain of B1 is larger than that of B2. Compared
no. S1, pp. 453–471, 2012.
with B1, the maximum strains on the threaded rod, main tee, [2] R. P. Dhakal, G. A. MacRae, and K. Hogg, “Performance of
cross tee, and sub cross tee of B2 under floor earthquake ceilings in the February 2011 Christchurch earthquake,”
waves are reduced by up to 84%, 82%, 84%, and 25%, re- Bulletin of the New Zealand Society for Earthquake Engi-
spectively. The larger strain of B1 is caused by the severe neering, vol. 44, no. 4, pp. 377–387, 2011.
collision at the ceiling perimeter. The results indicate that [3] K. Kasai, A. Mita, H. Kitamura, K. Matsuda, and A. Troy,
seismic clips are effective to reduce the strain response of the “Performance of seismic protection technologies during the
ceiling components. 2011 Tohoku-Oki earthquake,” Earthquake Spectra, vol. 29,
no. S1, pp. 265–293, 2013.
5. Conclusions [4] D. Perrone, P. M. Calvi, R. Nascimbene, E. C. Fischer, and
G. Magliulo, “Seismic performance of non-structural ele-
The full-scale shaking table tests are carried out on Chinese- ments during the 2016 central Italy earthquake,” Bulletin of
style single-layer SCS. The effects of the boundary condition Earthquake Engineering, vol. 17, no. 10, pp. 5655–5677, 2019.
[5] S. Taghavi and E. Miranda, Response Assessment of Non-
on the damage and dynamic responses of the SCS are
structural Building Elements. PEER Report 2003/05, Pacific
studied. The following conclusions can be obtained:
Earthquake Engineering Research Center, California, CA,
(1) In the SCS with free boundary condition, the pe- USA, 2003.
ripheral connections and main-cross tee connections [6] R. P. Dhakal, G. A. Macrae, A. Pourali, and G. Paganotti,
are most vulnerable to earthquakes and dominant to “Seismic fragility of suspended ceiling systems used in NZ
earthquake resistance capacity of the SCS. based on component tests,” Bulletin of the New Zealand
Society for Earthquake Engineering, vol. 49, no. 1, pp. 45–63,
(2) The damage to the ceiling with free boundary con- 2016.
dition during seismic excitations starts from the [7] M. Masato and M. Kazuya, “Building damage during the 2011
peripheral connections and spreads to the inner parts off the pacific coast of Tohoku earthquake,” Soils and
of the SCS. The collision between the ceiling pe- Foundations, vol. 52, no. 5, pp. 929–944, 2012.
rimeter and the boundary adversely affects the [8] ANCO, Seismic Hazard Assessment of Nonstructural Ceiling
seismic performance of the ceiling with free Components. NSF Rep. No. CEE-8114155, ANCO, Culver City,
boundary condition. CA, USA, 1983.
[9] S. Soroushian, M. Maragakis, and C. Jenkins, “Capacity
(3) Compared with the SCS with free boundary con- evaluation of suspended ceiling-perimeter attachments,”
dition, the seismic performance of the SCS installed Journal of Structural Engineering, vol. 142, no. 2, Article ID
with seismic clips at the boundary is much better. 04015124, 2016.
The boundary condition has a significant impact on [10] D. Wang, J. Dai, Z. Qu, and X. Ning, “Shake table tests of
the damage modes and seismic performance of the suspended ceilings to simulate the observed damage in the M
Chinese-style single-layer SCS. s7.0 Lushan earthquake, China,” Earthquake Engineering and
(4) The seismic clips could effectively reduce the damage Engineering Vibration, vol. 15, no. 2, pp. 239–249, 2016.
[11] H. J. Jiang, Y. Wang, K. Kasai, S. Motoyui, and T. Chhat,
and dynamic responses of the ceiling so as to im-
“Shaking table tests on Chinese style suspended ceiling sys-
prove the seismic performance of the SCS. It is tems,” in Proceedings of the 17th World Conference On
recommended that in practice, the peripheral grid Earthquake Engineering, Sendai, Japan, September 2020.
ends of the ceiling should be restrained to the [12] S. S. Rihal and G. Granneman, Experimental Investigation of
boundary by using seismic clips. the Dynamic Behavior of Building Partitions and Suspended
Ceilings During Earthquake. Rep. No. ARCE R84-1, California
Data Availability Polytechnic State University, Pomona, California, 1984.
[13] G. C. Yao, “Seismic performance of direct hung suspended
The test data used to support the findings of this study are ceiling systems,” Journal of Architectural Engineering, vol. 6,
included within the article. no. 1, pp. 6–11, 2000.
[14] H. Badillo-Almaraz, A. S. Whittaker, and A. M. Reinhorn,
“Seismic fragility of suspended ceiling systems,” Earthquake
Conflicts of Interest Spectra, vol. 23, no. 1, pp. 21–40, 2007.
[15] A. S. J. Gilani, A. M. Reinhorn, B. Glasgow, O. Lavan, and
The authors declare that there are no conflicts of interest H. K. Miyamoto, “Earthquake simulator testing and seismic
regarding the publication of this study. evaluation of suspended ceilings,” Journal of Architectural
Engineering, vol. 16, no. 2, pp. 63–73, 2010.
Acknowledgments [16] S. Soroushian, K. L. Ryan, M. Maragakis et al., “NEES/E-
Defense tests: seismic performance of ceiling/sprinkler piping
The authors acknowledge the financial support from the nonstructural systems in base isolated and fixed base build-
International Joint Research Laboratory of Earthquake En- ing,” in Proceedings of the 15th World Conference on Earth-
gineering of Tongji University (Grant no. 0200121005/058). quake Engineering, Lisbon, Portugal, 2012.14 Advances in Civil Engineering
[17] A. Pourali, R. P. Dhakal, G. MacRae, and A. S. Tasligedik,
“Fully floating suspended ceiling system: experimental eval-
uation of structural feasibility and challenges,” Earthquake
Spectra, vol. 33, no. 4, pp. 1627–1654, 2017.
[18] Y. Lu, G. Mosqueda, Q. Han, and Y. Zhao, “Shaking table tests
examining seismic response of suspended ceilings attached to
large-span spatial structures,” Journal of Structural Engi-
neering, vol. 144, no. 9, Article ID 04018152, 2018.
[19] K. P. Ryu and A. M. Reinhorn, “Analytical study of large-area
suspended ceilings,” Journal of Earthquake Engineering,
vol. 23, no. 4, pp. 592–624, 2019.
[20] S.-C. Jun, C.-H. Lee, C.-J. Bae, and K.-J. Lee, “Shake-table
seismic performance evaluation of direct- and indirect-hung
suspended ceiling systems,” Journal of Earthquake Engi-
neering, pp. 1–19, 2020.
[21] A. Pourali, R. Dhakal, G. A. Macrae, and A. S. Tasligedic,
“Shake table tests of perimeter-fixed type suspended ceilings,”
in Proceedings of the 2015 NZSEE Conference, Rotorua, New
Zealand, April 2015.
[22] S. Soroushian, E. Rahmanishamsi, K. P. Ryu, M. Maragakis,
and A. M. Reinhorn, “Experimental fragility analysis of
suspension ceiling systems,” Earthquake Spectra, vol. 32,
no. 2, pp. 881–908, 2016.
[23] S. Soroushian, E. Rahmanishamsi, C. Jenkins, and
E. M. Maragakis, “Fragility analysis of suspended ceiling
systems in a full-scale experiment,” Journal of Structural
Engineering, vol. 145, no. 4, Article ID 04019005, 2019.
[24] J502-2-2012, Indoor Decoration: Suspended Ceiling Inside,
China Planning Press, Beijing, China, 2012.
[25] Standards Press of China, DGJ08-9-2013. Code for Seismic
Design of Buildings, Standards Press of China, Shanghai,
China, 2013.
[26] S. Soroushian, M. Maragakis, and C. Jenkins, “Axial capacity
evaluation for typical suspended ceiling joints,” Earthquake
Spectra, vol. 32, no. 1, pp. 547–565, 2016.
[27] H. J. Jiang, Y. Wang, and C. Wu, “Experimental study on the
axial behavior of grid joints and splices of suspended ceilings,”
Engineering Mechanics, 2021.
[28] GB 50010-2010, Code for Seismic Design of Buildings, Ar-
chitecture and Building Press, Beijing, China, 2016.
[29] ASCE/SEI 7-10, Minimum Design Loads and Associated
Criteria for Buildings and Other Structures, American Society
of Civil Engineers, Reston, VA, 2010.
[30] L. Qi, M. Kurata, Y. Ikeda, K. Kunitomo, and M. Takaoka,
“Seismic evaluation of two-elevation ceiling system by shake
table tests,” Earthquake Engineering & Structural Dynamics,
vol. 50, no. 4, pp. 1147–1166, 2020.
[31] Z. Luo, J. Xue, T. Zhou, L. Qi, and X. Zhao, “Shaking table
tests and seismic design suggestions for innovative suspended
ceiling systems with detachable metal panels,” Engineering
Structures, vol. 232, no. 10, Article ID 111830, 2021.You can also read