Original Article Deep-sea benthic habitats and the impacts of trawling on them in the offshore Greenland halibut fishery, Davis Strait, west Greenland
←
→
Page content transcription
If your browser does not render page correctly, please read the page content below
ICES Journal of Marine Science (2021), https://doi.org/10.1093/icesjms/fsab148
Downloaded from https://academic.oup.com/icesjms/advance-article/doi/10.1093/icesjms/fsab148/6357213 by guest on 20 September 2021
Original Article
Deep-sea benthic habitats and the impacts of trawling on them
in the offshore Greenland halibut fishery, Davis Strait, west
Greenland
Stephen Long ,,* , Martin E. Blicher , Nanette Hammeken Arboe , Mona Fuhrmann ,
Michael Darling , Kirsty M. Kemp , Rasmus Nygaard , Karl Zinglersen , and Chris Yesson
1
Department of Geography, University College London (UCL), London WC1E 6BT, United Kingdom
2
Institute of Zoology (IoZ), Zoological Society of London, London NW1 4RY, United Kingdom
3
Greenland Institute of Natural Resources, Nuuk 3900, Greenland
∗
Corresponding author: tel: +44 (0) 20 7449 6369; e-mail: stephen.long.16@ucl.ac.uk
Long, S., Blicher, M. E., Hammeken Arboe N., Fuhrmann, M., Darling, M., Kemp, K. M., Nygaard, R., Zinglersen, K., and Yesson, C. Deep-sea
benthic habitats and the impacts of trawling on them in the offshore Greenland halibut fishery, Davis Strait, west Greenland. – ICES Journal of
Marine Science, : –.
Received April ; revised May ; accepted July .
The offshore Greenland halibut (Reinhardtius hippoglossoides) fishery, west Greenland, employs demersal trawl gear at depths of – m.
In contrast to many deep-sea fisheries, the target stock appears stable and the fishery is of significant economic importance. Recent Marine
Stewardship Council certification of this fishery highlighted the paucity of knowledge of benthic habitats and trawling impacts, which this study
aimed to address using a towed benthic video sled. The spatially discrete northern and southern areas of the fishery were found to be distinct in
terms of the communities present, which non-metric multidimensional scaling suggests is primarily driven by temperature. Extensive physical
evidence of trawling was observed. Trawling effort was significantly linked with community composition, with a negative association between
trawling effort and abundance of some taxa, including some vulnerable marine ecosystem (VME) indicator species. Three potential VMEs are
identified: (i) Flabellum alabastrum cup coral meadows; (ii) a Halipteris finmarchica sea pen field; and (iii) areas exhibiting mixed assemblages
of VME indicators. Of immediate conservation concern is a H. finmarchica field, which seems to be at least regionally rare, is situated within the
fringes of existing trawling effort and is currently afforded no protection by management measures.
Keywords: Arctic, cup coral meadow, image analysis, sea pen field, vulnerable marine ecosystem
cially vulnerable marine ecosystems (VMEs) (FAO, 2009; Ramirez-
Introduction Llodra et al., 2010). Given that deep-sea fisheries contribute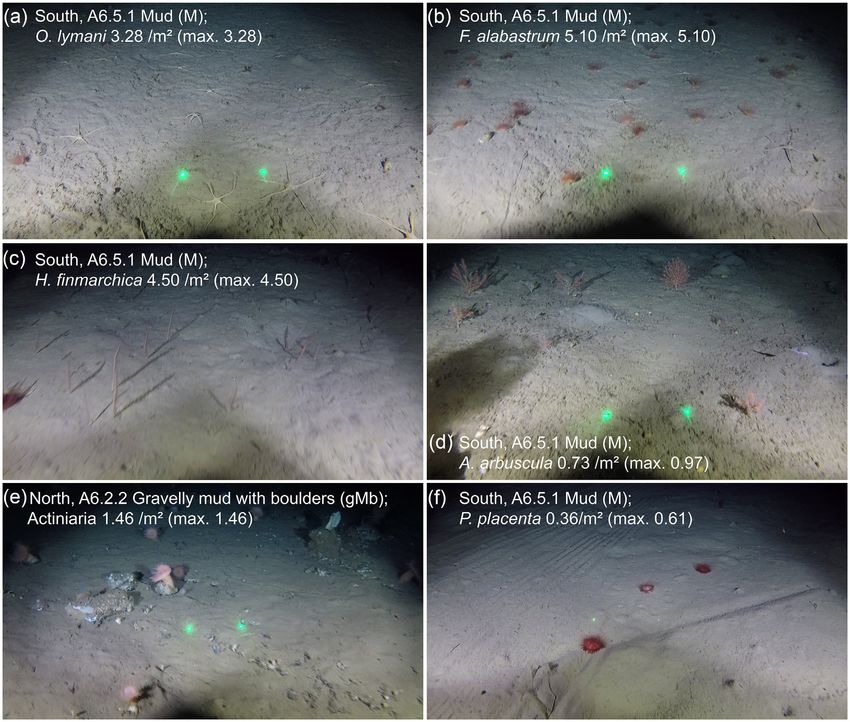
S. Long et al.
longer time-scales. Frequently, high initial catches have been fol- the Disko Fan Conservation Area (de Moura Neves et al., 2015a;
lowed by stock collapse, with numerous well-documented examples Hiltz et al., 2018). Whilst known aggregations of coral, sponge and
of this ‘boom and bust’ cycle in deep-seas (e.g. Sasaki, 1986; Clark, sea-pens support the prohibition on the use of bottom-contact gear
1999; Baker et al., 2009). in the Davis Strait Conservation Area further to the south (Kench-
Deep-sea fisheries predominantly employ demersal otter trawls, ington et al., 2016; Hiltz et al., 2018). A recent analysis of the North
in which the depth necessitates heavy gear with trawl doors weigh- Atlantic by Morato et al. (2021) using VME records and fishing ef-
ing 2–5 tonnes each and sometimes more (Roberts, 2002; Clark fort data identified the southern Davis Strait as an area where there
and Koslow, 2007; Clark et al., 2016). The ecosystem effects of is a high risk of serious adverse impacts on VMEs, with high con-
Downloaded from https://academic.oup.com/icesjms/advance-article/doi/10.1093/icesjms/fsab148/6357213 by guest on 20 September 2021
these gears have been likened to clear cutting of forests (Watling fidence in Canadian waters supported by good data (but low confi-
and Norse, 1998) and ploughing of agricultural land (Puig et al., dence and very limited data within the Greenlandic EEZ).
2012). The effects of trawl gear on the seabed include mixing of The offshore Greenland halibut (Reinhardtius hippoglossoides)
sediments; physical trawl scars or tracks; increased turbidity; dis- fishery in the Davis Strait, west Greenland (NAFO 1A-D, offshore),
placement of glacial dropstones or boulders; and seafloor homog- employs demersal trawl gear at depths of 800–1400 m. It is a rare
enization (Watling and Norse, 1998; Thrush and Dayton, 2002; exception among deep-sea fisheries, in terms of its stock stability
Pusceddu et al., 2014). Benthic faunal impacts include removal or and economic importance. Contrary to the typical ‘boom and bust’
in-situ mortality; smothering; displacement; and structural damage pattern, the fishery continues to be productive and the stock sta-
to biogenic habitat (e.g. cold-water coral reefs) (Koslow et al., 2000; ble (Jacobsen et al., 2018), despite a long history of exploitation. In
Gage et al., 2005; Hall-Spencer et al., 2007). The longevity of these 2017, Greenlandic vessels in the fishery obtained Marine Steward-
impacts is likely to be significant with recovery estimated to take ship Council (MSC) certification (Cappell et al., 2017), followed by
decades, centuries or even longer, particularly in the case of VMEs German in 2019 (Cook et al., 2019). The halibut fishery is of consid-
(Roberts, 2002). Accordingly, depth-based management measures erable importance to the Greenlandic economy. Greenland’s fish-
are increasingly being introduced, including in the northeast At- ing industry accounts for 80–95% of the country’s export income
lantic, the prohibition of demersal trawling below 800 m in all Eu- (Mortensen, 2014; The Economic Council, 2017; Jacobsen, 2018).
ropean Union waters (European Union, 2016). Despite recent ma- Some 30% of this fisheries’ export income is from halibut (inshore
jor advances in ecological research, including new and improving and offshore catches) making it the second most important stock
technologies for sampling in the deep-sea, we still lack the knowl- after coldwater prawns (The Economic Council, 2017).
edge to effectively manage extractive resource use (e.g. fisheries and Annual stock assessments, made by the North Atlantic Fisheries
mining) in these ecosystems (Danovaro et al., 2017). Fundamental Organisation (NAFO) using survey data, provide information on
challenges include the logistics of accessing deep-sea environments the stock status and trends in the offshore Greenland halibut fish-
and the sheer scale – the deep-sea (depths >200 m) accounts for ery. However, there is little understanding of the nature of benthic
more than 99% of the global ocean volume (Costello et al., 2010) habitats in this area of Greenlandic waters and of the fishery’s im-
and covers 65% of the planet’s surface (Danovaro et al., 2017). In pacts. Limited existing research has relied on bycatch data from
situ observations of deep-sea habitats often require costly research stock assessment surveys to assess the impacts on non-target fish
vessel time and expensive technologies to cope with the depth and (Jørgensen et al., 2014) and the distribution of corals and sponges
pressure. Accordingly, there is a paucity of knowledge in terms of (Jørgensen et al., 2013; Blicher and Hammeken Arboe, 2021). The
the nature and distribution of deep benthic habitats and their re- NAFO stock assessment notes that with regards benthic habitats
sponses to physical disturbance, particularly in comparison with there is: “no specific information available” and that “general impacts
shallower marine habitats. of bottom trawl gear on the ecosystem should be considered” (NAFO,
Deep-sea Greenlandic waters in the northwest Atlantic repre- 2019). Long and Jones (2020) critically assessed the governance of
sent one such knowledge gap. At present, Marine Protected Area this fishery and raised significant concerns about the robustness
(MPA) coverage in the 2.2 million km2 Exclusive Economic Zone of the MSC certification process, specifically with regards the as-
(EEZ) is ∼4.5%, comprised of exclusively in inshore waters (UNEP- sessment of benthic habitat impacts, which are poorly known. This
WCMC, 2019). There are no MPAs affording protection to known study aims to characterise the benthic habitats and make a prelim-
VMEs, although measures introduced by Executive Orders have inary assessment of the impacts of trawling in the west Greenland
prohibited the use of bottom-contact fishing gears in two areas offshore halibut fishery. This is achieved by sampling across a spec-
to protect VME indicator species. These are an ∼6.5 km2 area in trum of fishing effort, using a low-cost benthic video sled.
southwest Greenland associated with an observation of Desmophyl-
lum pertusum (Government of Greenland, 2017; Kenchington et
al., 2017) and 11 discrete areas in Melville Bay closed to demer-
sal trawling ‘based on significant observations of sea pens’ (Umbel- Methodology
lula sp). (Cappell et al., 2018; Government of Greenland, 2018). The The study area
limited spatial management measures to protect deep-sea ecosys- In west Greenland, a wide continental shelf extends upwards of
tems is principally due to a lack of knowledge about the nature 100 km from shore, beyond which the continental slope descends
and distribution of habitats and VMEs within the Greenlandic EEZ to depths >2000 m (Jørgensen et al., 2018). The Davis Strait acts
(Long et al., 2020), including in the Davis Strait where this study is as a bathymetric bottleneck between the deeper Labrador Sea and
focussed. In contrast, more comprehensive research has been un- Baffin Bay basins (Figure 1), forming a topographic barrier to cur-
dertaken on the Canadian side of the Davis Strait, using trawl sur- rents and water masses, thus shaping the hydrographic conditions
vey, fishery bycatch, and image data (e.g. Gass and Willison, 2005; (Tang et al., 2004; Cuny et al., 2005). The cold East Greenland Cur-
Wareham and Edinger, 2007; Kenchington et al., 2016), which has rent (EGC) and Warmer Irminger Current (IC) combine to form
informed management. Notable findings include an area of dense the West Greenland Current (WGC) flowing northwards over the
bamboo coral (Keratoisis sp.) forests at depth >900m (de Moura west Greenlandic shelf (Myers et al., 2007). Most of the warmer IC
Neves et al., 2015a), which has been closed to trawling as part of current water, constrained by the shallowing bathymetry, crosses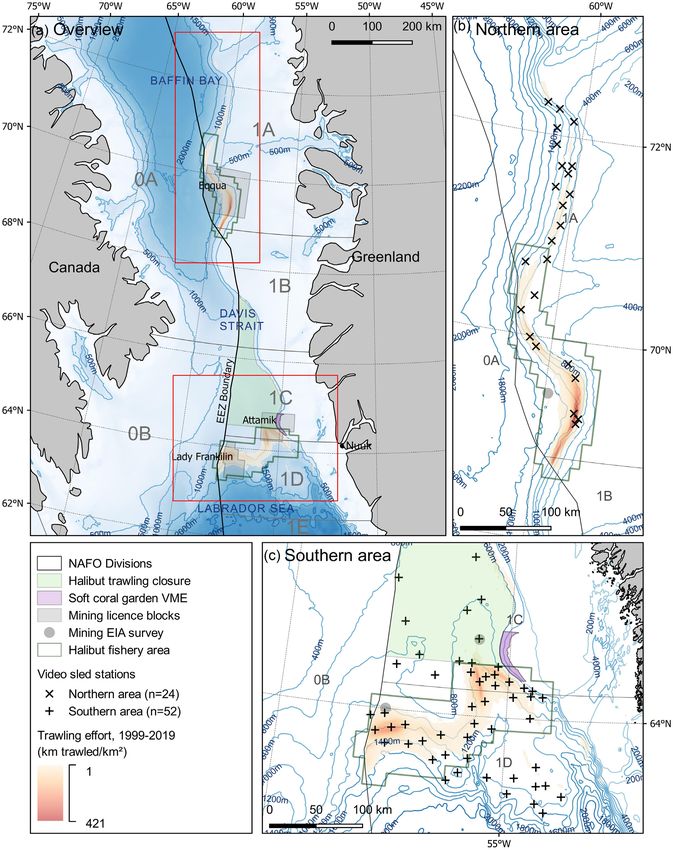
Deep-sea benthic habitats and the impacts of trawling on them in the offshore Greenland halibut fishery, Davis Strait, west Greenland
Downloaded from https://academic.oup.com/icesjms/advance-article/doi/10.1093/icesjms/fsab148/6357213 by guest on 20 September 2021
Figure 1. Map showing (a) the offshore Greenland halibut fishery, west Greenland; (b) the northern area of the fishery; and (c) the southern
area of the fishery. The position of video sled stations (n = ) is shown in (b) and (c). Bathymetric contours are drawn at m intervals in (a)
and m intervals in (b) and (c), using the IBCAO Version -m grid (Jakobsson et al., ). For clarity this bathymetric raster is included in
(a) but not (b) and (c). Halibut fishing activity is restricted to the halibut fishery area (polygon green outline), introduced in (MFHA, ).
Prior to this and at the time of the study, there were no spatial restrictions other than the halibut trawling closure (polygon light green fill). Oil
exploration licence blocks subject to EIAs are drawn and named, with the site of benthic surveys indicated. Trawling effort represented by a
km grid, is based on haul by haul logbook data from to , used to determine the distance trawled per unit area (km trawled/km2 ).
Longline effort is not represented.
S. Long et al.
the mouth of the Davis Strait and turns south flowing along the known as the West Greenland Offshore Greenland Halibut Fish-
Labrador coast (Hamilton and Wu, 2013; Yang et al., 2016). In Baffin ery (WGOGHF), was certified sustainable by the Marine Steward-
Bay, warm West Greenland Intermediate Water (WGIW) formed ship Council (MSC) (Cappell et al., 2017). This was followed by
from the WGC, is found from 300–800 m, below this temperature 2 German vessels forming the Doggerbank Seefischerei West
declines with depth in the cold water mass known as Baffin Bay Greenland Halibut Fishery, which was first MSC certified in 2019
Deep Water (BBDW). Since the sill depth of the Davis Strait is shal- (Cook et al., 2019). In March 2020, a scope extension was obtained
lower than 700m, this cold deep water does not have direct access for the WGOGHF MSC certificate, to incorporate a single long-
to the Labrador Sea to the south. Accordingly, there are significant line vessel (Chaudhury et al., 2020). Demersal trawling is prohibited
Downloaded from https://academic.oup.com/icesjms/advance-article/doi/10.1093/icesjms/fsab148/6357213 by guest on 20 September 2021
water differences between the southern Baffin Bay and the Labrador between 64◦ 30’N and 68◦ 00’N to protect juvenile halibut (MFHA,
Sea at the depth range of the halibut fishery. The southern area 2016) (Figure 1). The spatial distribution of trawling effort is shown
of the fishery experiences warmer bottom temperatures, whilst the in Figure 1. In 2021, subsequent to this study, a revised management
northern area is significantly colder. The Global Open Oceans and plan for the fishery, restricts halibut fishing to a defined area, which
Deep Seabed (GOODS) biogeographic classification system identi- encompasses the vast majority of prior trawling effort (Figure 1)
fies lower bathyal provinces (800 to 3000 m) globally. The two sep- (MFHA, 2021).
arate areas of the fishery fall into different provinces (southern area,
Northern North Atlantic province; northern area, Arctic province)
(Vierros et al., 2009).
There is some background information on the nature of the habi- Benthic video sled
tats in the study area (the fishery and adjacent areas within Green- Imagery was obtained using a towed benthic video sled, deployed
landic waters). Environmental Impact Assessments (EIAs) were semi-opportunistically from the RV Paamiut (PA), RV Sanna (SA),
undertaken for three spatially discrete mining exploration blocks, and MT Helga Maria (HM), during four stock assessment survey
which overlap the fishery (Figure 1) (BSL, 2011a, b, c). They also cruises undertaken by Greenland Institute of Natural Resources
provide the only existing seabed imagery (prior to this study), albeit (GINR), during the summer months of 2017 to 2019. In so far as
of limited quality and spatial extent. At present, there is no min- was possible, stations were selected to cover the depth range of the
ing, exploration, EIAs or pending applications within the fishery fishery, be evenly spatially distributed and sample across a spectrum
footprint. Across the whole fishery, the seafloor consists of uncon- of fishing effort, including untrawled areas. The sled was deployed
solidated sediments overlying soft clay (BSL, 2011a, b, c; Jørgens- at a total of 76 stations (52, southern area: 24, northern area), from
bye and Wegeberg, 2018). Icebergs deposit terrigenous sediments depths of 649 to 1476 m.
and dropstones (Gutt, 2002; Streuff et al., 2017), the latter provides The benthic video sled was equipped with an oblique angled cen-
sparse hard substrates on otherwise soft sediments. Trawling occurs trally mounted video camera, lights, scaling lasers (two green dots
on only the gently sloping areas of the continental slope, which per with 20 cm separation), temperature data logger (recording every
the EIAs, appear to have gradients of 2 tonnes) (Cappell et al., 2017). Nets are required to use
a minimum of 100 mm mesh in the wings and 140-mm mesh in
the cod-end (MFHA, 2016). Some vessels employ twin-rigged nets, Image processing
separated by a heavy roller clump or rolling shoe (Long and Jones, Image extraction
2020), the weight of this gear component is not specified, though in Still images were extracted for quantitative analysis from ‘useable
the shallower west Greenland prawn fishery these reportedly weigh segments’ of videos, where the sled was proceeding smoothly along
2-9 tonnes (Cappell and Powles, 2016). To date, there has been the bottom with a clear image. Stills were sampled every 15 seconds,
limited long-lining by Norwegian vessels (Jacobsen et al., 2018). In selecting the frame with the sharpest focus, following Long et al.
2017, the Greenlandic portion of the fleet, consisting of 6 vessels (2020).
Deep-sea benthic habitats and the impacts of trawling on them in the offshore Greenland halibut fishery, Davis Strait, west Greenland
Image annotation at the superimposed midline. The counts and estimated swept area
The images were uploaded to BioImage Indexing, Graphical La- were used to estimate densities.
belling and Exploration 2.0 (BIIGLE 2.0), which is a browser based
annotation platform (Ontrup et al., 2009; Langenkämper et al.,
2017). BIIGLE allows the annotation of images and/or features Fishing Effort
within images with labels from custom made hierarchical trees. A 1 × 1 km resolution grid of trawling effort was used, based on
Prior to commencing annotation, a representative subset of the haul-by-haul logbook data for halibut fishery trawls between 1999
images was reviewed by the team to agree on a consistent approach. and 2019 (data provided by Greenland Fishery Licence Control).
Downloaded from https://academic.oup.com/icesjms/advance-article/doi/10.1093/icesjms/fsab148/6357213 by guest on 20 September 2021
This was informed by previous collective experiences of image and The grid represents km trawled/km2 , bounded by 72.5◦ N and 62◦ N;
physical sampling surveys in west Greenland. To ensure consistency the 500 m depth cline; and the Greenlandic EEZ. A full description
a single author made all annotations of fauna and substrates. is provided by (Long et al., 2020).
Fauna annotation Station metadata
Benthic invertebrate fauna were initially annotated at the highest The sled position was inferred trigonometrically from the ship’s po-
taxonomic resolution and then aggregated to the Order level to sition, direction, water depth, and length of towing cable (Long et al.
achieve consistency within and between images. Only taxa where 2020). Seabed temperature values were based on a mean of all data
discrete individuals or discrete colonies (i.e. colonial organisms that logger readings taken between the start and end of the tow. A depth
form discrete unit e.g. a sea pen) could be identified were annotated, value was obtained as the mean of depths recorded at the start and
to allow density estimation. In practice, taxa 20 cm) were also counted. The estimated ‘swept area’ in the us- elling in the southern area of the fishery (n = 52), using the
able segments from each station was calculated based on the du- video count data. The video count data were normalised to the
ration of useable segments, mean speed and the width of the FOV mean ‘swept area’ of 433.6 m2 (standard deviation = 210.3) (i.e.
S. Long et al.
Table 1. Summary statistics at the station level.
Study area
North South ALL
Data collection
Number of stations
Number of images , ,
Downloaded from https://academic.oup.com/icesjms/advance-article/doi/10.1093/icesjms/fsab148/6357213 by guest on 20 September 2021
Area in images (m2 )
Number of fauna annotations
Annotations /m2 . . .
Depth (m)
Minimum
Maximum
Mean (± SD) () () ()
Temperature (åC)
Minimum . . .
Maximum . . .
Mean (± SD) . (.) . (.) . (.)
Substrate (% of images)
A.. Gravelly mud (gM) . . .
A.. Gravelly mud with boulders (gMb) . . .
A.. Mud (M) . . .
A.. Mud with boulders (Mb) . . .
Trawling evidence (% of images)
Minimum
Maximum
Median
Fishing effort (km trawled/km2 )
Minimum
Maximum
Median . . .
the counts for each station were adjusted to the mean area for all the following models were implemented: linear model (LM), Pois-
southern stations, according to the area imaged at that station). son general liner model (Poisson GLM), quasi-Poisson GLM and
Four potential explanatory variables were investigated: (i) depth; negative binomial GLM (NB GLM). For LMs, where appropriate,
(ii) bottom temperature; (iii) boulder occurrence; and (iv) ef- log-transformation was used to improve the normality of the re-
fort. Correlation between explanatory variables was assessed using sponse variable.
the Pearson correlation coefficient. Depth and temperature were Standard approaches to model validation and assessing the
strongly correlated (r = −0.67), so the latter was excluded as depth goodness of fit were employed. Specifically, this involved visually in-
is more readily interpreted from a management perspective. Re- specting plots of residuals versus fitted values and quantile-quantile
moving highly correlated variables reduces the risk of overfitting plots of randomized quantile residuals. Additionally, model valida-
models. The Pearson correlation coefficients for the remaining vari- tion and selection employed rootograms – a graphical tool orig-
ables used in the full model were |r| < 0.2. Transformations were inally developed by Tukey (1977) and extended by Kleiber and
used to improve normality of effort and boulder occurrence and Zeileis (2016). The R package ‘countreg’ (Zeileis and Kleiber, 2018)
address outliers, in order to avoid violating model assumptions was used to implement ‘hanging’ rootograms to identify underfit-
(Zuur et al., 2010). Effort (plus the minimum positive value of ef- ting or overfitting and compare models for goodness of fit. Valida-
fort) was log-transformed and boulder occurrence was square-root tion of LMs used: (i) the gvlma function of R package ‘gvlma’ (Slate
transformed. and Pena, 2019) to implement five tests of the validity of assump-
Full models were in the form normalised taxa count ∼ depth + tions (skewness, kurtosis, heteroscedascity, validity of link function
boulder prevalence + effort. The minimum adequate model (MAM) and a global validity of model) (Pena and Slate, 2006); and (ii) the
was identified by step-wise model simplification. Variables were ncvTest function of the R package ‘car’ (Fox et al., 2012) to test con-
considered significant where P < 0.05. The count data for some taxa stancy of error variance. Tests for overdispersion (in quasi-Poisson
was zero inflated and/or overdispersed, arising from large variation GLM and NB GLM models) and zero-inflation (in Poisson, quasi-
in the positive count data. Following Zuur et al. (2009), depending Poisson GLM and NB GLM models) were implemented using the
on the distribution of the count data and degree of zero-inflation, R package ‘performance’ (Lüdecke et al., 2020).Deep-sea benthic habitats and the impacts of trawling on them in the offshore Greenland halibut fishery, Davis Strait, west Greenland
Assessment of potential VMEs munity composition differed between the northern and southern
The United Nations General Assembly (UNGA) Resolution 61/105 area indicated by two distinct clusters in the nMDS ordination plot
called upon States to take action to protect VMEs (UNGA, 2006), (Figure 2). Temperature (envfit, p < 0.001), depth (envfit, p <
subsequently defined as meeting one or more of the following cri- 0.001), visual trawl evidence (envfit, p = 0.017), and the prevalence
teria: (i) unique or rare; (ii) functionally significant, (iii) fragile, of boulders (envfit, p < 0.001) were all significant (Figure 3). Com-
(iv) containing component species whose life-history traits make munity composition was not significantly related to fishing effort
recovery difficult; or (v) structurally complex (FAO, 2009). To op- extracted from the trawl raster layer (envfit, p = 0.180), though
erationalise this definition regional fisheries management organi- the direction of the fitted vector was similar to that of trawling evi-
Downloaded from https://academic.oup.com/icesjms/advance-article/doi/10.1093/icesjms/fsab148/6357213 by guest on 20 September 2021
sations (RFMOs) have developed regionally specific lists of VME dence. Temperature appears to be the primary environmental driver
indicator taxa and VME habitat types, though there are some incon- for the separation of the northern and southern sites, which occurs
sistencies between these (Bell et al., 2019; Long et al., 2020). The ex- along the temperature vector. The communities also varied between
tent to which the presence of one or more VME indicator taxa result stations, both within and between the two areas (Figure 4). Figure 5
in these criteria being met is density dependent, though at present provides some examples of communities observed.
there are no universally agreed thresholds or standards (Auster et
al., 2010). A further difficulty is determining when the spatial ex-
tent is sufficient to constitute an ecosystem, this latter problem ap- Taxa observations
pears to have received relatively little attention in the VME related A total of 13062 fauna observations were made in the images.
literature (Watling and Auster, Accepted). In this study, the ap- The density of fauna was greatest in the south where there were
proach taken is to review the data to identify instances where the 0.57 annotations/m2 across the image set, compared with just 0.15
observed density of taxa warrant consideration as evidence of a po- annotations/m2 in the north (Table 1). Fauna is notably sparser in
tential VME. Each case is considered in the discussion, with refer- the images from the northern area, both in terms of abundance and
ence to: the observed distribution and density of the taxa; the UN- diversity, with the majority of annotations being of Actiniaria, Spir-
FAO VME definition; RFMO guidance and the wider literature. For ularia and Sabellida. Of the 36 taxa, 34 were seen in the images from
clarity, the five VME definition criteria are italicised. the south and 21 were seen in the images from the north (Table 2).
The most abundant taxa were the brittlestar, Ophiomusa lymani and
the cup coral, Flabellum alabastrum, which were seen almost exclu-
Results sively in the south. There was only a single observation of O. lymani
in images from the northern area (Table 2), though this was not reg-
A total of 3504 images covering 28838 m2 were obtained from 76
istered in the video annotation (Table 3). Potentially, this is because
stations (Table 1). The depth range in the northern and southern
the nature of the rig means objects in the uppermost corners of an
stations was similar (Table 1). There was no overlap in the range of
image may not cross the horizontal midline of the video.
temperatures observed in the north and south, the mean tempera-
A total of 37088 observations of selected taxa were made in
ture in the north (0.7åC) being colder than in the south (3.6åC). The
the videos (Table 3). Three taxa, O. lymani, F. alabastrum and
dominant substrate throughout the study area was EUNIS substrate
Halipteris finmarchica, exhibited a density greater than one individ-
class A6.5 Deep-sea mud found in 94.8% of images (Table 1). Lim-
ual or colony per m2 at some stations (Table 3). Locally even higher
ited hard substrates were available in the form of gravelly mud and
densities of these taxa were seen within individual images, see ex-
occasional boulders, the latter being more prevalent in stations ad-
amples in Figure 5a–c.
jacent to the continental slope in the southern portion of the study
area (Supplementary Material Figure 17).
VME indicator taxa
A total of 14 VME indictor taxa (as recognised by either, the NAFO,
Trawl evidence or NEAFC guidance) were identified in the imagery across the study
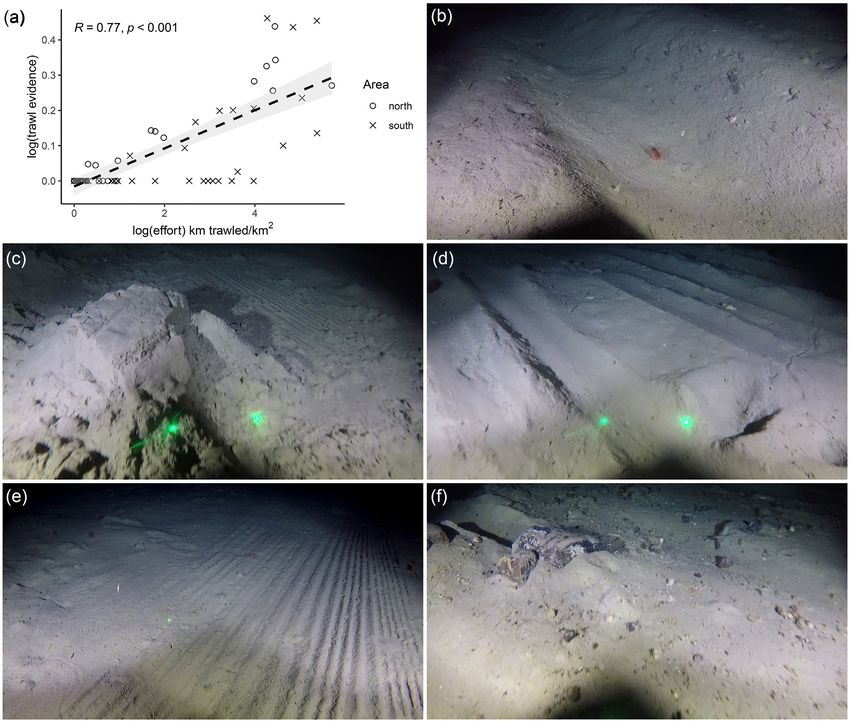
Evidence of trawling impact on the seabed was observed in the im- area. Of these, 14 were present in the south and 9 of were present in
ages (Figure 2). The variety of impacts observed being the product the north (Tables 2 and 3). Maps of the observed densities of those
of the interaction of the seabed substrate with different components 11 VME indicator taxa counted in the videos are provided (Supple-
of trawling gear. These included: large, deep single furrows or scars, mentary Material). The prevailing trend is that the highest densi-
thought to be caused by trawl doors (Figure 2b); overturned sedi- ties of VME indicator species were seen outside of the trawled area.
ments (Figure 2c); parallel grooves, caused by bobbins or rollers on However, for many of the VME indicator taxa, there were too few
rock hopper gear (Figure 2d); small regular grooves, perhaps from observations of these sparsely distributed fauna to support taxa spe-
the bottom of the net, cod-end or roller clump (Fig 2e); and dis- cific modelling.
placed, dragged or overturned rocks (Figure 2f). There was a strong The VME indicator taxa were generally observed at low abun-
correlation between the trawling evidence observed in images and dance. The presence of VME indicator taxa at low densities, indi-
the logbook fishing effort data (Figure 2a). The maximum level of vidually or collectively, does not constitute a VME (Auster et al.,
trawling intensity observed at northern and southern stations was 2010; Morato et al., 2018; Watling and Auster, 2020). There were no
broadly similar, both in terms of the evidence observed in the im- instances in the northern area where, in the opinion of the authors,
agery and logbook fishing effort data (Table 1). the individual or collective density of VME indicators was notable.
Only F. alabastrum and H. finmarchica were observed individually
at significant densities at some stations in the southern area. F. al-
Community composition abastrum were present at the majority of southern stations, 44 of 52
For the purposes of this study by ‘community’, we refer to the as- stations (Table 3), though typically at low abundance (Figure 6a).
semblage of different taxa quantified in the imagery. The com- At the station level, a maximum density of 4.64 F. alabastrum/m2 S. Long et al.
Downloaded from https://academic.oup.com/icesjms/advance-article/doi/10.1093/icesjms/fsab148/6357213 by guest on 20 September 2021
Figure 2. Panel (a) Relationship between the proportion of images observed with trawl evidence and effort at video sled stations. Where, effort
is determined by sampling along the sled path from a raster derived from logbook trawling effort data from - (see, . Mapping and
. Station metadata). Panels (b)–(f) Examples of the range of physical evidence of trawling observed in images. Where present, laser dots
(green) are cm apart.
was seen, which was higher in individual images with a maximum Taxa abundance models
of 5.10 individuals/m2 . Conversely, H. finmarchica was absent from The nature of the video count data (high variance, zero inflation and
the majority of stations, being recorded at just nine. A maximum of small sample size) meant that models could only be implemented
3.47 H. finmarchica/m2 were observed at the station level with the and validated for a limited set of taxa (Table 4). Depth, boulder
maximum within an image being 4.50 individuals/m2 . Two stations, prevalence and fishing effort were found to have significant associ-
at the edge of but within the existing fishing effort footprint, con- ations with the abundance of some taxa (Table 4). Notably, fishing
tained 95% of the H. finmarchica observations with both stations effort was significantly negatively associated with the abundance of
exhibiting densities >1 colony/m2 ) (Figure 6b). Acanella arbuscula, Large Porifera and Other VME indicator taxa.
Excluding, F. alabastrum and H. finmarchica which were both lo- Pennatulacea were typically absent at the majority of stations but lo-
cally highly abundant, Figure 6c, presents the abundance of all other cally abundant (Table 3 and Supplementary Material Figures 9–12).
VME taxa counted in the videos. This identifies a cluster of stations This meant Pennatulacea could not be modelled individually and
in the southeast of the study area where the mixed assemblage of were not included in the Other VME indicator taxa model, as this
VME indicators is at a density greater than seen across the rest of resulted in a highly skewed distribution, unsuitable for the mod-
the study area. elling approaches employed.Deep-sea benthic habitats and the impacts of trawling on them in the offshore Greenland halibut fishery, Davis Strait, west Greenland
Area of fishery
1.5
2D stress 0.191
Northern
Southern
1.0
Suberitida
1200
Sabellida
Downloaded from https://academic.oup.com/icesjms/advance-article/doi/10.1093/icesjms/fsab148/6357213 by guest on 20 September 2021
Depth
0.5
Trawl
Effort evidence
Echinothurioida 0
Scleractinia Pennatulacea 90
Elasipodida Euryalida 850
Antipatharia
0.0
1150 Spirularia
NMDS2
Ophiurida Phlebobranchia
1100
11 Gastropoda 800
Polymastiida Actiniaria
1050
1
Asteroidea indet.
Lyssacinosida
1000
00
00
750
−0.5
Alcyoncea
Corallimorpharia
Temperature Velatida
950
Spatangoida
Boulders Small Porifera
Large Porifera Valvatida
Forcipulatida
−1.0
950 Spinulosida
Paxillosida
% of images with trawling evidence
−1.5
Camarodonta
0% 60% Comatulida
−2.5 −2.0 −1.5 −1.0 −0.5 0.0 0.5 1.0 1.5 2.0
NMDS1
Figure 3. NMDS ordination of the benthic fauna assemblage observed in video sled images. Stations (filled circles, n = ), from the northern
(yellow, n = ) and southern (blue, n = ) areas are scaled by trawling evidence observed at each station. Fitted vectors of environmental
variables are drawn in red (envfit, p < .) and green (envfit, p > .), offset from the origin for clarity. Effort is trawling effort inferred from
logbook data. Trawl evidence is the proportion of images from each station in which trawling evidence was observed. Boulders is the
proportion of images at each station in which boulders were present. Depth fitted as a smooth surface, is indicated by m contours (grey).
Discussion concurs with these two deep-sea areas being assigned to separate
Communities biogeographic provinces within the GOODS classification system
The taxa observed were consistent with those previously reported (Vierros et al., 2009). These insights provide new site-specific de-
in adjacent Canadian waters of the Davis Strait (Wareham and scriptions of the benthic communities in the halibut fishery ad-
Edinger, 2007; Kenchington et al., 2016), with no taxa being identi- dressing the knowledge gap identified by NAFO and highlighted
fied in the imagery that had not previously been reported from this by the pan North Atlantic analysis of Morato et al. (2021).
region. We did not observe any Keratoisis spp., despite the proximity These two areas are physically separated by the shallowing
of the northern portion of the study area to the Disko Fan Conser- bathymetry of the Davis Strait, which separates the warmer mater
vation Area from which dense Keratoisis spp. forest have previously masses to the south from those in the north (Tang et al., 2004; Cuny
been reported (de Moura Neves et al., 2015a). Despite the homo- et al., 2005). Accordingly and as observed in this study, the mean
geneity of substrates, the communities observed differed consid- temperature in the northern area (0.7åC) is much colder than in the
erably both within and between the northern and southern areas. southern area (3.6åC). Results from the NMDS suggest that tem-
The northern and southern areas exhibited different communities perature is a significant factor driving differentiation of these com-
in terms of the composition, abundance and diversity. In general a munities. As expected from fundamental ecological understanding
greater abundance and diversity of fauna was observed in the south, (e.g. Roberts et al., 2009; Ramirez-Llodra et al., 2010), other envi-
including VME indicators. In the previous EIAs, NMDS of commu- ronmental variables, specifically depth and the availability of hard
nity data obtained by grab sampling, also showed clear differentia- substrates in the form of boulders were also significantly associated
tion between the community in the Eqqua block (northern area) community composition. This was shown by both the NMDS ordi-
and the Lady Franklin and Atammik blocks (southern area) (BSL, nation plot and the taxa-specific modelling.
2011b), which concurs with the findings here. The available evi- The most abundant species found in the study were the brit-
dence suggests that both the in- and epi-faunal communities are tlestar O. lymani, and the solitary cup coral F. alabastrum, both
different in these two spatially separate areas of the fishery. This widely distributed in the southern stations and absent from the S. Long et al.
Downloaded from https://academic.oup.com/icesjms/advance-article/doi/10.1093/icesjms/fsab148/6357213 by guest on 20 September 2021
Figure 4. Community composition by station from image annotation data. Classes containing VME indicator taxa are presented at the Order
level, all other taxa are aggregated to the Class level.
northern ones. The EIA conducted in the southern area (Lady (BSL, 2011c). The absence of these taxa from the northern may be
Franklin and Atammik blocks) also reported that these were the explained by environmental drivers identified in this study, given
most abundant taxa, reporting similar densities (1 O. lymani/m2 the marked difference, temperature would be a strong candidate.
and 3-4 F. alabastrum/m2 ), to those observed in this study For example, a study by Baker et al. (2012) extended the knownDeep-sea benthic habitats and the impacts of trawling on them in the offshore Greenland halibut fishery, Davis Strait, west Greenland
Downloaded from https://academic.oup.com/icesjms/advance-article/doi/10.1093/icesjms/fsab148/6357213 by guest on 20 September 2021
Figure 5. Example images of different communities seen in the imagery. The area from which the image was obtained is indicated along with
the substrate type. The density of dominant or notable taxa in each image is shown, followed, in parentheses, by the maximum density
observed in any image for reference. Note, the presence of physical evidence of trawling in panel f).
lower temperature boundary for F. albastrum to 3.7åC, which over- EIA, though there is insufficient information available to resolve
laps with conditions in the southern but not northern area in this this. Taxonomic uncertainty aside, the comparatively high densi-
study. However, other processes and drivers may be at work. ties of tube-dwelling anemones may play an important ecological
In comparison to the southern area, the abundance and diversity role in terms of sediment dynamics, bioturbation, and nutrient cy-
of fauna in imagery from the northern area was notably sparse. The cling in these impoverished communities. Indeed, it is for these rea-
previous EIA in this northern area also reported finding an impov- sons that tube-dwelling anemones have been suggested as potential
erished community both in terms of richness and abundance and VME indicator taxa (NAFO, 2012; NEAFC, 2014). This taxon and
noted this depauperate community was “unlike any other recorded its response to trawling disturbance may therefore warrant further
within the western Greenland area” (BSL, 2011b). Within the impov- investigation in this northern area.
erished communities of the northern area the majority of fauna ob-
servations were from just three taxa Actiniaria, Sabellida and Spir-
ularia. The latter appeared to be solely comprised of a single taxon Vulnerable marine ecosystems
of tube dwelling anemone (cf. Cerianthidae), though this may be The opinion of the authors’ is that there are three instances where
a sampling bias. This taxon was also present in the south, though the observed density of taxa warrant consideration as evidence of a
at lower densities. The translucent nature of this taxon and its re- potential VME.
traction in response to disturbance means that it was not selected
for video fauna counts and observations in the images likely result
in an underestimate of density. It was previously reported that the Flabellum alabastrum(cup coral) meadows
most dominant non-worm in-faunal taxon in this northern area Soft-bottom cup coral meadows featuring Flabellidae are specifi-
was a burrowing anemone (Edwardsia sp.) (BSL, 2011b). Obser- cally recognised as a VME habitat type and indicator species by
vations here of a tube-dwelling anemone (Order: Spirularia), may NEAFC (NEAFC, 2014) but conversely not by NAFO (NAFO,
refer to the same taxon as that identified as Edwardsia sp. in the 2012). A previous study using species distribution modelling has
Table 2. Data derived from annotating images, showing the presence at stations, number of observations, and maximum observed densities at the Order level for annotated fauna ( distinct
taxa). Sub-Order level detail is provided where: individual taxa were highly abundant; to draw distinction between taxa within an Order that were predominantly found in one area; annotations
were of a single taxa within an Order; and/or for VME indicator taxa. For each taxon, guidance from NAFO () and NEAFC () was consulted to determine if the taxon is considered a VME
indicator. The maximum observed density area column reports the area (‘S’, southern area; ‘N’, northern) in which the station with the observed maximum density is found.
Maximum observed density
Phylum VME Indicator? Number of stations present at Number of observations (taxa/m2 )
North South All Image Station
Class Order Taxa NAFO NEAFC (n = 24) (n = 52) (n = 76) North South All level level Area
Porifera
Hexactinellida Lyssacinosida Asconema foliatum Yes Yes . . S
Demospongiae Polymastiida Polymastiidae Yes Yes . . N
Suberitida Stylocordyla borealis No No . . N
Size classes Other small cm < Porifera ≤ cm Noa Noa . . S
Other large Porifera > cm Yesa Yesa . . N
Cnidaria
Anthozoa Actiniaria No No . . N
Alcyonacea Acanella arbuscula Yes Yes . . S
Alcyoniidae No No . . S
Nephtheidae No Yes . . S
Paramuricea sp. Yes Yes . . S
All Alcyonacea Some Some . . S
Antipatharia Stauropathes arctica Yes Yes . . S
Spirularia ?†b Yes . . N
Corallimorpharia Corallimorpharia No No . . S
Pennatulacea Anthoptilum grandiflorum Yes Yes . . S
Halipteris finmarchica Yes Yes . . S
Pennatula spp. Yes Yes . . N
Umbellula sp. Yes Yes . . N
All Pennatulacea Yes Yes . . S
Sceleractinia Flabellum alabastrum No Yes . . S
S. Long et al.
Downloaded from https://academic.oup.com/icesjms/advance-article/doi/10.1093/icesjms/fsab148/6357213 by guest on 20 September 2021Table 2. Continued
Maximum observed density
Phylum VME Indicator? Number of stations present at Number of observations (taxa/m2 )
North South All Image Station
Class Order Taxa NAFO NEAFC (n = 24) (n = 52) (n = 76) North South All level level Area
Echinodermata
Asteroidea Valvatida No No . . N
Spinulosida No No . . S
Paxillosida No No . . S
Velatida No No . . S
Forcipulatida No No . . S
Indet. No No . . S
c
Crinoidea Comatulida Yes . . S
Echinoidea Echinothurioida Phormosoma placenta No No . . S
Spatangoida No No . . S
Camarodonta No No . . S
Holothuroidea Elasipodida No No . . S
Ophiuroidea Ophiurida Ophiopleura borealis No No . . N
Ophiomusa lymani No No . . S
Indet. spp. No No . . N
All Ophiurida No No . . S
Euryalida No No . . S
Annelida
Polychaeta Sabellida No No . . N
Chordata
Ascidiacea Phlebobranchia No No . . S
Mollusca
Gastropoda Indet. No No . . S
a
Inferred based on taxa listed as VME indicator species.
b
Tube dwelling anemones (Order: Spirularia) are included in NAFO VME indicators guidance but only Pachycerianthus borealis specifically is listed there.
c
Crinoids (Order: Comatulida) are included in NAFO VME indicators guidance but only Trichometra cubensis specifically is listed there.
Deep-sea benthic habitats and the impacts of trawling on them in the offshore Greenland halibut fishery, Davis Strait, west Greenland
Downloaded from https://academic.oup.com/icesjms/advance-article/doi/10.1093/icesjms/fsab148/6357213 by guest on 20 September 2021
Table 3. Data derived from count observations in videos, showing the presence at stations, number of observations and maximum observed densities for selected taxa. Selected taxa were VME
indicators (and abundant non-VME indicator taxa for comparative purposes) that could be consistently identified across the video imagery. For each taxon, guidance from NAFO () and NEAFC
() was consulted to determine if the taxon is considered a VME indicator. The maximum observed density area column reports the area (‘S’, southern area; ‘N’, northern) in which the station
with the observed maximum density is found.
Maximum observed
Phylum VME Indicator? Number of stations present at Number of observations density (taxa/m2 )
At the
North (n South (n All (n = station
Class Order Taxa NAFO NEAFC = 24) = 52) 76) North South All level Area
Porifera
Demospongiae Polymastiida Polymastiidae Yes Yes . N
Large All Porifera > cm Yesa Yesa . S
Cnidaria
Alcyonacea Acanella arbuscula Yes Yes . S
Nephtheidae No Yes . N
Paramuricea sp. Yes Yes . S
Antipatharia Stauropathes arctica Yes Yes . S
Pennatulacea Anthoptilum grandiflorum Yes Yes . S
Halipteris finmarchica Yes Yes . S
Pennatula spp. Yes Yes . N
Umbellula sp. Yes Yes . N
Sceleractinia Flabellum alabastrum No Yes . S
Echinodermata
Echinoidea Echinothurioida Phormosoma placenta No No . S
Ophiuroidea Ophiurida Ophiopleura borealis No No . N
Ophiomusa lymani No No . S
a
Inferred based on taxa listed as VME indicator species.
S. Long et al.
Downloaded from https://academic.oup.com/icesjms/advance-article/doi/10.1093/icesjms/fsab148/6357213 by guest on 20 September 2021Deep-sea benthic habitats and the impacts of trawling on them in the offshore Greenland halibut fishery, Davis Strait, west Greenland
Downloaded from https://academic.oup.com/icesjms/advance-article/doi/10.1093/icesjms/fsab148/6357213 by guest on 20 September 2021
Figure 6. Map showing the density (individuals or colonies /m ) at stations in the southern area (n = ) for: (a) F. alabastrum; (b) H.
finmarchica; and (c) all VME indicators (excluding F. alabastrum and H. finmarchica). The EEZ is drawn (solid black line). S. Long et al.
Table 4. Summary of abundance models, using normalised video count data. The model type, estimated regression parameters, standard errors,
test statistics, and pass rate of validation tests are reported.
Taxa Model type Variable Estimate Std. error Significance Tests
F. alabastrum
Lineara Intercept . . /
Depth − . . (F, = ., p = .)
Boulder − . . (F, = ., p < .)
Downloaded from https://academic.oup.com/icesjms/advance-article/doi/10.1093/icesjms/fsab148/6357213 by guest on 20 September 2021
A. arbuscula
Lineara Intercept . . /
Boulder . . (F, = ., p < .)
Effort − . . (F, = ., p < .)
Large Porifera (> cm)
Lineara Intercept . . /
Boulder . . (F, = ., p < .)
Effort − . . (F, = ., p = .)
Other VME taxab
NB GLM Intercept − . . /
Boulder . . (X2 = ., df = , p < .)
Effort − . . (X2 = ., df = , p = .)
a
Response variable log transformed.
b
All other NAFO VME indicator taxa, this excludes those modelled individually above and all Pennatulacea. Thus, Other VME taxa consists of
the combined abundance of Nephtheidae, Paramuricea sp., Stauropathes arctica, and Polymastiidae.
identified the potential for F. alabastrum meadow VMEs to be cup corals on mixed substrates at depths of 1069-1769 m). In this
present in this area (Jørgensbye, 2017). study, multiple stations in the southern area, both inside and out-
There is no evidence that these cup coral meadows meets the side of the fishery footprint, exceed this threshold; 31 stations
unique or rare criteria. Within the southern portion of the study have a density >0.1/m2 , whilst 8 have a density >0.9/m2 . The ob-
area these were widespread and abundant, similarly there are nu- served maximum density at the station level (4.64 individuals/m2 ;
merous records across the region (e.g. Wareham and Edinger, 2007) Table 3) being an order of magnitude greater than the upper value
and North Atlantic (ICES, 2020). It is difficult to infer the functional of this threshold. The available evidence suggests that the cup coral
significance of F. alabastrum from the imagery (i.e. the image reso- habitat observed here is a strong candidate for a VME. The habitat
lution does not permit close inspection of individuals) and there is meets at least one of the VME criteria, has a considerable spatial
limited available information in the literature. extent and the densities observed are comparable to what is consid-
In terms of fragility, F. alabastrum are clearly present within the ered a cup coral VME elsewhere.
fishery footprint, including in the areas of most intense effort and
are seen in images that show trawling evidence. Modelling does not
provide any evidence that fishing effort has a significant negative Halipteris finmarchica(sea pen) field
relationship with abundance. Nevertheless, it should be noted that Sea pen fields and H. finmarchica are recognised as VME habitats
the highest densities are only observed outside of existing fishing ef- and indicator species by both NAFO and NEAFC (NAFO, 2012;
fort. The skeleton is somewhat fragile, and individuals are at risk of NEAFC, 2014). H. finmarchica was only seen at densities that could
burial or being impacted by sediment suspended by bottom trawl- be described as a ‘sea pen field’ at two stations in the southwestern
ing. In some images this species was seen to have aggregated in trawl corner of the study area, where the maximum station level density
scars, the driver of this is not known. F. alabastrum have been ob- was 3.47 colonies/m2 . Occasional H. finmarchica individuals were
served to move slowly, it has been suggested that this movement is seen at seven other southern stations and it was absent in the north.
facilitated by expanding the poly volume to increase buoyancy and Thus, this species can be described as locally rare, with fields be-
drag (Buhl-Mortensen et al., 2007). Potentially, trawl scars repre- ing rarer still. Blicher and Hammeken Arboe (2021) report H. fin-
sent a barrier to this semi-passive movement in an otherwise largely marchica bycatch records from a confined area in the Davis Strait
flat environment. sill region between 65◦ N and 66◦ N at depths of 600-800 m. There
F. alabastrum do exhibit life-history traits that make recovery dif- are a limited number of observations of H. finmarchica in the Cana-
ficult: growth rates are slow ∼1-5mm/year; they are reasonably long dian waters adjacent to the study area (Wareham and Edinger, 2007;
lived (at least 45 years) (Hamel et al., 2010); and fecundity is posi- Beazley et al., 2016), though these are sparse and densities are not
tively correlated with size (Waller and Tyler, 2011). They were typ- provided. The apparent rarity of H. finmarchica fields in this region
ically observed on flat muddy sediments devoid of other features, of the NW Atlantic suggests the observations presented here may
modelling showed a significant negative relationship with boulders. meet the uniqueness or rarity criteria of the VME definition.
In this context, at the densities observed, it could be argued that It is difficult to infer the functional significance of these H. fin-
their presence makes a significant contribution to the structural marchica fields from imagery. Nevertheless, there were numerous
complexity of the benthic environment. examples where Gorgonocephalus brittlestars (Class: Ophiuroidea)
There is no commonly agreed density threshold for what consti- were seen wrapped around this sea pen in the video footage.
tutes a cup coral meadow VME. In the NE Atlantic, Lea-Anne and Wareham and Edinger (2007) have observed commensal sea
Roberts (2014) propose a threshold of 0.1–0.9 /m2 (for Caryophyllia anemones Stephanauge nexilis firmly attached to the rachis, whilstDeep-sea benthic habitats and the impacts of trawling on them in the offshore Greenland halibut fishery, Davis Strait, west Greenland
Baillon et al. (2014) found six species on H. finmarchica specimens Areas exhibiting high combined density of corals, sea
of which five were close associates or symbionts. H. finmarchica is pens and sponges
also known to provide nursery habitats for larval fish (Baillon et al., Coral, sponge and sea-pen VME indicators species were observed
2012). Sea pens more generally are known to be a food source for a in mixed assemblages at some stations. Figure 6c shows there to
range of invertebrate predators (Birkeland, 1974; Krieger and Wing, be a cluster of stations in the south east corner of the study area
2002). The two stations with a high density of H. finmarchica were that consistently have higher collective densities of VME indicator
found on otherwise homogenous muddy sediments, contributing species (excluding F. alabastrum and H. finmarchica). There is also
significantly to the structural complexity of the habitat.
Downloaded from https://academic.oup.com/icesjms/advance-article/doi/10.1093/icesjms/fsab148/6357213 by guest on 20 September 2021
a smaller cluster on the bottom of the continental slope, between
A thin, erect, sea pen reaching lengths of 140 cm (Murillo et the 500 and 1000 m contours, to the south of the soft coral garden
al., 2018), is likely to physically interact with trawl gear. Bycatch VME. Both these clusters of stations exhibit a higher diversity of
observations in stock assessment trawls suggest it can be removed taxa than generally seen elsewhere.
by trawling (Blicher and Hammeken Arboe, 2021). Malecha and VME indicator species as recognized by both NEAFC and NAFO
Stone (2009) showed that trawling induced breakage of H. wille- contributing to this higher collective density include: A. arbuscula,
moesi made them more susceptible to predation. Further, they re- large Porifera (>10 cm), Paramuricea sp., Pennatula spp., Polymas-
ported that although dislodged sea pens were able to rebury in the tiidae, and Stauropathes arctica. These areas are associated with
sediment, they subsequently became dislodged even without fur- some of the higher densities of boulders (Supplementary Material
ther contact. The slow growth and longevity (>20 years) of this Figure 17). This may partially explain the higher densities observed
species means recovery from damage is likely to be at decadal scales as some of these indicator species are dependent upon rocky sub-
(de Moura Neves et al., 2015b; Murillo et al., 2018). The effect of strate for attachment. Previously, Jørgensen et al. (2013) used by-
trawling on abundance could not be modelled but all observations catch data from stock assessment trawls to identify an area with
are outside of the areas of highest trawling intensity. However, the a relatively high diversity and high density of corals at depths of
two stations with the greatest density of H. finmarchica are within 1000–1500 m from 63◦ N to 64◦ N and 54◦ W to 56◦ W, which aligns
the fishery footprint, albeit in an area of lower intensity trawling, with the findings here. A more recent analysis of bycatch data con-
despite the evidence of their vulnerability in the wider literature. firms the presence of this mixed assemblage, highlighting that this
This may highlight limitations in the study arising from the spatio- area yielded the largest bycatch records for Ostur sponges in West
temporal resolution of the fishing effort data. First, the accuracy of Greenland, represented by Geodiidae, Ancorinidae, and Theneidae
logbook positioning data, combined with the rasterization process (Blicher and Hammeken Arboe, 2021).
makes it difficult to be certain whether a specific sampling locality There are no commonly agreed density thresholds for mixed as-
within low-intensity areas has been trawled or not. In other words, semblages. The maximum density observed is 0.65 individuals/m2 ,
the path of the sled may not overlap with the path of trawl gear which is notable, especially in relation to the background abun-
within the 1 km fishing effort raster cells that have only been sub- dance across the study area. Furthermore, this excludes the VME
ject to limited effort. A further limitation is that there is no tem- indicators F. alabastrum and H. finmarchica, which are also present
poral component to the fishing effort raster used, which combines in these stations. There is no evidence to suggest that this mixed
logbook data from 1999 to 2019. In the case of the high density assemblage is especially unique or rare. However, it can reasonably
H. finmarchica observations, examination of the underlying log- be assumed that collectively the species present at the densities ob-
book records suggests that this area has not been trawled for over served meet the remaining four criteria in the VME definition.
10 years. These limitations are less significant at the macro-level
but present challenges when considering the high density H. fin-
marchica observations at just two stations. It may be the case that
these observations: (a) are from untrawled patches of seabed within Management implications
an area of low trawling intensity; (b) represent a population in re- Trawling has had extensive physical effects on the seafloor, which
covery following earlier trawling; or (c) indicate a degree of re- was also noted in the limited video imagery obtained during the
silience to trawling disturbance. The latter seems unlikely given the EIAs in southern area (BSL, 2011c, a). Imagery was not obtained
evidence of fragility elsewhere in the literature. from the EIA in the northern area (BSL, 2011b). The physical ev-
There is no commonly agreed density threshold for what con- idence of trawling in images was strongly correlated with fishing
stitutes a sea pen field and the authors are not aware of any pub- effort derived from logbooks. It can therefore be assumed that the
lished accounts of H. finmarchica fields with densities of colonies fishery’s footprint as represented by the effort raster gives a good
reported. However, in comparing the imagery from this study with indication of the spatial extent of seabed modification by physical
other available imagery (Fuller et al., 2008), we note that the den- disturbance. The WGOGHF MSC assessment reports that the total
sity at the two stations is comparable. The highest densities of An- area trawled by the Greenlandic halibut fleet in a three year period
thoptilum grandiflorum (0.08 colonies/m2 ) were also observed co- was 14963 km2 (Cappell et al., 2017). It should be acknowledged
occurring at these two stations, though it was widespread and at that the area imaged is very small, relative to the fishery footprint.
lower densities elsewhere (Supplementary Material Figure 9). The 76 stations are distributed across a significantly larger area, as
The imagery from these two adjacent stations provide strong ev- the study was designed to provide insights into both areas within
idence of a potential VME, meeting some if not all of the five VME the fishery and those that have not been subject to trawling. Con-
criteria. What is not clear is the likely spatial extent of the sea pens sequently, only limited inferences can be made about the nature of
fields observed. Clearly, the habitat is absent immediately to the the benthic habitats between the stations, not least because of the
north, where three stations were undertaken in areas subjected to a observed heterogeneity within and between areas.
high intensity of fishing effort. Further work should seek to deter- The benthic communities in northern and southern areas of the
mine whether the habitat is continuous between these two stations fishery are different and within these two discrete areas there is con-
and extends further to the south, where no trawling has occurred. siderable heterogeneity. This may have important implications forYou can also read