One-Asia Morning Focus - May 14, 2020
←
→
Page content transcription
If your browser does not render page correctly, please read the page content below
May 14, 2020

One-Asia Morning Focus
 Top story: Samsung Electronics (005930 KS/Buy/TP: W68,000)
 - For 2021, we forecast SEC’s foundry capex at W9.2tr or higher, which we estimate will translate into a roughly
   W40tr boost to the company’s value.
 - We believe SEC’s conservative DRAM investments will help keep DRAM prices steady.
 - In NAND, we believe SEC will continue to execute massive capex and enjoy a dominant earnings share.

 Today’s reports
 Asia Strategy – Buy the two worst performing markets: Indonesia and India
 YG Entertainment (122870 KQ/Trading Buy/TP: W36,000) Downgrade rating/Lower TP – Concerts halted
 Pan Ocean (028670 KS/Buy/TP: W4,000) Raise TP – Expectations on 2H20 turnaround remain intact
 KEPCO KPS (051600 KS/Buy/TP: W40,000 Lower TP – IPP strength to continue
 Emart (139480 KS/Buy/TP: W190,000) – Moderate 1Q20 results; Look for improvement in 2H20
 Netmarble (251270 KS/Buy/TP: W130,000) Raise TP – Earnings to rebound in 2Q20
 Banks – April financial market trends: Corporate loans register another record increase

 Global performance monitor: Two-day change (%)
                               Asia xJPN World EM World DM                  Korea         Japan         China       Taiwan             HK         India Indonesia Singapore             Thailand
 Index                             -1.01     -0.72    -1.28                  -0.02         -0.14         -1.03        -0.91          -1.46         1.61     -2.71      -1.27                0.42
 Growth                            -0.25     -0.82    -1.99                   0.63          0.85         -0.85        -1.26          -1.30         2.30     -2.11      -1.27               -0.11
 Value                             -1.22     -1.16    -2.10                  -0.82         -1.23         -1.28        -0.54          -1.64         0.96     -3.46      -1.28                1.00
 Semicon. & equip.                 -1.53     -1.55    -2.08                  -1.33          0.77          1.52        -1.09           0.24         N/A       N/A        N/A                  N/A
 Tech hardware & equip.            -1.21     -1.22    -1.03                   0.37         -0.54          0.43        -0.36          -0.25         3.46      N/A       -0.13                 N/A
 Comm. & prof. services            -0.25     -0.25    -0.97                   4.32          0.98          1.09        -0.53           N/A         -3.31     -1.72       N/A                  N/A
 Software & services                0.74      0.47    -1.93                  -1.09          3.94         -0.15         0.96          -0.55         1.64      N/A       -3.84                 N/A
 Media & entertainment             -0.41     -0.33    -1.62                   2.28          2.96          1.04         4.40           0.71         4.21      N/A       -3.94                 N/A
 Consumer goods                    -1.59     -1.53    -1.07                  -3.76          0.42         -0.10        -1.35           0.60         3.27      0.93       N/A                -1.16
 Consumer services                 -0.90     -0.32    -1.92                  -7.19          0.14         -1.65        -0.11          -2.26         6.25     -4.71      -0.72                0.34
 F&B & tobacco                      0.66      0.18     0.14                   1.96          0.79          2.09        -0.73          -0.45         0.84      0.59     12.64                 1.52
 Food & staples retailing          -0.22     -0.92    -0.26                   1.15          2.54          3.13        -0.02          -0.21         2.03      N/A       -0.70               -2.47
 Retailing                         -1.75     -1.13    -1.55                  -1.48         -1.37         -0.04        -1.52          -2.21         1.30     -7.08      -0.80                1.65
 HH & personal products            -1.01     -1.27     0.11                  -0.27          1.29          2.06        -2.16           N/A         -1.29      2.32       N/A                  N/A
 Pharma & life sciences             0.01      0.17    -0.16                   2.13          2.91          2.47         0.75          -2.99        -1.27      1.24       N/A                  N/A
 Autos & parts                     -1.02     -0.98    -1.33                  -1.50         -3.25         -1.58        -2.54          -0.66         3.34     -4.70       N/A                  N/A
 Transportation                    -0.54     -0.67    -1.28                  -0.75         -1.90         -0.89        -0.52          -0.82         6.03     -9.60      -7.50                0.79
 Capital goods                     -1.11     -0.91    -1.53                  -1.39         -0.41         -0.26        -2.53          -1.43         4.48      N/A       -0.67                 N/A
 Materials                         -1.03      0.27    -0.66                  -0.32         -0.88         -0.44        -1.42           N/A          3.96     -1.47       N/A                 1.03
 Real estate                       -2.29     -2.01    -3.41                  -1.97         -3.38         -1.20        -1.30          -2.46         6.19     -7.91      -2.57                0.69
 Energy                            -2.93     -1.10    -1.10                  -2.45          0.42         -1.09        -1.64           0.46        -3.74     -3.35      -1.05                2.00
 Banks                             -0.97     -0.79    -1.66                  -1.60         -0.71         -0.85        -0.73          -1.19         5.25     -4.20      -1.04                0.71
 Diversified financials            -0.03     -0.81    -1.69                  -1.93         -1.17         -0.07        -0.34           0.63         5.79      N/A       -0.37                4.74
 Telecom services                  -0.54     -0.08     0.03                   2.45         -0.04         -1.14        -0.46          -1.98         4.20     -1.62      -1.88               -0.72
 Utilities                         -0.73     -0.86    -0.21                  -0.02          1.87          0.09         0.40          -0.63         4.64     -4.32       N/A                -0.44

This publication contains summaries of reports prepared by Mirae Asset Daewoo Co., Ltd. and/or its non-US affiliates (“Mirae Asset Daewoo”). Please review the compliance notices contained in
the original reports. Information and opinions contained herein have been compiled in good faith from sources deemed to be reliable. However, the information has not been independently
verified. Mirae Asset Daewoo makes no guarantee, representation, or warranty, express or implied, as to the fairness, accuracy, or completeness of the information and opinions contained in this
document. Mirae Asset Daewoo accepts no responsibility or liability whatsoever for any loss arising from the use of this document or its contents or otherwise arising in connection therewith.
Information and opinions contained herein are subject to change without notice. This document is for informational purposes only. It is not and should not be construed as an offer or solicitation
of an offer to purchase or sell any securities or other financial instruments. This document may not be reproduced, further distributed, or published in whole or in part for any purpose.
May 14, 2020
One-Asia Morning Focus
Key thematic ETFs: Change (%) Market movers
Mkt cap US dollar total returns (%)
Name Ctry Sector
Robotics & AI (Global X) (US$mn) 1D 1M 3M 6M 1Y 3Y
Cloud Computing (Global X) Top seven performers
Lithium & Battery (Global X) Hartalega MY Healthcare 6,931 17.8 19.3 39.1 62.1 78.9 226.3
Internet of Things (Global X) Top Glove MY Healthcare 5,517 16.6 39.5 52.0 102.7 95.0 280.4
Digitalisation (iShares) Samsung SDI KR Information tech. 17,605 9.1 27.5 -11.1 26.5 37.7 89.0
FinTech (Global X) Bandhan Bank IN Financials 5,384 7.9 32.1 -47.2 -57.3 -57.2 NA
Genomics & Biotech (Global X) Axis Bank IN Financials 15,475 7.1 -0.3 -47.7 -44.3 -47.1 -29.0
Health & Wellness (Global X) Adani Ports & SEZ IN Industrials 8,334 6.3 19.0 -19.9 -19.2 -19.5 -24.5
Ageing Population (iShares) UltraTech Cement IN Materials 13,588 6.2 3.7 -24.6 -17.5 -23.3 -30.6
EM Consum Growth (iShares)
Clean Energy (iShares)
Singapore Airlines SG Industrials 8,357 -6.9 -7.6 -35.3 -40.4 -40.5 -43.0
Water Resources (Invesco)
Barito Pacific ID Materials 7,027 -6.6 36.5 -11.8 7.3 42.6 250.2
Agribusiness (iShares)
Nestle India IN Consumer staples 21,105 -5.3 0.5 -4.9 11.3 52.8 116.7
Global Infrastructure (iShares)
SM Prime Holdings PH Real estate 16,404 -3.5 -4.5 -32.1 -26.3 -23.1 -9.7
ESG US Leaders (iShares)
NCsoft KR Commun. services 12,935 -3.4 10.2 10.8 32.8 38.2 96.6
2D 10D
(9) (6) (3) 0 3 6 9 Gulf Energy Dev. TH Utilities 12,806 -3.0 11.0 -1.9 9.5 80.6 NA
Global Power Synergy TH Utilities 6,331 -2.9 9.7 -8.1 -17.9 33.3 161.6
MSCI valuations (DM, EM, Asia ex-JP)
14 12M forward P/E (x) 18 2.0 12M trailing P/B (x) 2.8
17
13 2.6
1.8
16
2.4
12 1.6
15
2.2
14
11 1.4
2.0
13
10 1.2
12 1.8
9 11 1.0 1.6
May-19 Aug-19 Nov-19 Feb-20 May-19 Aug-19 Nov-19 Feb-20
MSCI Asia ex-JP (L) MSCI World EM (L) MSCI World DM (R) MSCI Asia ex-JP (L) MSCI World EM (L) MSCI World DM (R)
MSCI 12M forward P/E (x) Currencies
(vs. USD) Value Change (%)
Korea Vietnam 1D 3M YTD
12
KRW 1,223.8 -0.09 3.46 5.82
11 19
CNY 7.1 0.07 1.63 1.84
10
16 JPY 107.1 -0.11 -2.46 -1.44
9 IDR 14,885.0 -0.13 8.81 7.22
8 13 HKD 7.8 0.00 -0.20 -0.53
TWD 29.9 -0.02 -0.36 -0.34
7
May-19 Aug-19 Nov-19 Feb-20
10 SGD 1.4 0.18 2.13 5.47
May-19 Aug-19 Nov-19 Feb-20
THB 32.1 -0.18 3.02 7.06
Indonesia 20 India INR 75.5 -0.07 5.80 5.73
17
PHP 50.3 -0.09 -0.48 -0.76
15 18 MYR 4.3 -0.08 4.52 5.79
VND 23,347.5 0.06 0.46 0.76
13 16
11 14
Commodities
9
Latest Change (%)
12
May-19 Aug-19 Nov-19 Feb-20
May-19 Aug-19 Nov-19 Feb-20
close 1D 3M YTD
Crude oil (US$/bbl) 29.6 0.0 -55.8 -56.3
17
Hong Kong
13
China Thermal coal (US$/tonne) 58.6 0.0 -11.5 -12.6
Iron ore (US$/tonne) 87.8 1.3 -5.2 -4.1
15 12
Copper (US$/tonne) 5,234.0 0.1 -15.1 -15.0
Nickel (US$/tonne) 12,275.0 0.7 -12.8 -12.3
Tin (US$/tonne) 15,417.0 0.1 -10.1 -8.5
13 11
Gold (US$/ozt) 1,704.4 0.5 11.8 12.2
Palm oil (INR/tonne) 688.8 -0.1 -21.6 -20.9
11 10
May-19 Aug-19 Nov-19 Feb-20
Soybean oil (c/lb) 24.6 -1.9 -30.2 -28.3
May-19 Aug-19 Nov-19 Feb-20
Corn (US$/bu) 3.1 1.2 -22.1 -21.4
Wheat (US$/bu) 5.2 -0.6 -6.9 -6.6
Source: FactSet, Mirae Asset Daewoo Research (updated on 5/13/20 at 23:00 KST)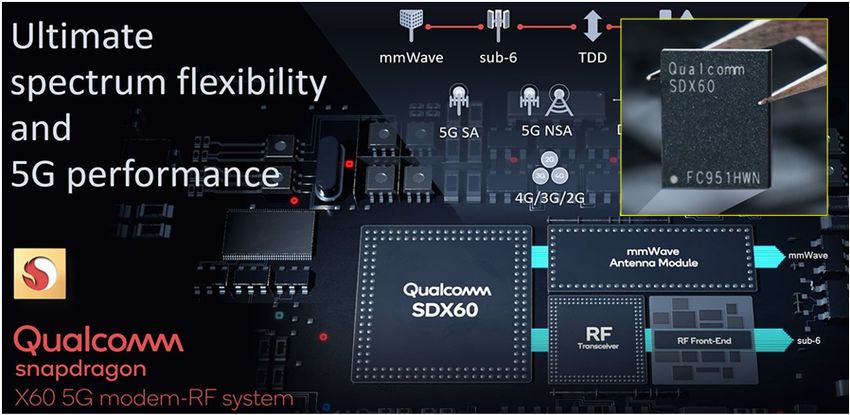
Samsung Electronics
                                                          (005930 KS)
                                                          Bet on potential returns on invested capital
Technology
                                                          Investment points
Initiation Report                                         I. Increased visibility on foundry capex to drive up valuation: For 2021, we forecast
May 14, 2020                                              Samsung Electronics’ (SEC) foundry capex at W9.2tr or higher, which we estimate will
                                                          translate into a roughly W40tr boost to the company’s value.

                                                          II. Lower DRAM investments to support structural earnings growth: We believe SEC’s
                                                          conservative DRAM investments will help keep DRAM prices steady, leading to
(Initiate)                                      Buy       sequential earnings growth and the opening of a structural growth phase.

                                                          III. NAND market share expansion to boost earnings: We expect SEC’s NAND capex to
Target Price (12M, W)                    68,000           far exceed the market average. We believe SEC will continue to execute massive capex
                                                          and enjoy a dominant earnings share in the NAND market.
Share Price (05/13/20, W)                48,550
                                                          Earnings outlook
Expected Return                                 40%       For 2Q20, we forecast SEC to post revenue of W48.1tr (-14.3% YoY, -13.1% QoQ) and
                                                          operating profit of W5.9tr (-10.4% YoY, -8.3% QoQ). By business division, we expect: 1)
                                                          operating profit of W5.2tr for semiconductor; 2) an operating loss of W0.6tr for display;
OP (20F, Wbn)                                   30,807
                                                          3) operating profit of W1.2tr for IT & mobile communications (IM); and 4) operating
Consensus OP (20F, Wbn)                         32,904
                                                          profit of W0.3tr for consumer electronics (CE).
EPS Growth (20F, %)                               11.2
                                                          We estimate foundry capacity will expand 43,000 wpm in 2020 and 53,000 wpm in
Market EPS Growth (20F, %)                        28.1
                                                          2021. With a utilization rate at the 90% level, we expect such capacity expansion to lead
P/E (20F, x)                                      13.8
                                                          to revenue growth. For 2020, we forecast the foundry and system LSI division to see
Market P/E (20F, x)                               12.8
                                                          revenue of W17.3tr (+17.3% YoY) and OP margin of 10.4%. For 2021, we forecast the
KOSPI                                          1,940.42
                                                          division to deliver revenue of W21.3tr (+23.3% YoY) and OP margin of 13.4%, as foundry
Market Cap (Wbn)                               289,833    supplies to Qualcomm and Nvidia should gather traction.
Shares Outstanding (mn)                          6,793
                                                          Initiate coverage with Buy rating and target price of W68,000
Free Float (%)                                    74.8
Foreign Ownership (%)                             55.0    We initiate our coverage on SEC with a Buy rating and target price of W68,000. We
Beta (12M)                                        0.97    derived our target price using a SOTP methodology, applying an average EV/EBITDA of
52-Week Low                                     41,200    5.9x to 2020F EBITDA estimates. By division, we applied an EV/EBITDA multiple of 5.3x
52-Week High                                    62,400    for semiconductor, 4.0x for display, 10.7x for IM, and 5.5x for CE. We believe our target
                                                          multiple of roughly 6.0x is highly reasonable, representing only a 14.7% premium to
(%)                        1M           6M        12M     the average 2020F EV/EBITDA of pure memory names Micron and SK Hynix.
Absolute                   0.5          -7.5      13.8
Relative                  -5.4          1.2       22.0

  160          Samsung Electronics             KOSPI
  140

  120

  100

   80

   60
        5.19       9.19          1.20             5.20

Mirae Asset Daewoo Co., Ltd.

[Semiconductors]                                          FY (Dec.)                          12/17              12/18              12/19            12/20F             12/21F            12/22F
                                                          Revenue (Wbn)                   239,575            243,771            230,401            218,366            255,586           299,150
Young-gun Kim
+822-3774-1448                                            OP (Wbn)                          53,645             58,887             27,769            30,807             45,409             53,642
younggun.kim.a@miraeasset.com                             OP margin (%)                        22.4               24.2               12.1              14.1               17.8               17.9
Yumi Cha                                                  NP (Wbn)                          41,345             43,891             21,505            23,903             34,545             40,186
+822-3774-1770                                            EPS (W)                            5,421              6,024              3,166              3,519              5,086             5,916
yumi_cha@miraeasset.com                                   ROE (%)                              21.0               19.6                8.7                9.1              12.2               13.1
                                                          P/E (x)                               9.4                6.4               17.6              13.8                 9.5                  8.2
                                                          P/B (x)                               1.8                1.1                1.5                1.2                1.1                  1.0
                                                          Dividend yield (%)                    1.7                3.7                2.5                3.3                3.7                  3.7
                                                          Note: All figures are based on consolidated K-IFRS; NP refers to net profit attributable to controlling interests
                                                          Source: Company data, Mirae Asset Daewoo Research estimates

                                                          Analysts who prepared this report are registered as research analysts in Korea but not in any other jurisdiction, including the U.S.
                                                          PLEASE SEE ANALYST CERTIFICATIONS AND IMPORTANT DISCLOSURES & DISCLAIMERS IN APPENDIX 1 AT THE END OF REPORT.
May 14, 2020                                                                                           Samsung Electronics

               Investment points

               Point I: Increased visibility on foundry capex to drive up valuation

               SEC’s 2021 foundry capex to reach at least W9.2tr (+77% YoY)
               For 2021, we forecast SEC’s foundry capex at W9.2tr or higher, which we estimate will
               translate into a roughly W40tr boost to the company’s value (based on TSMC’s average ROIC
               of 23.5% and P/E of 18x). We believe that capital recovery seems very likely in the 7nm-or-
               below segment, in which the company enjoys a duopoly alongside TSMC.

               Technological and capital requirements form high barriers to entry
               Amid massive capital investments by leading foundries and logic chipmakers, the threat of
               new entrants has been easing significantly. During the most recent five years, pure memory
               players invested an average of US$7.9bn annually, while foundry/logic firms executed
               average capex of US$11.6bn. SMIC, the leading Chinese foundry, spent a meager US$2bn
               annually.

               Moreover, in 7nm-or-below processes, SEC and TSMC have held a duopoly since
               GlobalFoundries ceased all 7nm development in 2018. For reference, there are five
               foundries/integrated device manufacturers (IDMs) in the 20nm segment and around 10 in
               40nm. We note that Intel is scheduled to begin 10nm production shortly, and could
               potentially pursue a node shrink to 7nm.

               Another barrier to entry is the limited availability of lithography machines, which are
               essential to fabrication at 7nm or below (excluding TSMC’s N7 process). ASML usually ships
               only around 10 EUV lithography machines quarterly, and in 2Q20, only two units were
               shipped amid the COVID-19 outbreak. Demand for EUV lithography systems is rising due to
               their adoption in memory chip production, and players that fail to secure the machines will
               be unable to migrate to the 7nm process.

               Figure 1. Annual capex trends and forecasts for global semiconductor companies

                 (US$bn)
                 20         Intel         TSMC           SK Hynix
                            Micron        SMIC

                 15

                           Foundry/logic 5Y avg. capex: US$11.6bn

                 10
                           Pure memory 5Y avg. capex: US$7.9bn

                  5

                  0
                      2006              2008             2010       2012   2014   2016          2018         2020F

               Source: Thomson Reuters, Mirae Asset Daewoo Research

                                                                                         Mirae Asset Daewoo Research    2
May 14, 2020                                                                                                                                                                           Samsung Electronics

               Figure 2. GlobalFoundries ceased 7nm development in August 2018

               Source: GlobalFoundries, Mirae Asset Daewoo Research

               Figure 3. Foundry players by process node
                         28                   25                 18                 13                   13                 9                  6                5              3              2(3)               2(3)
                       Silterra

                       X-FAB

                       DB하이텍
                         ADI                  ADI

                        Atmei                Atmei

                        Rohm                 Rohm
                        Sanyo                Sanyo

                    Mitsubishi          Mitsubishi

                 ON Semiconductor ON Semiconductor

                       Hitachi           Hitachi
                       Cypress           Cypress               Cypress

                        Sony                 Sony               Sony

                       Infenion          Infenion              Infenion
                        Sharp                Sharp              Sharp

                    Freescale           Freescale             Freescale

                       Renesas           Renesas               Renesas            Renesas              Renesas

                       Toshiba           Toshiba               Toshiba            Toshiba              Toshiba
                       Fujitsu           Fujitsu               Fujitsu            Fujitsu              Fujitsu

                 Texas Instrument    Texas Instrument      Texas Instrument   Texas Instrument     Texas Instrument

                    Panasonic           Panasonic             Panasonic          Panasonic            Panasonic         Panasonic

                       STMicro           STMicro               STMicro            STMicro              STMicro           STMicro
                        UMC                  UMC                UMC                UMC                  UMC                UMC

                         IBM                 IBM                 IBM                IBM                  IBM               IBM               IBM

                        SMIC                 SMIC               SMIC               SMIC                 SMIC               SMIC              SMIC              SMIC
                     GF(AMD)             GF(AMD)              GF(AMD)         GlobalFoundries      GlobalFoundries    GlobalFoundries   GlobalFoundries   GlobalFoundries

                        Intel                Intel              Intel               Intel                Intel             Intel             Intel             Intel          Intel          (Intel)             (Intel)

                    Samsung             Samsung               Samsung            Samsung              Samsung            Samsung           Samsung           Samsung         Samsung        Samsung             Samsung

                        TSMC                 TSMC               TSMC               TSMC                 TSMC              TSMC              TSMC              TSMC            TSMC           TSMC                TSMC
                       180nm             130nm                  90nm               65nm              45nm/40nm         32nm/28nm         22nm/20nm         16nm/14nm          10nm            7nm                5nm

               Source: WikiChip, Mirae Asset Daewoo Research

               Figure 4. ASML: Lithography equipment shipments by technology

                 (Units)
                 80                 I-line           KrF          ArF dry             ArF immersion                   EUV

                 60

                 40

                 20

                                                                                                                                                                                        4    7         7    8
                   0                                                                                                                                                                                                 2
                          4Q13          2Q14            4Q14              2Q15              4Q15         2Q16          4Q16             2Q17         4Q17           2Q18      4Q18          2Q19           4Q19
               Source: ASML, Mirae Asset Daewoo Research

                                                                                                                                                                            Mirae Asset Daewoo Research
May 14, 2020 Samsung Electronics
Demand for SEC’s 7nm-or-below products to expand
Qualcomm: Mass production of 5nm modem chips to start in 2021
SEC’s foundry unit has won orders for Qualcomm’s Snapdragon X60, the world's first 5nm
5G baseband modem, with mass production scheduled to begin in 2021. We note that,
beginning with the Snapdragon 865 5G platform, Qualcomm has separated its modem and
application processor (AP) orders. While SEC will provide X60 modem chips built on its 5nm
low-power early (LPE) process, TSMC will supply APs built on its N5 process.
Order volumes should be dictated by 5G smartphone demand. Qualcomm is looking for
450mn smartphone sales in 2021 and 750mn units in 2022, and Strategy Analytics forecasts
Qualcomm’s 5G modem shipments at 150mn units. The exact die size of the X60 is not yet
known, but based on the Snapdragon 845’s relatively small die size (91mm2), the production
of 150mn chips annually will require capacity of 30,000 wpm (12”). If mass production
progresses smoothly in 2021, Qualcomm could decide to use SEC’s 4nm LPE process to
manufacture its 5G modems in 2022, in which case additional capex will be needed in 2021.
Figure 5. Snapdragon X60 modem chip to be produced on SEC’s 5nm process (2021)
Source: Qualcomm, Mirae Asset Daewoo Research
Figure 6. 5G smartphone shipment estimates
(mn units) (%)
1,000 5G smartphone shipments 950 80
5G smartphone penetration
Qualcomm est.:
750mn
750 60
Qualcomm est.:
450mn 600
500 40
400
250 190 20
70
0 0
2019 2020F 2021F 2022F 2023F
Source: Gartner, Mirae Asset Daewoo Research
Mirae Asset Daewoo Research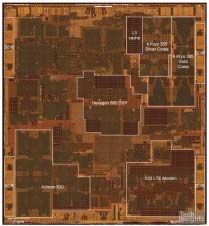
May 14, 2020                                                                                                                Samsung Electronics

                                             Figure 7. 5G baseband shipment forecasts

                                               (mn units)
                                               400          SEC
                                                            Qualcomm

                                               300                                                                                  110
                                                                                                               243

                                               200                                                              63

                                                                                                       140
                                                                                                        27                          248
                                               100
                                                                                                                180

                                                                                      6                 113
                                                                1                    32
                                                 0                6
                                                               2019                2020F               2021F   2022F               2023F

                                             Source: Strategy Analytics, Mirae Asset Daewoo Research

                                             Figure 8. Snapdragon 845 die

                                                                                                                 9.5mm

                                             Source: TechInsights, Mirae Asset Daewoo Research

Figure 9. Snapdragon 845 production: 540 dies per wafer (12”)

Source: Company materials, Mirae Asset Daewoo Research

                                                                                                                       Mirae Asset Daewoo Research
May 14, 2020 Samsung Electronics
Nvidia: Ampere architecture rollout in 2020
One of the key events for SEC’s foundry business this year will be the start of mass
production for Nvidia’s next-generation graphic processing units (GPUs) based on the new
Ampere microarchitecture. After lengthy negotiations, SEC is believed to have taken mass
production orders for the new GPUs, which Nvidia is set to showcase at the GPU Technology
Conference (GTC) scheduled for May 14th. While Ampere has been rumored to be designed
for the 7nm process, actual production is expected to take place on the 8nm node.
Nvidia’s GPU dies are larger than those of SEC’s existing chips. For instance, the die size of
Nvidia’s TU106 GPU (Turing) is 445mm2, around five times larger than that of the
Snapdragon 845 (91mm2). The upcoming Ampere chips are believed to feature a larger die
size than existing GPUs, given its sharply increased transistor count despite the use of the
7nm process.
A larger die size generally implies higher foundry capacity requirements. Accordingly, SEC
will need to add capacity to handle mass production. Considering that larger chips suffer
from greater wafer yield losses than smaller chips, successful production of Nvidia’s new
GPU will help SEC establish a strong track record in large-sized chip mass production.
We forecast SEC’s foundry revenue from Nvidia at W0.8tr in 2020 and W2.5tr in 2021.
Table 1. Nvidia GPU specifications
Name GK180 GM200 GP100 GV100 TU106 GA100 GA103 GA104
Architecture Kepler Maxwell Pascal Volta Turing Ampere Ampere Ampere
Transistor count 7bn 8bn 15bn 21bn 11bn 30bn+ Approx. 22bn Approx. 16bn
Process 28nm 28nm 16nm FinFET+ 12nm FFN 12nm FFN 7nm 7nm 7nm
Die size 551mm2 601mm2 610mm2 815mm2 445mm2 Huge Big Moderate
Launch date 3Q20 3Q20 2021
Source: Nvidia, Mirae Asset Daewoo Research
Figure 10. Nvidia GPU (Turing) production: 62 dies per wafer (12”)
Source: Company materials, Mirae Asset Daewoo Research
Mirae Asset Daewoo ResearchMay 14, 2020 Samsung Electronics
AMD vs. Intel rivalry in 2022 and beyond
The CPU rivalry between Intel and AMD is intensifying. In recent years, AMD has gained
ground with its 7nm technology, while Intel has been held back by delays to the launch of
its 10mn process and poor yields. The primary foundries with which AMD does business are
TSMC (7nm) and GlobalFoundries (14nm+). With Intel already planning to migrate to 7nm
due to poor 10nm yields, AMD will likely have to adopt 5nm to maintain competitiveness.
According to recent press releases, AMD is aiming to kick off 5nm mass production in 2021,
with TSMC handling manufacturing. Meanwhile, the company is likely to gradually replace
its 14nm CPUs with 7nm CPUs, but this migration should prove complicated given
GlobalFoundries’ abandonment of 7nm development. As such, in 2021, we believe that AMD
will decide between: 1) relying solely on TSMC for chip manufacturing; or 2) choosing to
partner with SEC. We believe that both options will be beneficial to SEC. Indeed, even
though the first scenario will not directly benefit the Korean giant, it should be positive to
overall supply/demand dynamics given the likely increase in capacity utilization on 7nm-or-
below processes.
Figure 11. Intel’s manufacturing road map: 7nm CPUs in 2021
Source: Company materials, Mirae Asset Daewoo Research
Figure 12. AMD’s CPU and GPU manufacturing road map: 7nm already in place
Source: Company materials, Mirae Asset Daewoo Research
Mirae Asset Daewoo ResearchMay 14, 2020 Samsung Electronics
All in all, we think there are three major factors that will affect SEC’s foundry demand in
2021 and beyond:
1) 5nm production for Qualcomm’s 5G modems and potential orders for 4nm fabrication
2) Successful mass production of Nvidia’s new Ampere GPU
3) Whether the company can displace GlobalFoundries to become one of AMD’s two primary
7nm-or-below manufacturing foundry partners
For 45nm+ processes, leading-edge capacity utilization is already high at major foundries
(including SEC); this means that ramp-ups will be required to meet additional demand.
Furthermore, Qualcomm, Nvidia, and AMD—all of which are growing increasingly reliant on
SEC and/or TSMC—are forecast to report above-market revenue growth in the coming
years. The three companies are projected to report combined growth of 19.0% in 2020 and
20.6% in 2021, while the other PHLX Semiconductor Sector Index constituents are
anticipated to display growth of 6.3% and 10.2%, respectively.
Figure 13. Global foundry utilization: Leading-edge utilization for 45nm+ is near full capacity
('000 wafers) (%)
24,000 Capacity (L) Shipments (L) 120
Foundry utilization (R) Leading-edge utilization (R) 101.0
95.8
91.5 91.0 90.2
18,000 90
12,000 60
6,000 30
0 0
1Q17 3Q17 1Q18 3Q18 1Q19 3Q19 1Q20F 3Q20F
Source: Gartner, Mirae Asset Daewoo Research
Figure 14. PHLX Semiconductor Sector Index constituents: Revenue and growth forecasts
(US$bn) (%)
400 AMD (L) Nvidia (L) Qualcomm (L) 90
Other PHLX (L) Qualcomm YoY (R) Nvidia YoY (R)
AMD YoY (R) Other PHLX YoY (R)
300 60
200 30
100 0
0 -30
2011 2012 2013 2014 2015 2016 2017 2018 2019 2020F 2021F
Source: Thomson Reuters, Mirae Asset Daewoo Research
Mirae Asset Daewoo ResearchMay 14, 2020 Samsung Electronics
Given the strong demand prospects, we anticipate that SEC’s foundry business, which is
operating at near full capacity, will need additional capacity of 40,000 wpm in 2020. Fabs
that are well positioned to add capacity include the S3, S4 (Line 11 for CIS), and S5 (EUV line).
In 2021, we project that SEC will need additional capacity of 50,000 wpm, which translates to
capex of W9.2tr (+76.3% YoY). Among the firm’s facilities, we think the new P2 fab in
Pyeongtaek is best positioned to add capacity. While others (P3 in Pyeongtaek and S2 in the
US) could also be considered for expansion, we believe P2 will be first in line given its
existing back-end infrastructure, etc.
Table 2. SEC: Foundry wafer capacity trends and forecast (‘000 wpm)
Group Fab Site Wafer size Products 2016 2017 2018 2019 2020F 2021F
Line 4 Giheung 150mm (6") LED 55 55 55 55 55 55
Line 5 Giheung 200mm (8") CIS, smart card IC 50 50 50 50 50 50
Legacy fab
Line 6 Giheung 200mm (8") PMIC, DDI, CIS 80 80 80 80 80 80
Line 7 Giheung 200mm (8") RF/IoT, FPS 70 70 70 70 70 70
Line 8 Giheung 200mm (8") 70 70 70 70 70 70
S1 Line 14 Giheung 300mm (12") Logic (AP, etc.), CIS 45 45 45 45 45 45
Line S Giheung 300mm (12") 40 40 40 40 40 40
S2 SAS Austin 300mm (12") Logic (AP, etc.) 50 50 50 50 50 50
Quarter of Line
S3 Hwaseong 300mm (12") 7-10nm, EUV 0 3 18 20 30 40
17
S4 Line 11 Hwaseong 300mm (12") CIS 0 2 11 15 23 25
V1 EUV fab Hwaseong 300mm (12") 7nm or below (planned), EUV 0 0 0 0 23 30
New fab - - 300mm (12") 7nm or below (planned), EUV 0 0 0 0 1 19
Total wafer capacity (12" equiv.) 269 274 302 314 334 379
Source: Mirae Asset Daewoo Research
Figure 15. SEC: Foundry capacity trend Figure 16. SEC: Foundry capex trend
('000 wafers) (Wtr) (%)
SEC foundry capex (L)
10 300
400 YoY (R) 9.2
Total capacity
Total capacity (12" equiv.)
300 8 200
6.7
5.2
200 5 100
100 3 0
0 0 -100
2008 2010 2012 2014 2016 2018 2020F 2005 2007 2009 2011 2013 2015 2017 2019 2021F
Source: Mirae Asset Daewoo Research Source: Mirae Asset Daewoo Research
Mirae Asset Daewoo ResearchMay 14, 2020 Samsung Electronics
High visibility on ROIC for leading-edge foundry investments
We believe visibility on the the ROIC outlook for SEC’s foundry investments is improving
amid: 1) rising barriers to entry; and 2) signs of structural demand growth.
Our analysis of global pure semiconductor plays shows that memory manufacturers such as
Micron and SK Hynix exhibit high ROIC volatility due to the cyclical nature of the memory
industry and the high sensitivity of supply/demand dynamics to capex. In contrast,
semiconductor manufacturers such as Intel and TSMC have generally managed to keep
their ROIC steady at around 25%, as: 1) non-memory facility investments are unlikely to
cause oversupply; and 2) the oligopolistic market structure ensures a high likelihood of
capital recovery.
Going forward, SEC is likely to concentrate its capex in 7nm-or-below processes, where new
competition is unlikely to emerge. As mentioned earlier in this report, we project that SEC
will execute foundry capex of W9.2tr in 2021 to meet growing demand. We believe that once
a consensus on the scale of capex is formed, the firm’s foundry investments will be priced
into shares. Assuming SEC’s foundry ROIC matches TSMC’s level (23.5%), we believe that
TSMC’s valuation multiple (18x P/E) should be applied to earnings on invested capital. This
would add roughly W39tr (18x W2.2tr) to SEC’s market cap.
Figure 17. ROIC by semiconductor manufacturer
(%)
50 SEC SK Hynix TSMC Micron
SMIC UMC Intel
TSMC ROIC avg.: 23.5x
25
0
-25
-50
1Q10 1Q11 1Q12 1Q13 1Q14 1Q15 1Q16 1Q17 1Q18 1Q19
Source: Thomson Reuters, Mirae Asset Daewoo Research
Figure 18. TSMC’s 12-month-forward P/E
(x)
24
18 18.0
Avg. since 2019: 18.0x
12
6
0
1/15 10/15 7/16 4/17 1/18 10/18 7/19 4/20
Source: Thomson Reuters, Mirae Asset Daewoo Research
Mirae Asset Daewoo ResearchMay 14, 2020 Samsung Electronics
We believe the case of TSMC illustrates how the market reflects capex into share price. The
foundry player’s 12-month-forward P/E—which gradually rose from an average of 13x in
2016 to 15x in 2017 and 16x in 2018—displayed its sharpest rise ever in 2019. Indeed, while
2020-21 earnings forecasts were left virtually unchanged last year, the stock’s valuation
increased by 20%.
We believe the re-rating was driven by capex outlook upgrades rather than by earnings
forecasts. While earnings projections stayed flat, market expectations for TSMC’s 2020
capex were revised upward by 30% in the second half of 2019. As a consensus formed that
the firm’s investments would translate safely into earnings, upward revisions to capex
projections were accompanied by market value expansion. Like TSMC, we expect SEC to see
a valuation re-rating driven by a promising foundry investment outlook.
Figure 19. TSMC: Quarterly capex Figure 20. TSMC: Quarterly OP
(US$bn) (US$bn)
6.0 6.0
4.5 4.5
3.0 3.0
1.5 1.5
0.0 0.0
1Q15 1Q16 1Q17 1Q18 1Q19 1Q20F 1Q21F 1Q15 1Q16 1Q17 1Q18 1Q19 1Q20F 1Q21F
Source: Thomson Reuters, Mirae Asset Daewoo Research Source: Thomson Reuters, Mirae Asset Daewoo Research
Figure 21. TSMC: 12-month-forward P/E Figure 22. TSMC: OP and capex consensus throughout 2019
(x) (US$bn)
22 21 2020F OP
20.8
2021F OP
2020F capex
19 18
18.0
15.9
16 16.3 15
14.6
12.9
13 12
10 9
1/16 7/16 1/17 7/17 1/18 7/18 1/19 7/19 1/19 3/19 5/19 7/19 9/19 11/19
Source: Thomson Reuters, Mirae Asset Daewoo Research Source: Thomson Reuters, Mirae Asset Daewoo Research
Mirae Asset Daewoo ResearchMay 14, 2020 Samsung Electronics
Point II: Lower DRAM investments Structural earnings growth
We expect SEC to remain conservative on DRAM investments, in light of the following
factors:
1) The firm needs to channel resources to its foundry business. Against this backdrop, we
believe that SEC is likely to remain conservative on DRAM investments to keep
secmiconductor capex at an appropriate level relative to EBITDA.
2) Conservative DRAM investments will help stabilize DRAM prices. The DRAM industry’s
expansion is driven by price increases rather than by bit growth. When the demand outlook
is subdued (as it is currently), price stability, not shipment growth, holds the key to
maximizing market share gains and margins.
3) Even if SEC makes aggressive capital investments to increase its market share, well-
financed rivals are likely to follow suit. We believe aggressive DRAM capex is more likely to
cause DRAM price declines than to bring about the desired result.
All in all, SEC’s conservative DRAM investments should help keep DRAM prices steady,
leading to sequential earnings growth and the opening of a structural growth phase. For
2020, we estimate that the firm will execute W7.2tr (-11.1% YoY) in DRAM capex (or wafer
capacity additions of 40,000 wpm), and that DRAM ASP will continuously increase, driving
quarterly earnings growth.
Figure 23. SEC: DRAM capex trend Figure 24. SEC: DRAM wafer capacity trends
(Wtr) SEC DRAM capex (L) (%) ('000 wpm)
16 YoY (R) 300 100 Increase
13.7 Decrease
Avg. capacity chg. 60
12 200 50 39 40
30 30
21
15 14
8.1 7.8
8 7.2 100 0
-15 -19
4 0 -50
0 -100 -100
2005 2008 2011 2014 2017 2020F 2014 2015 2016 2017 2018 2019 2020F 2021F
Source: Mirae Asset Daewoo Research Source: Mirae Asset Daewoo Research
Figure 25. SEC: DRAM ASP trend Figure 26. SEC: DRAM revenue and OP forecasts
(%) (Wbn) (%)
30 16,000 Revenue (L) OP (L) OP margin (R) 80
15 12,000 60
53.0
0 8,000 40
32.2
-15 4,000 20
-30 0 0
1Q14 1Q15 1Q16 1Q17 1Q18 1Q19 1Q20P 1Q21F 1Q16 1Q17 1Q18 1Q19 1Q20P 1Q21F
Source: Mirae Asset Daewoo Research Source: Mirae Asset Daewoo Research
Mirae Asset Daewoo ResearchMay 14, 2020 Samsung Electronics
Rationale behind our conservative DRAM capex outlook: 1) SEC needs to make
room for foundry capex
As we highlighted in our first investment point, SEC needs to significantly increase its
foundry capex in 2021. However, the foundry business does not yet generate enough
EBITDA to fund the required capex. We estimate foundry capex executed in 2017 and 2019
was equivalent to more than 150% of the EBITDA generated in the respective year. In our
view, SEC needs to secure sufficient funds for investment within the semiconductor
business, while also striking a balance between EBITDA and capex. We believe the
semiconductor division’s overall capex has never once exceeded 70% of EBITDA since 2014.
We think conservative spending on DRAM is a sensible move from this perspective. More
disciplined DRAM capex would allow SEC to generate stable profits (rather than expand
market share) and dedicate more resources to the foundry business. After expanding
capacity through aggressive capex in the past, TSMC has now entered a virtuous cycle, in
which the company is making stable profits from its facilities following the end of
depreciation, which is, in turn, leaving more room for investments in advanced processes.
Similarly, we believe the DRAM business can serve as a cash cow for SEC. In 2020-21, we
forecast DRAM capex to be W15.0tr. We expect DRAM EBITDA to be around W52.2tr. Even
after taking into account foundry capex of W14.6tr, this should be enough to still keep the
semiconductor division’s overall EBITDA/capex ratio at 50.0%, in line with the level seen
during the 2018 memory up cycle.
Figure 27. SEC foundry business: EBITDA and capex Figure 28. SEC semiconductor business: EBITDA and capex
(Wbn) Foundry EBITDA (%) (Wbn) Total semiconductor EBITDA (%)
10,000 Foundry capex 200 80,000 Total semiconductor capex 100
Capex/EBITDA
Capex/EBITDA
161.7
150.8
7,500 132.5 150 60,000 68.7 75
68.3
54.5
99.4 55.0 50.3
47.3 50.0
5,000 93.8 100 40,000 50
80.1
38.2
2,500 56.3 61.4 50 20,000 25
0 0 0 0
2014 2015 2016 2017 2018 2019 2020F 2021F 2014 2015 2016 2017 2018 2019 2020F 2021F
Source: Mirae Asset Daewoo Research Source: Mirae Asset Daewoo Research
Figure 29. SEC DRAM business: EBITDA and capex Figure 30. TSMC: EBITDA and capex
(Wbn) DRAM EBITDA (%) (US$bn) TSMC capex (%)
48,000 DRAM capex 60 32 TSMC EBITDA 100
Capex/EBITDA
85.7 Capex/EBITDA
78.8 79.3
75.7
71.1
36,000 45 24 75
40.0
58.8 60.0
39.2 34.5 33.8 55.2
31.3 51.8
48.0 47.6
24,000 26.6 30 16 50
24.3
12,000 15 8 25
0 0 0 0
2014 2015 2016 2017 2018 2019 2020F 2021F 10 11 12 13 14 15 16 17 18 19 20F
Source: Mirae Asset Daewoo Research Source: TSMC, Thomson Reuters, Mirae Asset Daewoo Research
Mirae Asset Daewoo ResearchMay 14, 2020 Samsung Electronics
Rationale behind our conservative DRAM capex outlook: 2) SEC needs to keep
DRAM prices stable
DRAM revenue and profit growth moves in tandem with price changes. It is safe to say that
during the past decade, DRAM revenue and profits have never increased during periods of
price decline. Unlike the NAND market, whether DRAM revenue and profits grow is
determined by whether ASP is rising or falling (not by the price elasticity of shipments), with
bit growth largely fixed.
That said, aggressive pricing strategies do work during down cycles. In 2016 and 2019, SEC
was able to either expand or maintain its market share (45.3% 48.0% in 2016; 43.9%
43.7% in 2019) by employing an aggressive bit growth strategy. During these years,
operating profit across the DRAM industry declined 30.7% and 66.6%, respectively, but SEC’s
share of overall profits increased from 58.3% to 68.8% and from 47.9% to 52.0%,
respectively. In other words, the company’s strategy of overcoming market downturns
through preemptive inventory depletion worked well.
However, the DRAM cycle is set to undergo a recovery from 2020. In this case, maintaining
stable prices is likely to take priority over aggressive spending or shipments. Due to SEC’s
conservative capex stance, we expect quarterly ASP to move up in 2020. The uptrend in ASP
should continue through 2021, driving strong profit growth. We forecast SEC’s DRAM
operating profit to grow 12.1% to W13.5tr in 2020 and 55.1% to W21.0tr in 2021.
Figure 31. Global DRAM: ASP, bit, revenue, and OP growth
(%) ASP chg. Bit growth Sales growth OP growth
240
160
2011-12
Industry-wide losses
80
50.4 47.1
28.6 26.6 34.1
22.8 23.7 19.9 21.0 19.0
2.3 14.8
0
-0.9
-20.0 -27.0
-29.8
-49.9 -46.7
-80
2011 2012 2013 2014 2015 2016 2017 2018 2019
Source: DRAMeXchange, Mirae Asset Daewoo Research estimates
Figure 32. SEC DRAM business: ASP, bit, revenue, and OP growth
(%)
240 ASP chg. Bit growth Sales growth OP growth
160
80
49.8 54.1 48.2
30.1 35.8
27.1 25.8 19.5 23.1 21.1
14.7 16.7
12.3 3.9
0
-6.3 -5.0 -9.1
-17.5
-29.3 -29.7
-45.8 -49.2
-80
2011 2012 2013 2014 2015 2016 2017 2018 2019 2020F 2021F
Source: Company data, Mirae Asset Daewoo Research estimates
Mirae Asset Daewoo ResearchMay 14, 2020 Samsung Electronics
Figure 33. Global DRAM: M/S by revenue
Others
Nanya
Powerchip
ProMOS
Elpida
Micron
45.3 48.0 45.8 43.9 43.7 SK Hynix
36.9 42.3 40.9 39.6
33.3 36.7
SEC
2009 2010 2011 2012 2013 2014 2015 2016 2017 2018 2019
Source: DRAMeXchange, Mirae Asset Daewoo Research estimates
Figure 34. Global DRAM: M/S by OP
3.6
12.8 10.6
7.5 18.6 18.1 20.9 21.5
27.9 Nanya
25.2
24.1 28.5 Powerchip
34.5 28.9
30.5 29.1 25.1
ProMOS
99.7 100.0 Elpida
72.1 68.8 Micron
59.8 58.3
50.9 47.0 51.4 47.9 52.0 SK Hynix
SEC
2009 2010 2011 2012 2013 2014 2015 2016 2017 2018 2019
Source: DRAMeXchange, Mirae Asset Daewoo Research estimates
Figure 35. Global DRAM: OP trends
(Wtr) (%)
99.7 100.0
75 100
72.1 -66.6%
50 68.8 75
59.8 58.3
50.9
47.0
25 -30.7% 52.0 50
-71.9% 51.4
47.9
-41.9%
0 25
Nanya Powerchip
ProMOS Elpida
Micron SK Hynix
-25 SEC SEC OP share (R) 0
2009 2010 2011 2012 2013 2014 2015 2016 2017 2018 2019
Note: OP growth figures for 2011 and 2012 represent chg. in the sum of profits, excluding operating losses.
Source: DRAMeXchange, Mirae Asset Daewoo Research estimates
Mirae Asset Daewoo ResearchMay 14, 2020 Samsung Electronics
Rationale behind our conservative DRAM capex outlook: 3) Competitors to follow
suit
If SEC were to execute capex exceeding demand in order to expand its market share, its
competitors would most likely follow suit. SK Hynix has room for an additional 20,000 wpm
at its C2E fab in Wuxi, China, and is set to complete construction of its M16 fab (designed
capacity of around 100,000 wpm). Micron is also likely to complete construction of its
Taichung fab in Taiwan and its Hiroshima fab in Japan by the end of the year. As such, DRAM
makers are well-positioned to increase capacity swiftly if necessary. And considering that
they differ very little in terms of cost competitiveness, any competition to expand capacity
would likely only lead to price declines, rather than market share gains. As such, we expect
SEC to focus its investments on bolstering its cost competitiveness.
Until early this year, many expected SEC to pursue aggressive DRAM capex as part of its
efforts to widen its lead over rivals. During past periods of rapid growth, all DRAM makers
vied for market share gains via capacity additions. But with the market now stable and
controlled by a handful of players, aggressive capex would be a recipe for losses rather than
market share gains. As such, we believe mega-fabs represent the best strategy, and one
that is already adopted by all DRAM makers. By maintaining sufficient room in such facilities
for potential lines and clean rooms, companies can expand capacity flexibly depending on
market conditions, thus preventing unnecessary capex spending based on excessive
projections.
Figure 36. SEC: DRAM breakdown by tech node (%) Figure 37. SK Hynix: DRAM breakdown by tech node (%)
Average tech node factor (R) Average tech node factor (R) 1Znm
100 1Znm 35 100 35
1Ynm
1Ynm
75 30 75 1Xnm 30
1Xnm
23nm
21nm
20nm
50 25 50 25
25nm 25m
25 20 25 29nm 20
35nm
38nm
0 15 0 15
1Q14 1Q15 1Q16 1Q17 1Q18 1Q19 1Q20 1Q14 1Q15 1Q16 1Q17 1Q18 1Q19 1Q20
Source: DRAMeXchange, Mirae Asset Daewoo Research Source: DRAMeXchange, Mirae Asset Daewoo Research
Figure 39. Average tech node factors of three major DRAM
Figure 38. Micron: DRAM breakdown by tech node (%)
makers
Average tech node factor (R) (nm)
100 35
1Znm 35 SEC
SK Hynix
1Ynm
75 30 Micron
30
1Xnm
20nm
50 25
25
25m
25 20
30nm 20
0 15
15
1Q14 1Q15 1Q16 1Q17 1Q18 1Q19 1Q20
1Q14 1Q15 1Q16 1Q17 1Q18 1Q19 1Q20
Source: DRAMeXchange, Mirae Asset Daewoo Research Source: DRAMeXchange, Mirae Asset Daewoo Research
Mirae Asset Daewoo ResearchMay 14, 2020 Samsung Electronics
Point III: NAND market share expansion to boost earnings
We expect SEC’s NAND capex to far exceed the market average for several reasons.
First, competitors’ poor earnings leave them minimal financial room for investments. In
1Q20, most NAND suppliers, with the exception of SEC, recorded losses. In 2016, a pickup in
NAND prices improved margins across the industry, triggering massive capacity expansions.
However, the resulting oversupply drove down SEC’s NAND margins to near breakeven in
2019. We do not expect this situation to recur.
Second, massive NAND capex can stimulate demand. Unlike in the DRAM market, where
growth has been driven by steady price increases, a major driver of NAND market growth
has been the demand stimulated by persistent price declines (given NAND’s nature as a
substitute good). In 2017, however, NAND prices climbed sharply on supply shortages,
slowing the growth of NAND content in client SSDs. In 2018, prices started to fall again,
leading to higher sales volume and content. With the price elasticity of NAND confirmed, we
expect SEC to pursue a bit-growth-oriented strategy for client SSDs. As such, we expect SEC
to continue to execute massive capex and enjoy a dominant earnings share in the NAND
market. In 2020, we expect SEC’s NAND capex to come in at W8.8tr, equivalent to 90,000
wpm.
Figure 40. SEC: NAND capex forecasts Figure 41. SEC: NAND wafer capacity forecasts
(Wtr) (%) ('000 wpm)
16 SEC NAND capex (L) 300 120 Increase 100
Decrease 90
YoY (R) 80
Avg. capacity chg.
12 200 60 47
40 41
9.7 23
8.8 18 11
7.8
8 7.0 100 0
-30
4 0 -60
0 -100 -120
2005 2008 2011 2014 2017 2020F 2014 2015 2016 2017 2018 2019 2020F 2021F
Source: Mirae Asset Daewoo Research Source: Mirae Asset Daewoo Research
Figure 42. SEC: NAND ASP chg. Figure 43. SEC: NAND revenue and OP forecasts
(%) (Wbn) (%)
Revenue (L)
30 12,000 60
OP (L)
OP margin (R)
15 8,000 40
22.4
20.5
0 4,000 20
-15 0 0
1Q16 1Q17 1Q18 1Q19 1Q20P 1Q21F
-30
-4,000 -20
1Q14 1Q15 1Q16 1Q17 1Q18 1Q19 1Q20P 1Q21F
Source: Mirae Asset Daewoo Research Source: Mirae Asset Daewoo Research
Mirae Asset Daewoo ResearchMay 14, 2020 Samsung Electronics
Rationale behind our aggressive NAND capex outlook: 1) Revisit previous cycle
In 1Q20, margins dipped below breakeven for all NAND makers except SEC, which recorded
an OP margin at the low-20% level. The firm accounted for more than 90% of overall NAND
market profits in the quarter. As SEC will likely strive to maintain its current profit share and
margin levels, we believe it will continue to execute capex in line with demand growth.
We believe NAND makers’ 2016-18 capex strategy is worth revisiting. NAND ASP/GB, which
had declined continuously from 1Q10, picked up in 2H16 on wafer capacity shortages
arising from the conversion to 3D NAND. At that time, both first-tier (including SEC) and
second-tier NAND suppliers enjoyed high margins. Amid high margins and optimistic
demand forecasts, NAND makers executed aggressive capex.
Althrough SEC’s NAND capex spending in 2017 was the largest in the industry, its 2018
capex accounted for only 30% of overall market spending. Thus, the firm displayed below-
industry NAND wafer capacity growth and bit growth in 2017-18. In 2018, prices plunged
due to oversupply stemming from aggressive shipments by chipmakers, driving down
NAND makers’ profits to near or below break-even levels. Of note, the easing of the
oversupply seen in 2019 was mainly driven not by demand growth, but by reduced supply
caused by Toshiba Memory’s power outage.
As the NAND market is still not fully concentrated, we think SEC is highly likely to
aggressively ramp up its NAND capex going forward, setting the stage for another game of
chicken among NAND makers. We see NAND prices stabilizing from 2H20 amid a slowdown
in price growth. With upside to NAND prices likely limited, we believe only players capable of
reducing costs will benefit. All in all, we expect SEC to maintain its leading position in the
NAND space (in terms of capex and operating profit) for some time.
Figure 44. Global NAND makers: OP margin trends Figure 45. SEC: NAND capex trend
(%) SEC SK Hynix (Wtr) (%)
80 Micron Intel
16 SEC NAND capex (L) 300
Toshiba
YoY (R)
40 12 200
9.7
8.8
7.8
0 8 7.0 100
-40 4 0
-80 0 -100
1Q11 1Q12 1Q13 1Q14 1Q15 1Q16 1Q17 1Q18 1Q19 2005 2008 2011 2014 2017 2020F
Source: Mirae Asset Daewoo Research Source: Mirae Asset Daewoo Research
Mirae Asset Daewoo ResearchMay 14, 2020 Samsung Electronics
Figure 46. Global NAND makers: Capex trends
(US$mn) (%)
32,000 60
Intel
Micron
24,000 Toshiba/SanDisk 45
SK Hynix
SEC
16,000 SEC share of global NAND capex (R) 30
30.4
8,000 15
0 0
2009 2010 2011 2012 2013 2014 2015 2016 2017 2018 2019
Source: DRAMeXchange, Mirae Asset Daewoo Research
Figure 47. Global NAND makers: Bit growth trends
(%) SEC Kioxia (Toshiba Memory) Western Digital Micron SK Hynix Total
80
67.5
60
49.9 48.1
45.4
41.6 42.7
40.3
40 34.6 33.4
29.0
26.6 24.7
20
0
2016 2017 2018 2019 2020 2021
Source: DRAMeXchange, Mirae Asset Daewoo Research
Figure 48. Global NAND M/S breakdown in terms of OP
100%
75%
Toshiba
Intel
50% 95.5 Micron
SK Hynix
59.3
25% 45.8 48.3 46.4 SEC
44.3
36.6 38.4 37.3
0%
2011 2012 2013 2014 2015 2016 2017 2018 2019
Source: Company data, Mirae Asset Daewoo Research
Mirae Asset Daewoo ResearchMay 14, 2020 Samsung Electronics
Rationale behind our aggressive NAND capex outlook: 2) Higher client SSD
demand needed
DRAM market growth has been driven mainly by steady price increases. In contrast, a major
driver of NAND market growth has been the demand stimulated by persistent price
declines, given NAND’s nature as a substitute good for hard disk drives (HDDs). Indeed,
NAND ASP/GB has been trending downward since 2007, supporting continuous bit growth.
In 2017, however, the spike in NAND prices caused by supply shortages crippled growth in
SSD penetration and content in PCs. From 2012 to 2016, overall NAND market bit growth
averaged 48.2%, with ASP declining 27.2% annually. In 2017, bit growth slowed to 35.7%,
and ASP climbed 36.9%.
As for enterprise SSDs, bit growth improved to 63.8% in 2017 on the back of stronger
demand for cloud SSDs, even though prices (ASP/GB) declined at a much slower rate of
around 5%. We believe enterprise SSD bit growth was more affected by server-class SSDs—
which benefited from robust server demand—than by storage-class SSDs (HDD substitute).
For smartphone NAND, content per unit expanded 56% YoY in 2017 even though mobile
NAND ASP increased 24.5% YoY. To sum up, for both enterprise SSDs and mobile NAND, the
expansion of applications had a greater impact on bit growth than price changes.
For client SSDs, sales volume and content per PC increased at CAGRs of 27% and 13%,
respectively, from 2012 to 2016. In 2017, these growth rates slowed to 7.6% and 3%,
respectively, as ASP increased 16% YoY. In 2018, prices started to fall again, leading to
higher sales volume and content. With client SSDs’ relatively high price elasticity confirmed,
we expect SEC to pursue a bit-growth-oriented strategy for client SSDs.
Indeed, we see limited upside to top-line growth of the PC SSD market going forward, as
SSDs are already used in a significant portion of consumer PCs. Going forward, we think a
major factor in the market’s growth is highly likely to be the content per unit trend.
For consumer PCs, average SSD content per unit stands at just 351GB, much lower than the
average HDD content range of 1.1TB (2.5”)-2.3TB (3.5”). Going forward, we expect storage
capacity of 1TB+ to become the status quo for consumer PCs. With average spending on
storage capacity per PC likely to remain flattish, we forecast average SDD content per PC to
expand to the level of HDD content in line with SSD price declines.
Figure 49. NAND flash: Bit, sales, and ASP growth trends
(%)
240 ASP chg. Bit growth Sales growth
160 151.2
117.7
77.4
80 68.5 67.7
58.4 51.4
45.3 39.8 46.3 36.9 44.9
35.7 31.7
0
-15.1 -18.1 -22.6 -23.5
-32.1 -30.7 -26.5 -27.6
-41.1 -43.5
-80 -57.0 -62.5
2007 2008 2009 2010 2011 2012 2013 2014 2015 2016 2017 2018 2019
Source: DRAMeXchange, Mirae Asset Daewoo Research
Mirae Asset Daewoo ResearchMay 14, 2020 Samsung Electronics
Figure 50. Enterprise SSDs: Bit, sales, and ASP growth
(%) Enterprise SSD bit growth
180 Enterprise SSD ASP chg.
Enterprise SSD unit growth
120 111.3
82.7 76.6
62.6 63.8
60 51.9
41.4 37.4 41.8
30.0 32.8 27.4 26
15.3 12.5 10.5 10.3
0
-6 -5
-17
-35
-38 -40 -50
-60
2014 2015 2016 2017 2018 2019 2020F 2021F
Source: Gartner, Mirae Asset Daewoo Research
Figure 51. Storage-class enterprise SSDs: Bit, sales, and ASP Figure 52. Server-class enterprise SSDs: Bit, sales, and ASP
growth trends growth trends
(%) PB chg. ASP/GB chg. Unit growth (%) PB chg. ASP/GB chg. Unit growth
300 300
200 200
100 100 70
50 44
11
0 0
-1 -6
-100 -100
2013 2014 2015 2016 2017 2018 2019 2020F 2021F 2013 2014 2015 2016 2017 2018 2019 2020F 2021F
Source: Gartner, Mirae Asset Daewoo Research Source: Gartner, Mirae Asset Daewoo Research
Figure 53. Client SSDs: Sales volume and content per PC Figure 54. Client SSDs: Content per PC trend
(mn units) PC SSD (L) PC HDD (L) (%) (GB) Mainstream PC SSD content/unit (L) (%, YoY)
600 PC SSD penetration (R) PC SSD unit growth(R) 80 600 Mainstream PC SSD content/unit growth (R) 32
67.7 28.3
59.4
450 60 450 24
51.4
351
46.1
37.2 14.4
300 40 300 16
12.8
29.3 14.0
10.4 15.0
26.7
150 13.3 20 150 8
18.8 7.2 3.0 5.6
7.6
0 0 0 0
2014 2016 2018 2020E 2014 2016 2018 2020E
Source: Gartner, Mirae Asset Daewoo Research Source: Gartner, Mirae Asset Daewoo Research
Mirae Asset Daewoo ResearchMay 14, 2020 Samsung Electronics
Figure 55. Mobile storage (eMMC MLC) spot price trend
(US$/GB) (%)
0.60 30
eMMC MLC QoQ (R)
eMMC MLC price (1GB eq., L)
15.8
0.45 15
6.4 6.2 5.6 4.8
3.9 4.1
1.5 1.6 1.8
0.30 0
-1.4
-4.3 -5.2 -5.8
-7.5 -6.4 -6.9 -6.6
-8.9
0.15 -10.7 -15
-12.5
-16.1
-16.9
0.00 -30
4Q14 3Q15 2Q16 1Q17 4Q17 3Q18 2Q19 1Q20
Source: Trendforce, Mirae Asset Daewoo Research
Figure 56. Mobile storage (eMMC, TLC) spot price trend
(US$/GB) (%)
0.40 30
eMMC TLC QoQ (R)
eMMC TLC price (1GB eq., L)
17.2
0.30 15
9.4
3.8 4.7 5.1
1.9 3.0
0.3 0.5
0.20 0
-1.6 -2.1
-5.2
-7.5 -6.0
0.10 -12.1 -15
-18.1 -17.4
-22.5
0.00 -30
1Q16 3Q16 1Q17 3Q17 1Q18 3Q18 1Q19 3Q19 1Q20
Source: Trendforce, Mirae Asset Daewoo Research
Figure 57. Smartphone NAND content per unit trend
(GB) (%)
Smartphone NAND content/unit (L)
200 56.0 60
YoY growth (R)
150 45
100 30
50 15
0 0
2015 2016 2017 2018 2019 2020F 2021F
Source: IDC, Mirae Asset Daewoo Research
Mirae Asset Daewoo ResearchAsia Strategy
Buy the two worst performing markets:
Indonesia and India
Time to buy the poorest performers on a two-year time horizon
Emerging markets have performed poorly during the course of the global COVID-19
Strategy Report pandemic, with foreign investors pulling money out and local currencies depreciating
against the US dollar. In Asia, the worst performers YTD (in US dollar terms) have been
May 13, 2020 Indonesia and India. While investors are rightfully worried about the business and
economic impacts of the pandemic, history has shown that stock markets and
currencies eventually rebound once crises subside. From this perspective, we have a
positive view on India and Indonesia. Admittedly, it may seem a bit early for such a
Mirae Asset Securities (HK) Ltd. recommendation, but we note that a return to pre-pandemic levels translates to
Joe Liew potential returns of 37% for the JCI and 31% for the Sensex from current levels.
+852-2514-1336
Recovery likely to come, albeit slightly later than in other markets
Joe.liew@miraeasset.hk
Two historical examples—the Asian financial crisis in 1997-98 and the 2008 global
financial crisis—can serve as a guide. In each case, markets in Asia fully recovered one to
PT. Mirae Asset Sekuritas two years after the initial declines. Of note, Indonesia is much stronger now than it was
Indonesia during the Asian financial crisis, with a banking system that is on more solid footing and
a political landscape marked by much lower uncertainty. In India, the government is
Hariyanto Wijaya
beginning to ease restrictions in recognition of the severe economic impact of continued
+62-21-5088-7056 lockdowns. Looking at China, Korea, and Hong Kong, which are further along on the
hariyanto.wijaya@miraeasset.co.id road to recovery, economic activity has picked up significantly over the last month. We
Anthony Kevin also see reason for optimism that a vaccine could be developed in a shorter-than-usual
+62-21-5088-7000 (ext. 165) time frame, given the sheer level of global attention and political will.
anthony.kevin@miraeasset.co.id
Local investors have been buying; smart money?
Foreign investors have been net sellers of Asian stock markets since March. Despite
Mirae Asset Capital Markets
the selling, markets have bounced off their lows (excluding a one-off drop on 23
(India) Pvt. Ltd. March), implying that local investors have been more than able to absorb the selling.
Achala P. Jethmalani As long as there are no shocks to the global financial system (a risk the Fed has
minimized by pumping trillions into the US financial system), we expect local buying
+91-22-6266-1370
(including in Indonesia and India) to continue, providing support to the market.
achala.jethmalani@miraeassetcm.com
Economic activity to trough in 2Q
Mirae Asset Daewoo Co., Ltd. We expect a trough in Indonesia’s and India’s economic activity to occur in 2Q,
Jay (Jaeil) Lee corresponding to the two countries’ peak enforcement of social distancing measures.
Globally, we think restrictions will be relaxed gradually toward the end of 2Q and into
+822-3774-1388
3Q. We project Indonesia’s GDP to contract 1.5% YoY in 2Q before rebounding in 3Q
Jay_lee@miraeasset.com
(+1.5%) and 4Q (+4.5%), and we see India’s GDP falling 5.0% YoY in 2Q before
improving in 3Q (-1.5%) and 4Q (+5.2%). For buy ideas from our research team in
Indonesia, please refer to pages 12-13. For exposure to the Indian market, we would
advise selecting an Indian ETF (e.g., INDY US).
Key risk
The key risk remains the possibility of an especially deep and protracted global
recession caused by COVID-19. This would adversely affect demand for exports out of
Asia as well as global commodity prices.
Economic growth in India and Indonesia to trough in 2Q20
(%)
YoY GDP growth
9 Indonesia India
6
3
0
-3
-6
1Q19 3Q19 1Q20 3Q20F
Source: Bloomberg, Mirae Asset Sekuritas Indonesia Research, Mirae Asset Capital Markets (India) Research
Analysts who prepared this report are registered as research analysts in Hong Kong, Korea, India, or Indonesia, but not in any other
jurisdiction, including the US. PLEASE SEE ANALYST CERTIFICATIONS AND IMPORTANT DISCLOSURES & DISCLAIMERS IN APPENDIX 1 AT THE END
OF THE REPORT.YG Entertainment
(122870 KQ)
Lineup is back, but concerts come to a halt
Entertainment
1Q20 review: Widely anticipated weakness
For 1Q20, YG Entertainment announced consolidated revenue of W52.8bn (-18.3% YoY;
Company Report all growth figures hereafter are YoY) and an operating loss of W2.1bn (remaining in the
May 14, 2020 red). Fewer artist activities and poor subsidiary earnings were mainly to blame for the
quarterly loss. That said, the weakness stemming from the company’s artist void was
widely anticipated.
At the parent level, the company posted operating profit of W1.9bn (-33.2%).
Elsewhere, losses from YG PLUS (W2.2bn), YGX (dance academy), and YG Japan totaled
(Downgrade) Trading Buy W4bn. Looking at core businesses, album/digital music sales and management
revenue fell 12% and 15.2%, respectively. The company recorded 120,000 copies of
Target Price (12M, W) ▼ 36,000 album sales and recognized concert income from WINNER’s Asia tour and BLACKPINK’s
Japan dome tour (partial). On the non-operating side, the company booked W4.5bn in
valuation losses on securities (Tencent Music Entertainment, etc.).
Share Price (05/13/20, W) 30,650
Lineup is back, but monetization faces challenges
Expected Return 17% Big Bang has finally made its comeback. After a busy global schedule in 2H19,
BLACKPINK looks ready to make its return. The new group Treasure’s debut also
appears imminent. The active presence of five groups with the potential to attract
OP (20F, Wbn) 2
arena-level attendance and the liquidation of loss-making businesses are all positives
to the company.
Consensus OP (20F, Wbn) 18
However, the COVID-19 outbreak has brought concerts to a complete halt, putting a
EPS Growth (20F, %) - break on the company’s artist monetization. Over the past five years, concerts
Market EPS Growth (20F, %) 28.1 (excluding those in Japan) accounted for 13.9% of overall revenue. Further including
P/E (20F, x) 108.3 royalties from Japanese concerts (17.2% of revenue), which directly translate into
profits, concerts represent a significant portion of the company’s revenue.
Market P/E (20F, x) 12.8
KOSDAQ 691.53 Suspension of tours is worrying, given ties to album releases
Because the biggest appeal of concerts is the “liveness” of the experience, we think
Market Cap (Wbn) 558
technology advancements are unlikely to completely fill the gap. We thus believe
Shares Outstanding (mn) 18 entertainment agencies need to focus on propping up other existing revenue sources
Free Float (%) 65.7 (album/digital music/TV appearances), while also taking steps that can boost the
Foreign Ownership (%) 15.8 expected returns on concerts once things get back to normal. However, recent
concerns over a second outbreak suggest the return of live concerts could be further
Beta (12M) 0.80 pushed back. Given that new album releases are typically tied to tour schedules,
52-Week Low 19,450 uncertainties surrounding concerts could lead to a prolonged slump in album releases.
52-Week High 35,850 As of now, Lady Gaga’s new album (which features BLACKPINK) will be released in May,
while Treasure’s debut album is set to come out in July.
(%) 1M 6M 12M
Absolute 9.5 20.0 -8.6
Downgrade to Trading Buy and cut TP to W36,000
Relative -5.5 14.8 -6.4 We cut our target price on YG Entertainment by 10% to W36,000, as we revised down
our 2021F net profit by 10% in light of the uncertainties related to concerts. Due to the
110 YG Entertainment KOSDAQ
reduced upside potential, we downgrade our rating to Trading Buy.
100
We continue to favor YG Entertainment over the other two major entertainment
90 agencies, as we believe the company stands to benefit the most from an improvement
80 in Korea-China relations, given Big Bang/BLACKPINK’s significant presence in China (as
70 demonstrated by recent ads and TV appearances). We are also bullish on the
60 company’s expanding lineup and potential for success in North America (through
50
partnerships and YouTube). For these reasons, we believe the company merits a higher
5.19 9.19 1.20 5.20 valuation. That said, the delays in earnings improvement due to COVID-19 are a
concern. We recommend taking a trading approach, paying attention to both potential
improvements in Korea-China relations and risks of a second wave of infections.
Mirae Asset Daewoo Co., Ltd.
[Media] FY (Dec.) 12/16 12/17 12/18 12/19 12/20F 12/21F
Revenue (Wbn) 322 350 269 264 237 311
Jeong-yeob Park
+822-3774-1652 OP (Wbn) 32 24 20 1 2 31
jay.park@miraeasset.com OP margin (%) 9.9 6.9 7.4 0.4 0.8 10.0
NP (Wbn) 19 18 18 -22 5 26
EPS (W) 1,094 931 911 -1,118 283 1,438
ROE (%) 7.7 5.7 5.1 -6.2 1.5 7.4
P/E (x) 25.9 31.0 52.2 - 108.3 21.3
P/B (x) 1.8 1.6 2.6 1.5 1.6 1.5
Dividend yield (%) 0.7 0.5 0.3 0.0 0.0 0.0
Note: All figures are based on consolidated K-IFRS; NP refers to net profit attributable to controlling interests
Source: Company data, Mirae Asset Daewoo Research estimates
Analysts who prepared this report are registered as research analysts in Korea but not in any other jurisdiction, including the U.S.
PLEASE SEE ANALYST CERTIFICATIONS AND IMPORTANT DISCLOSURES & DISCLAIMERS IN APPENDIX 1 AT THE END OF REPORT.You can also read