Office of the Commissioner-General for Sustainable Development - Key figures on climate France, Europe and Worldwide - Observation ...
←
→
Page content transcription
If your browser does not render page correctly, please read the page content below
D A
                           T                    A
       L                  A                     B
Office of the Commissioner-General for Sustainable Development

Key figures on climate
France, Europe and Worldwide
EDITION 2018
summary
                               Key figures on climate
                               France, Europe and Worldwide

      05 - What is climate change?
            This part summarizes the scienti c basis of climate change, including indicators, causes and
            possible consequences of global warming.

      21 - Which amounts of greenhouse gases are
           emitted globally?
            The focus here is on the most relevant data related to global greenhouse gases (GHG)
            emissions, in particular the geographic distribution of these emissions.

      33 -How much greenhouse gas is emitted
           in Europe andin France?
            A complete overview of GHG emissions statistics in Europe and in France is
            presented in this part as well as estimates of the carbon footprint of French people.

      41 - What is the sectoral distribution of GHG emissions
            in Europe and in France?
            This part features the detailed evolution since 1990 of GHG emissions in the following
            economic sectors: energy sector, transports, industry, residential and tertiary,
            agriculture, forestry, land use and waste management.

      53 - Which climate policies in the world,
            in Europe and in France?
            The main climate policies are described at each level: global, European and French.

Document edited by:
Service de la donnée et des études statistiques (SDES)

  2 – Key figures on climate – France, Europe and Worldwide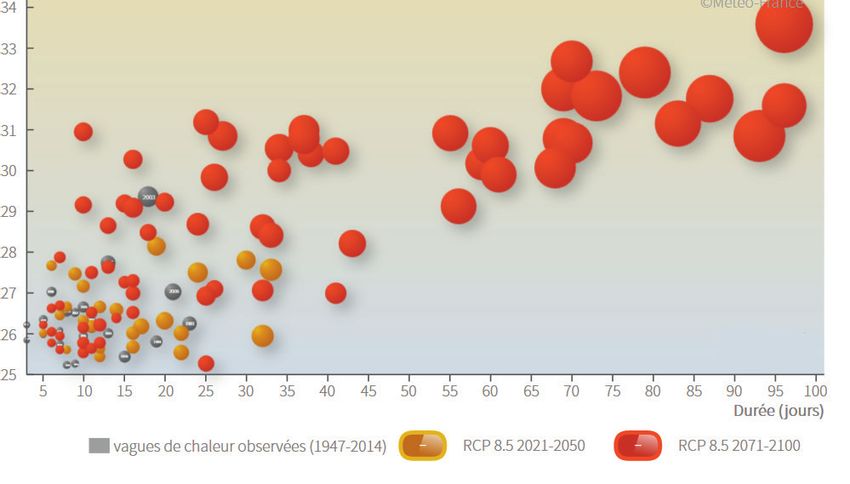
contributors

                           MB
               Manuel Baude
               Mtes-CGDD-SDES
               manuel.baude@
               developpement-durable.gouv.fr

                        FXD                                     ME
               François-Xavier
               Dussud                            Mathieu Ecoiffier
               Mtes-CGDD-SDES                    Mtes-CGDD-SDES
               francois-xavier.dussud@           mathieu.ecoiffier@
               developpement-durable.gouv.fr     developpement-durable.gouv.fr

                               JD                                CV
               Jérôme Duvernoy                   Charlotte Vailles
               Mtes-DGEC-ONERC                   I4CE-Institute for
                                                 Climate Economics
               jerome.duvernoy@
               developpement-durable.gouv.fr     charlotte.vailles@i4ce.org

                  Key figures on climate – France, Europe and Worldwide – 3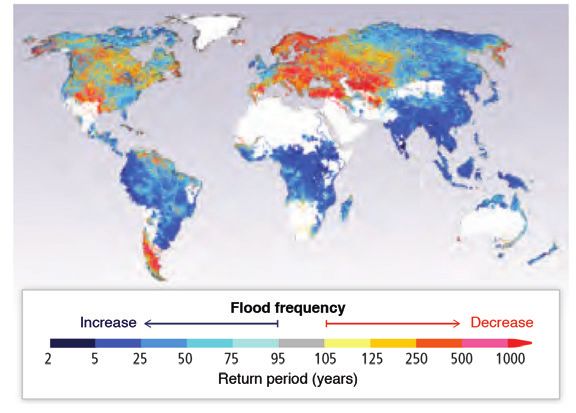
Foreword

                    n line with previous years, the 2018 edition of

      I
                    “Key figures on climate” has been written in the
                    context of the 22nd Conference of the Parties
                    on Climate Change (COP 22) held in Bonn from
                    6 to 17 November 2017.

This latest version was updated relative to the 2017 edition. New
data sources have been used for emissions factors and the part
on the carbon footprint was futher developed. The part on climate
policies notably deals with the Paris Agreement adopted in
December 2015 at COP 21. Several data sets, displayed in graphs
in this document are also available in tables on the web version.

— Sylvain Moreau
HEAD OF DEPARTMENT, SDES

  4 – Key figures on climate – France, Europe and Worldwide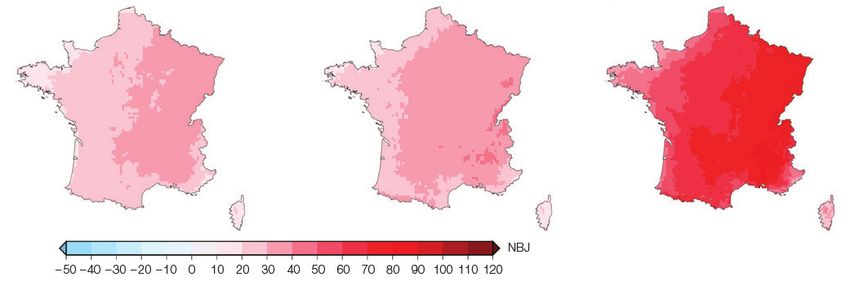
part 1

What is climate
change?

— The concept of global warming refers to a sustainable increase of the
planet average temperature. Additionally to the average sea level which
has increased by more than 15 cm since 1900, numerous other
indicators illustrate this warming.
The conclusions of the scientific community and notably of the
International Panel on Climate Change (IPCC) meet general consensus
on the causes of climate change. The natural climate balance is
disrupted by anthropogenic GHG emissions (see glossary). The CO2
atmospheric concentration – the main GHG – has increased by more
than 40% since 1750, reaching the symbolic level of 400 parts per
millions in 2015. Projections show that global warming could have a
severe impact on sea levels or extreme weather events in the future.

                            Key figures on climate – France, Europe and Worldwide – 5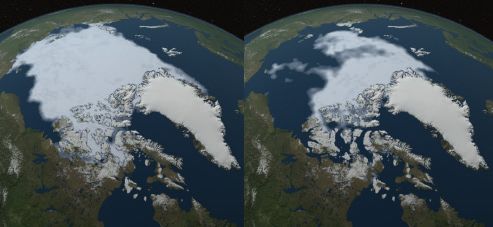
part 1: What is climate change?

Climate change observations

GLOBAL SURFACE TEMPERATURE CHANGE FROM 1850 TO 2016

                                            1.2

                                              1
Temperature deviation (°C) Ref 1961-1990

                                            0.8

                                            0.6

                                            0.4

                                            0.2

                                              0
                                               1850 1860 1870 1880 1890 1900 1910 1920 1930 1940 1950 1960 1970 1980 1990 2000 2010
                                           - 0.2

                                           - 0.4

                                           - 0.6

                                           - 0.8
                                                    NOAA MLOST           NASA GISS         HadCRUT4          Ten-year average
                                                                                                             for the three data series

Source: NASA, NOAA, Hadley Center

The increase in global average temperatures is very clear. The difference
from the 1961-1990 reference period is far below zero until 1940, mostly
negative until 1980, then the warming becomes more acute and the
difference has almost always been positive since the early 1980’s. The
decade 2001-2010 was 0.21°C warmer than the decade 1991-2000 and
was 0.48°C warmer than the 1961-1990 average. The year 2016, with an
average temperature 1.1°C over pre-industrial levels, ranks first among the
hottest years since 1850 on a global scale.

                                6 – Key figures on climate – France, Europe and Worldwide
part 1: What is climate change?

GLOBAL AVERAGE SEA LEVEL CHANGE COMPARED TO
THE REFERENCE PERIOD 1900-1905
     200
              Church and White (2011)
     150      Jevrejeva et al. (2008)
              Ray and Douglas (2011)
              Neremet al. (2010) Satellite measurements
     100      Uncertainty
mm

      50

       0

     – 50
       1900         1920           1940               1960       1980           2000    2010
Source: IPCC, Working Group I, 2013

The global average sea level rose by 1.7 ± 0.3 mm/yr over the period 1901-2010.
The rise has been greater in recent decades, reaching 3.2 ± 0.4 mm/yr over the
period 1993-2010.
ICE MELTING IN THE ARCTIC
Arctic from space in summers: left 1984, right 2012

Source: NASA, 2013

Arctics warms faster than other regions of the earth. In 2012, the minimum
Arctic sea ice area was around half of the minimun area recorded in the 80’s.
Melting of continental ice in Greenland has doubled since the 90’s , with a
total average loss of 250 billion tons from 2005 to 2009, contributing to global
sea level rise.

                                          Key figures on climate – France, Europe and Worldwide – 7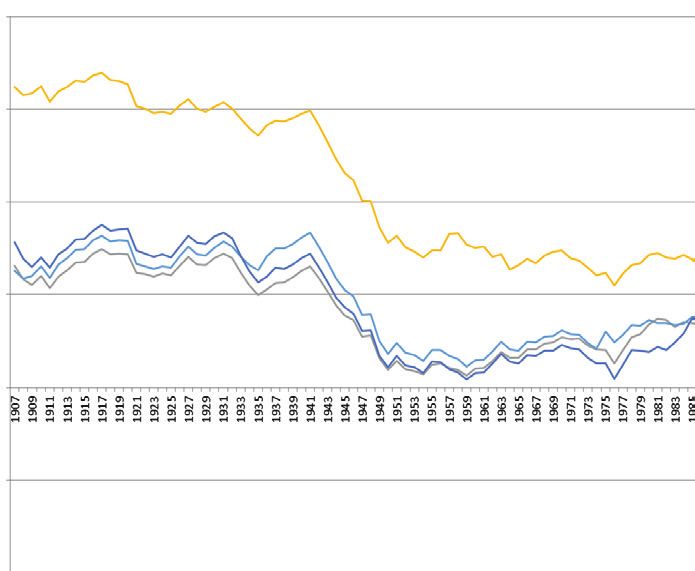
part 1: What is climate change?

EVOLUTION OF THE AVERAGE TEMPERATURE IN METROPOLITAN FRANCE

     2,5

       2

     1,5

       1

     0,5
°C

       0

  -0,5

      -1

  -1,5
       00
            05
                 10
                      15
                           20
                                25
                                     30
                                          35
                                               40
                                                    45
                                                         50
                                                              55
                                                                   60
                                                                        65
                                                                             70
                                                                                  75
                                                                                       80
                                                                                            85
                                                                                                 90
                                                                                                      95
                                                                                                           00
                                                                                                                05
                                                                                                                     10
     19
           19
                19
                     19
                          19
                               19
                                    19
                                         19
                                              19
                                                   19
                                                        19
                                                             19
                                                                  19
                                                                       19
                                                                            19
                                                                                 19
                                                                                      19
                                                                                           19
                                                                                                19
                                                                                                     19
                                                                                                          20
                                                                                                               20
                                                                                                                    20
                      Deviation from the average temparature reference (1961-1990)
                      Eleven-year moving average from Y-5 to Y+5

Source: Météo-France, 2017

As worldwide, the average temperature change in metropolitan France has
shown a clear warming since 1900. The speed of this warming has been
variable with a particularly pronounced increase since 1980. 2016 is again
a warm year, 0.5°C above the reference 1981-2010 average. However, 2016
was not unusually hot in metropolitan France, it is the 10th warmest years
on record since 1900, far behind 2014 (+1,2°C), 2011 (+1,1°C) et 2015
(+1,0°C).

     8 – Key figures on climate – France, Europe and Worldwide
part 1: What is climate change?
EXTREME WEATHER EVENTS
A weather event (tornadoes, hurricanes, heat waves, heavy rainfalls) is
classified as extreme when it significantly exceeds reference levels. Climate
change modifies the frequency, intensity, scale, duration and time of
occurrence of extreme events. It can push the characteristics of these events
to unprecedented levels.
Heat waves in France - 1947-2016 period
32
31
Daily maximum temperatures
30
2003
29
28 1947
1998
27 1990 2006
1975
1952 2015
2012
1995 1983
26 1947 1989
2003 1994
2013
2005
2016
2013 2004 1994 1976
1959
25 1964 1945 2010 2009 1995
24
0 5 10 15 20 25
Duration (days)
1947-1981 : 7 events 1982-2016 : 17 events
Note: the surface of each circle represents the intensity of the heat wave, which depends on
its duration and its maximum temperature
Source: Météo-France, 2017
At the French national level, the heat waves recorded since 1947 were twice
as many over the last 34 years than over the previous period. This trend is
also shaped by the occurrence of more severe events (duration, intensity
overall) in recent years. Thus, the 4 longest heat waves and 3 among the
4 most intense waves occurred after 1981. The heat wave observed in France
from 2 to 9 August 2003 is by far the most significant event over the
observation period.
Key figures on climate – France, Europe and Worldwide – 9part 1: What is climate change?
CHANGE IN THE MASS OF THE MAIN FRENCH GLACIERS
Cumulated mass balance (equivalent water meters)
40,00
30,00
20,00
10,00
0,00
-10,00
-20,00
-30,00
Ossoue Gebroulaz Argentière Saint-Sorlin Mer de glace
Sources: Association Moraine and Laboratoire de Glaciologie et Géophysique de
l’Environnement - LGGE (CNRS – UJF - OSUG), 2017
Glacier retreat is a common phenomenon across the main French mountains
since 1990. However, glacial melting did not occur evenly throughout this
period, with two phases of sharp decline: 1942-1953 and from 1985
onwards, separated by a period of relative stability. The significant loss of
glacier mass recorded since 1982 is the result of a very significant
increase in summer melting. This mass loss has become more pronounced
since 2003.
This indicator illustrates the two aspects of climate variability: Short-term
climate fluctuation (on a yearly basis) and long-term climate change (on a
decade basis). The latter aspect allows for the observation of climate
change.
10 – Key figures on climate – France, Europe and Worldwidepart 1: What is climate change?
Climate change causesGreenhouse effect 1.5
NATURAL GREENHOUSE EFFECT AND ITS PERTURBATIONS BY HUMAN
Role of the atmosphere in the natural greenhouse effect
ACTIVITIES
Current energy flows in W/m2 Actual energy flows in W/m2
Solar
radiation
340
100
76
Reflected radiation
239
Outgoing radiation
Radiation absorbed
by the atmosphere
79 Aerosol-cloud interactions Chemical
reactions
Greenhouse
Aerosols Chemical Clouds Ozone gases / Major
reactions aerosols
185
Evapotranspiration Back
84 radiation
Gas and aerosol
24 342 emissions
Ice / snow cover 398
Radiation
161 emitted from
the surface
Radiation absorbed 20
by the surface Sensible
heat Vegetation
changes
Colour of the ocean Changes in
surface albedo
Net absorption 0,6
Sunlight
Sunlight provides
provides the
the earth earth
with with
energy. Part energy. Part
of this energy of thisor energy
is directly is directly
indirectly reflected backor indirectly
towards reflected
space, while back
the majority is
towardsbyspace,
absorbed while or
the atmosphere the
themajority is absorbed
earth's surface. by the
The temperature atmosphere
at the earth's surfaceorat by
any the earth’s
one time is duesurface. The
to the presence
of GHGs that reradiate the majority of surface radiation to the earth.
relatively warm temperatures at the earth’s surface are due to GHGs that reradiate most of the
Source: IPCC, Working Group I, 2013
surface radiation back to the earth.
Source: IPCC, Working group I, 2013
Human activity and the greenhouse effect
Higher anthropogenic GHG emissions in the atmosphere increase the
amount
> of energy reradiated
Higher anthropogenic to theinearth.
GHG emissions This results
the atmosphere in antheimbalance
increase in the
amount of energy
system, to
reradiated which causes
the earth. the rise
This results ofimbalance
in an the global temperatures.
in the A change
system, which causes in
the land
radiation caused
temperature to rise. by a substance, compared to a reference year, is called
radiative
> A changeforcing. A positive
in radiation caused byradiative forcing
a substance, value indicates
as compared a positive
to a reference year, is
contribution
called radiative to global
forcing. warming.
A positive Theforcing
radiative total anthropogenic radiative
value indicates a positive forcing
contribution
to
wasglobal warming.
+ 2.55 ± 1.1 W/m2 in 2013 compared to 1750.
> Some human activities such as aerosol emissions contribute to a reduction in the energy
reradiated to the earth. In 2013, thisKey
negative
figuresradiative forcing
on climate was
– France, estimated
Europe to be -–0.45
and Worldwide 11
± 0.5 W/m2 compared to 1750, while the radiative forcing from anthropogenic GHGs was
+ 2.90 ± 0.29 W/m2. Overall anthropogenic radiative forcing was thus + 2.55 ± 1.1 W/m2part 1: What is climate change?
GREENHOUSE GASES
Water vapor excepted, GHGs make up less of 0.1% of the atmosphere.
Water vapor, whose concentration in the atmosphere varies between 0.4%
and 4% in volume, is the main GHG. Anthropogenic activities have little
impact on the variations of its concentration but they have a strong impact
on the concentration of other GHGs.
CO2 CH4 N2O HFC PFC SF6 NF3
Atmospheric
concentration
397 ppm 1 823 ppb 327 ppb > 157 ppt > 6,5 ppt 8,2 ppt
2014 (in 2005 < 1 ppt
(379 ppm) (1 774 ppb) (319 ppb) (> 49 ppt) (> 4,1 ppt) (5,6 ppt)
between
brackets)
Global Warming
[1,4; 6 630 ;11
potential (total 1 28-30 265 23 500 16 100
14 800] 100]
over 100 years)
Landfills, Agriculture,
Fossil fuels
agriculture, industrial Manufacture
Anthropogenic combustion Aerosols, refrigeration,
livestock and processes, of electronic
sources and tropical aluminium smelting
industrial use of components
deforestation
processes fertilizer
Change in
radiative
forcing due to
anthropogenic
emissions in + 1,91 + 0,50 + 0,19 + 0,12
2014 since (+1,66) (+0,48) (+0,16 (+0,09)
1750 (W / m²)
(in 2005
between
brackets)
Global warming potential (GWP, see glossary) is the ratio between the
amount of energy reradiated to the earth by 1 kg of a gas over 100 years and
the amount that 1 kg of CO2 would reradiate. It depends on the gases’
concentrations and lifetimes. For example, 1 kg of CH4 and between 28 and
30 kg of CO2 will warm up the atmosphere by the same amount over the
century following their emission. While CO2 is the gas with the lowest global
warming potential, it is also the one that has contributed the most to global
warming since 1750, because the significant amounts emitted.
12 – Key figures on climate – France, Europe and Worldwidepart 1: What is climate change?
Carbon stocks and GHG flows: the case of CO2 1.7
CARBONCO
Simplified STOCKS AND GHG FLOWS: SIMPLIFIED CO2 CYCLE IN THE
2 cycle in the 2000s
2,000S
+ 880D
B2,160
phere
Atmos Land us and
e
Volcan
ism
s
fuel change tion < 0.4
Fossil n seques
tra
stio
combu ent in so ils
m
and ce
tion
produc
28.6 6.2
2.6 5.5
8.4
Ocean
B142,000 e
Biospher 17,000 - 110D
+ 568D B13,000
–
rves ng:
fuel rese ] includi
Fossil - 1,375
– 7,100
[3,700 ]
[1,40 0 – 4,200
Ga s ]
entatio
n – 1,000
Sedim Oil [600 00]
,600 – 2,0
Coal [1
Units:
Flows: GtCO2e/yr
Stocks: GtCO2e
This
This graph
graph shows:shows: (i) brackets,
(i) in square in square brackets,
the size of carbon the size
stocks of carbontimes
in pre-industrial stocks in pre-industrial
in billions times in
of tonnes of CO2 equivalent in billions
black and their change over the period 1750-2011 in red; (ii) as arrows, carbon flows between the stocks in billions of tonnes of
of CO2 tonnes
CO2 equivalent
equivalent in black and their change over the period 1750-2011 in red; (ii) as arrows,
per year. Pre-industrial flows are shown in black. Those from the development of anthropogenic activities between
carbon
2000 flows
and 2009 between
are shown in red. the stocks in billions of CO2 tonnes equivalent per year. Pre-industrial flows
are shown in black. Those from the development of anthropogenic activities
Source: according between
to IPCC, Working 2000
Group and 2009
I, 2013
are shown in red.
Source: based on IPCC, Working Group 1, 2013
> Four large reservoirs allow carbon to be stored in various forms:
Four large- reservoirs
Atmosphere: allow carbon
gaseous COto
2; be stored in various forms:
- Atmosphere: gaseous
- Biosphere: CO2matter
organic ; from living things including forests;
- Biosphere: organic
- Ocean: matterdissolved
limestone, from living
COthings
2; including forests;
- Subsurface:
- Ocean: limestone, rocks, sediment,
dissolved CO2; fossil fuels.
> Carbon flows between these reservoirs constitute the natural carbon cycle, which is
- Subsoil: rocks, sediment, fossil fuels.
disrupted by anthropogenic emissions of CO2 that change the amounts exchanged or
Carbon flows between these reservoirs make up the natural carbon cycle, which has
create new flows. E.g.: combustion of fossil organic carbon stocks.
been disrupted by anthropogenic emissions of CO2 thatfrom
> In the 2000s, of the 340 Gt of CO2 released by human activities
change the amounts
the biosphere
exchanged
and lithosphere,orthe
create new flows,
atmosphere such
absorbed asand
160 thethecombustion
oceans 90. of fossil
The organiciscarbon
atmosphere
stocks.
the reservoir most affected by anthropogenic activities: the quantity of carbon stored has
increased by nearly 40% compared to pre-industrial levels.
Key figures on climate – France, Europe and Worldwide – 13
11part 1: What is climate change?
IMBALANCE BETWEEN EMISSIONS AND CO2 STORAGE CAPACITY
Net annual CO2 flows towards the atmosphere by source and reservoir over the period 2000-2009
35
30
Uncertainty
25
20
Gt CO 2 / yr
15
10
Land Ocean
5 reservoirs
reservoirs
- 9.5 - 8,4
0
Fossil fuel Land use Net flows
–5 combustion change to the
and cement 4.0 atmosphere
– 10 production 14.7
28.6
– 15
– 20
Source: IPCC, Working Group I, 2013
In the 2000s, of the 32.6 Gt of CO2 annually released by human activities,
the atmosphere absorbed 14.7, land reservoirs (biosphere and subsoil) 9.5
and the oceans 8.4. The atmosphere is the reservoir most affected by
anthropogenic activities: the amount of carbon stored increased by nearly
40% compared to pre-industrial levels.
14 – Key figures on climate – France, Europe and Worldwidepart 1: What is climate change?
ROLE OF FORESTS IN THE CO2 CYCLE
On a global scale, the biosphere is a net carbon reservoir mainly from forests,
which concentrate 80% of the aboveground biomass and 50% of land-based
photosynthesis. Sequestrations from the biosphere counterbalances around 19%
of annual anthropogenic GHG emissions, about 10 GtCO2e (Dixon et al., 1994;
Beer et al., 2010; IPCC, 2013; Canadell et al., 2007).
Deforestation causes GHG emissions through the combustion and
decomposition of organic matter. These gross emissions account for 12% of GHGs
from anthropogenic sources (IPCC, 2013).
In France, the net carbon sequestration in forest biomass is estimated to be
around 50 Mt CO2, or 12% of national fossil carbon emissions (excluding LULUCF,
see glossary).
ATMOSPHERIC CO2 CONCENTRATION
460
440
CO 2 mole fraction (ppm)
420
400
380
360
340
320
300
1985 1990 1995 2000 2005 2010 2015
Year
Source: WDCGG under the authority of the WMO
Since the development of industry, land and ocean reservoirs have absorbed
half of anthropogenic emissions. The remaining emissions are still in the
atmosphere, leading to an increase in the atmospheric concentrations of
GHGs. In 2015 and for the first time, atmospheric CO2 concentation,
averaged on a global scale, reached the symbolic and significant threshold
of 400 parts per million (ppm).
Key figures on climate – France, Europe and Worldwide – 15part 1: What is climate change?
Scenarios et climate projections
PROJECTION OF EMISSIONS FROM FOSSIL FUELS ACCORDING TO
THE IPCC'S FOUR REPRESENTATIVE CONCENTRATION PATHWAYS (RCP)
30
Historical
25
RCP2.6 pathway
20 RCP4.5 pathway
RCP6.0 pathway
15 RCP8.5 pathway
Gt CO2
10
5
0
–5
1850 1900 1950 2000 2050 2100
Year
Source: IPCC, Working Group I, 2013
The IPCC published its First Assessment Report in 1990. Its fifth report (AR5)
was published in its entirety end of 2014. For each publication, the IPCC
communicates climate projections based on assumptions for the
concentration of GHGs.
For the AR5, four Representative Concentration Pathways (RCP) were
defined: RCP2.6; RCP4.5; RCP6.0; RCP8.5, from the most optimistic to the
most pessimistic, named after a possible range of radiative forcing values
in the year 2100 relative to pre-industrial values (RCP8.5 corresponds to a
situation with a radiative forcing of 8.5 W/m² in 2100.)
These pathways correspond to more or less drastic efforts to reduce
global GHG emissions. Climate simulations and socio-economic scenarios
are drawn up from these projections.
16 – Key figures on climate – France, Europe and Worldwidepart 1: What is climate change?
EVOLUTION OF TEMPERATURES AND SEA LEVELS IN THE IPCC’S
CONCENTRATION PATHWAYS (RCPS)
Global average surface temperature change (relative to 1986–2005)
6.0
Mean over 2081-2100
Historical
6.0
4.0 RCP2.6 Mean over 2081-2100
Historical
RCP4.5
4.0 RCP2.6
RCP6.0
RCP4.5
°C
2.0 RCP8.5
RCP6.0
°C
2.0 RCP8.5
0
0
– 2.0
1950 2000 2050 2100
– 2.0
Source: IPCC, Working Group
1950 2000 I, 2013 2050 2100
1.0mean sea level rise (relative to 1986–2005)
Global
1.0 RCP2.6 Mean over 2081-2100
0.8
RCP4.5
RCP2.6 Mean over 2081-2100
0.8
0.6 RCP6.0
RCP4.5
(m) (m)
RCP8.5
0.6 RCP6.0
0.4
RCP8.5
0.4
0.2
0.2
0.0
2000 2020 2040 2060 2080 2100
0.0
2000 2020 2040 2060 2080 2100
Source: IPCC, Working Group I, 2013
Sea level rise is mainly caused by ocean thermal expansion and the melting
of land-based ice (glaciers, polar ice caps…).
Sea level rise will probably cause massive migration flows, as over one
billion people live in low-lying coastal areas.
Despite progress in recent years, ice melting forecast models still have
wide margins of uncertainty.
Key figures on climate – France, Europe and Worldwide – 17part 1: What is climate change?
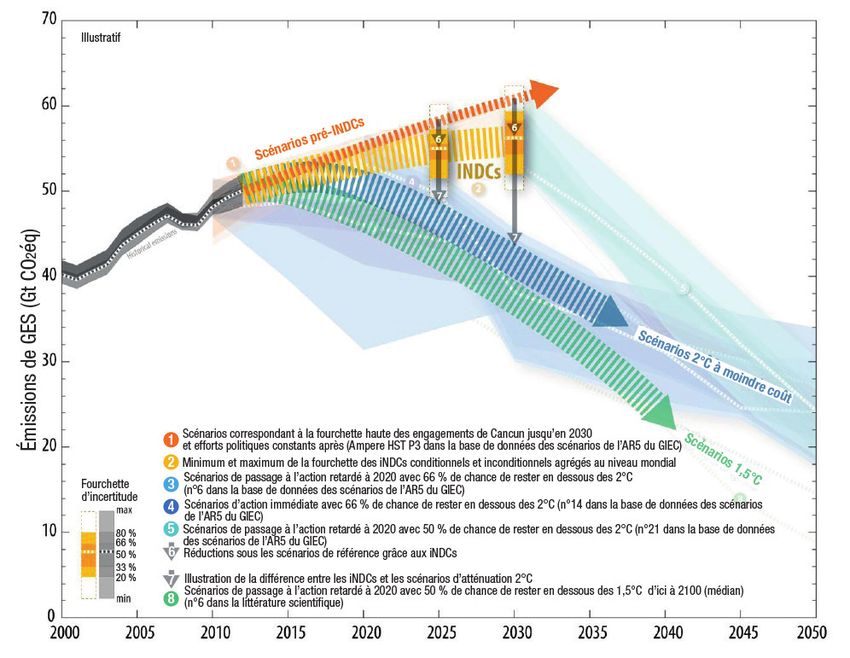
CARBON BUDGETS AND TEMPERATURE RISE
Amont the four IPCC’s concentration pathways, only the most ambitious,
RCP 2.6, has a probability higher than 50% to limit the temperature rise to
2°C in 2100. The most conservative pathway RCP 8.5 has more than 50%
chance of leading to a temperature rise higher than 4°C.
Carbon budget limiting to 2°C the raise in global temperatures
Remaining
carbon
budget from Cumulated
2012 CO2
35% emissions
between
1870 and
2011
Total carbon budget giving a 66% probability to limit the raise in
global temperatures to 2°C compared to pre-industrial levels :
2,900 GtCO2
Source: I4CE, based on IPCC, Working Group I
A carbon budget is the maximum amount of carbon that can be released
into the atmosphere while keeping a reasonable chance of staying below a given
temperature rise.
IPCC’s simulations indicate that to have a probability higher than 66% to
limit the raise in global temperatures to 2°C compared to pre-industrial levels,
cumulated CO2 emissions should be lower than 2,900 GtCO2. Between 1870
and 2011, human activities already emitted 1,890 GtCO2, which leaves a
remaining carbon budget of 1015 Gt CO2 from 2012. Taking into account CO2
emissions between 2012 and today, the carbon budget which would give a 66%
probability to limit the raise in global temperatures to 2°C will be exhausted within
around 20 years, with current levels of CO2 emissions.
The combustion of all current fossil fuel reserves would emit an amount of
CO2 much higher (3 to 5 times) than the carbon budget consistent with the 2°C
limit (BP, 2017).
18 – Key figures on climate – France, Europe and Worldwidepart 1: What is climate change?
CONSEQUENCES ON A GLOBAL SCALE
Change in river flood frequency in the world in the 2080’s, based on the RCP 8.5 scenario
Note: change in the return period (years) for the 20th-century 100-year flood.
Source: IPCC, Working Group II, 2013
According to the most pessimistic IPCC scenario (RCP 8.5), during the 21st
century, river floods frequency will significantly increase in tropical areas (South
America, Central Africa, South and South-East Asia). In some regions, the most
severe floods, which used to occur every 100 years, could arise every 5 years.
Combined with population growth, theses changes could greatly increase the
impacts of floods on populations.
Global exposure to the 20th-century 100-year flood according to several IPCC scenario
(return period ≥100 years) (millions of people)
Historical Projected
150
Mean ±1Std Dev
Historical
RCP8.5
100
RCP6.0
RCP4.5
RCP2.6
50
0
1980 2000 2020 2040 2060 2080 2100
Source: IPCC, Working Group II, 2013
Key figures on climate – France, Europe and Worldwide – 19part 1: What is climate change?
CONSEQUENCES FOR FRANCE
Number of additional days with abnormally high temperatures in the future (IPCC1s RCP 4.5, 2014)
Short-term outlook Medium-term outlook Long-term outlook
2021-2050 2041-2070 2071-2100
Source: Drias les futurs du climat, 2014
Heat waves: Observations and climate projections for two time frames (IPCC RCP scenarios)
Temperature
Observed heat waves (1947-2014) RCP 8.5 2021-2050 RCP 8.5 2071-2100
Source: Météo-France, Climat HD, 2017
In France, the intensity and frequency of heat waves are expected to increase
in the 21st century with a differentiated pace between the near future (2021-2050)
and the end of the century (2071-2100). As a first step, the frequency of the
events is projected to double around mid-century.
20 – Key figures on climate – France, Europe and Worldwidepart 2 Which amounts of greenhouse gases are emitted globally? — Anthropogenic GHG emissions reached 54 Gt CO2e in 2013, with CO2 emissions accounting for around 73% of this total. Global CO2 emissions (excluding LULUCF) increased by more than 58% between 1990 and 2014, with trajectories very different depending on the countries. China is the biggest world emitter in 2015 with close to 30% of the total. When it comes to per capita CO2 emissions, the situation is different. In countries such as the United States or Saudi Arabia, per capita emissions - more than 16 t CO2 per year - are among the highest, while France is around the world average with emissions per capita around 5 t CO2. Remarkably, 2015 saw a stabilization of global emissions, for the first time in 20 years it happened while the economy continued to grow.
part 2: Which amounts of greenhouse gases are emitted globally?

Global overview of GHG emissions
GLOBAL DISTRIBUTION OF GHG EMISSIONS (INCLUDING LULUCF) BY
GAS IN 2010

As %
         Based on global warming potential                     Based on global warming potential
                    at 20 years                                          at 100 years
                          F-gases                                                F-gases
                        PFC + HFC + SF6                                        PFC + HFC + SF6
                    N2O      (2)                                         N2O        (2)
                   (4)                                                    (5)

                                                           CH 4
                                                           (20)

        CH4
       (42)

                                             CO 2                                               CO2
                                             (52)                                              (73)

CO2: Carbon dioxide; N2O: Nitrous oxide; CH4: Methane; HFCs: Hydrofluorocarbons; PFCs:
Perfluorocarbons;
SF6: Sulphur hexafluoride

Source: based on IPCC, Working Group III, 2014

The Global Warming Potential (GWP) of a gas depends on the period over which
it is calculated (see page 12). The GWP of methane is equal to 28 to 30 when
calculated over 100, and is equal to 84 when calculated over 20 years. The GWP
over 100 years is usually used in GHG emissions inventories. This metric lends
more weight to persistent gases than to gases with a short lifetime. The use of
the potential over 20 years shows the importance of methane emissions at this
time frame.
      The emissions of the six GHGs initially covered by the Kyoto Protocol
increased by 80% since 1970 and by 45% since 1990, reaching 49 GtCO2e
in 2010 and 54 GtCO2e in 2013.

  22 – Key figures on climate – France, Europe and Worldwide
part 2: Which amounts of greenhouse gases are emitted globally?
REGIONAL DISTRIBUTION OF GHG EMISSIONS PER CAPITA IN 2012
(INCLUDING LULUCF)
tCO2e/cap
25
North America 13.9 %
Japan, South Korea, Australia and New Zealand 5.7 %
20
Europe and former URSS excl. EU 8.2 %
15
Central and Sourth America 10.9%
10
Middle-East 4.6%
Other Asia
5 China 24.3% EU 28 and Oceania 6.9%
8.9% Africa India 5.7%
10.8%
0
0 1 2 3 4 5 6
Sources: I4CE based on JRC EDGAR and World Bank, 2015
In 2012, average emissions per capita in North America are more than eight times
higher than in India. Besides, these values does not reflect the disparity within a
geographical area (for example, in Middle-East, emissions per capita are more
than 50 tCO2e/inhabitant in Qatar, and less than 2 tCO2e/inhabitant in Yemen), and
within a country.
REGIONAL DISTRIBUTION OF GHG EMISSIONS PER UNIT OF GDP IN 2012
kg CO2e/USD
1.4
Africa 10.8 %
1.2 Japan, South Korea, Australia
Europe and former URSS excl. EU 8.2% and New Zealand 5.7 %
1
Central and South America 10.9 %
0.8
Other Asia and Océania 6.9 %
0.6 China
India 5.7 % Middle-East 4.6%
24.3 %
0.4
0.2 North America
13.9 % EU 28 8.9 %
0
0 10 000 20 000 30 000 40 000 50 000 60 000 70 000 80 000 90 000
Sources: I4CE based on JRC EDGAR and World Bank, 2015
In 2012, the carbon intensity of GDP is more than four times higher in Africa than in
the EU, meaning that four times more GHGs are emitted per unit of economic output.
Key figures on climate – France, Europe and Worldwide – 23part 2: Which amounts of greenhouse gases are emitted globally?
Global CO2 emissions excluding LULUCF
GLOBAL CO2 EMISSIONS BY FUEL
40 000
35 000
14 %
30 000
17 %
25 000
20000 30 %
Mt CO2
15 000
10 000
5000 39 %
0
1970 1975 1980 1985 1990 1995 2000 2005 2010
Other Gas combustion Oil combustion Coal combustion
Note: emissions listed here are CO2 emissions from fossil fuel use and industrial processes.
This corresponds to total CO2 emissions excluding LULUCF. They account for 85% of all
global CO2 emissions and 65% of GHG emissions
Sources: SDES from EDGAR, 2016, IEA, 2017
In 2015, global CO2 emissions excluding LULUCF (see glossary), amount to 36.2
billion tonnes. Close to 39% of those emissions are caused by coal combustion,
30% by oil combustion and 17% by natural gas combustion. Emissions related
to industrial processes, such as cement production, represent 14% of the total.
Compared to 2014, coal-related emissions have decreased while those related
to oil and gas combustion have increased.
24 – Key figures on climate – France, Europe and Worldwidepart 2: Which amounts of greenhouse gases are emitted globally?
GLOBAL PRIMARY ENERGY MIX
As% 1973 2014
(6101 Mtoe) (13 699 Mtoe)
Renewable energy and waste
Renewable energy and waste
14 %
13 %
Nuclear
1% Nuclear Coal
Coal
5% 29 %
25 %
Natural
gas
Natural
16 %
gas
21 %
Oil
Oil 31 %
47 %
Source: IEA, 2016
The distribution of emissions by fuels can be linked to the global primary energy
mix. In 2014, fossil fuels (coal, natural gas and oil) account for 81% of the global
total primary energy supply. Oil remains the largest energy source at a global
level but, between 1973 and 2014, its share in this mix fell by 16 points, in favour
of gas (+ 5 points), nuclear power (+ 4 points) and coal (+ 3 points). Accounting
for a 29% share of the energy mix, coal was the second largest energy source
after crude oil in 2014. Yet, it ranked first in terms of CO2 emissions as its emission
factor is considerably higher than those of gas and oil (see page 75). Although
global coal consumption greatly increased during the 2000’s, it has been
stagnant or even in decline for the last few years. While renewable energy
generation used to increase at a rate close to total generation before 2010, its
share in the world energy mix is now growing and reached 14% in 2014.
Key figures on climate – France, Europe and Worldwide – 25part 2: Which amounts of greenhouse gases are emitted globally?
GEOGRAPHIC DISTRIBUTION OF GLOBAL CO2 EMISSIONS (EXCL. LULUCF)
Change Change
2015 share
In Mt CO2 1990 2014 2015 (%) (%)
(%)
2015-2014 2015-1990
North America 5 743 6 365 6 200 17,2 -2,6 +8,0
of which: Canada 557 705 684 1,9 -3,0 +22,8
USA 5 008 5 317 5 177 14,4 -2,6 +3,4
Central and South America 651 1 299 1 284 3,6 -1,2 +97,2
of which: Brazil 221 506 486 1,3 -4,0 +119,9
Europe and former USSR 8 448 6 265 6 216 17,2 -0,8 -26,4
of which Russia 2 395 1 822 1 761 4,9 -3,3 -26,5
EU-28 4 386 3 424 3 470 9,6 +1,3 -20,9
Germany 1 021 773 778 2,2 +0,6 -23,8
Spain 230 246 263 0,7 +6,9 +14,3
France 383 323 328 0,9 +1,3 -14,4
Italy 429 337 354 1,0 +5,0 -17,5
United Kingdom 581 415 399 1,1 -3,9 -31,3
Poland 364 289 295 0,8 +2,1 -19,0
Sub-Saharan Africa 530 942 942 2,6 -0,0 +77,8
Middle East and
956 2 545 2 616 7,3 +2,8 +173,8
North Africa
of which Saudi Arabia 168 487 506 1,4 +3,9 +200,9
Asia 5 248 17 065 17 167 47,6 +0,6 +227,1
of which: China 2 357 10 790 10 717 29,7 -0,7 +354,7
South Korea 270 612 610 1,7 -0,3 +125,9
India 663 2 349 2 469 6,8 +5,1 +272,4
Japan 1162 1285 1257 3,5 -2,2 +8,2
Océania 306 484 491 1,4 +1,6 +60,5
Annex I countries 14 996 13 794 13 544 37,6 -1,8 -9,7
Non-Annex I countries 6 885 21 171 21 373 59,3 +1,0 +210,4
International bunkers 626 1 119 1 145 3,2 +2,3 +82,8
World 22 508 36 084 36 062 100,0 -0,1 +60,2
Note: international bunkers are emissions from international aviation and shipping. They have
been excluded from national totals (see glossary).
Source: EDGAR, 2016
In 2015, global CO2 emissions slightly decreased (by 0.1%), a turnaround
compared to the average yearly trend since 2000 (+2.5%). The United States
(-2.6%) are the county contributing the most to this reduction, largely thanks to
fuel-switching from coal to gas in electricity generation. In 2015 and for the
second year in a row, India is the country displaying the strongest growth in
emissions.
26 – Key figures on climate – France, Europe and Worldwidepart 2: Which amounts of greenhouse gases are emitted globally?
EVOLUTION OF GLOBAL CO2 EMISSIONS BETWEEN 1970 AND 2015
450
400
China
350
India
300
Index base 100 in 1990
World
250
200
United States
150
France
100
UE à 28
50
0
1970 1975 1980 1985 1990 1995 2000 2005 2010 2015
Source: EDGAR, 2016
In 2015, Chinese emissions accounted for almost 30% of global CO2 emissions.
China is the first emitting country, followed by the United States (14.4%), the
EU-28 (9.6% of the global total when counted as a block) and India (6.8%).
Between 1990 and 2015, global CO2 emissions increased by 58%. During this
period, China contributed the most to the rise: its emissions were multiplied by
4.5. The second most significant contribution to global emissions growth comes
from India where emissions increased by 272%. As for the United States, its
emissions have been more or less stable (+3.4%) since 1990. During the same
period, EU-28 emissions decreased by 20.9% and French emissions by 14.4%.
Key figures on climate – France, Europe and Worldwide – 27part 2: Which amounts of greenhouse gases are emitted globally?
GLOBAL CO2 EMISSIONS PER CAPITA (EXCL. LULUCF)
Évolution (%) Évolution (%)
In t CO2 / capita 1990 2014 2015
2015-2014 2015-1990
North America 15,8 13,3 12,9 -2,6 -18,3
of which: Canada 20,2 19,8 19,0 -3,9 -5,5
USA 19,8 16,6 16,1 -3,3 -18,8
Central and South America 1,8 2,6 2,6 -1,2 +41,9
of which: Brazil 1,5 2,5 2,3 -4,5 +59,2
Europe and former USSR 10,0 6,9 6,9 -0,8 -31,3
of which Russia 16,2 12,7 12,3 -3,4 -24,4
of which EU-28 9,2 6,7 6,8 +1,0 -25,8
of which: Germany 12,9 9,6 9,6 +0,5 -25,4
Spain 5,9 5,3 5,7 +7,3 -2,9
France 6,7 5,1 5,1 +0,8 -24,0
Italy 7,5 5,6 5,9 +5,2 -21,4
United Kingdom 10,2 6,5 6,2 -4,6 -39,5
Poland 9,5 7,5 7,6 +2,0 -19,8
Sub-Saharan Africa 1,0 1,0 0,9 -2,7 -9,5
Middle East and North Africa 3,7 6,0 6,1 +0,9 +63,4
of which Saudi Arabia 10,3 15,8 16,0 +1,7 +56,4
Asia 1,8 4,3 4,4 +0,6 +143,6
of which: China 2,0 7,8 7,8 -1,1 +281,8
South Korea 6,3 12,2 12,1 -0,7 +93,6
India 0,8 1,8 1,9 +3,9 +147,4
Japan 9,5 10,1 9,9 -2,1 +4,5
Océania 13,9 16,0 16,2 +1,6 +17,0
Annex I countries 13,0 10,7 10,6 -1,8 -18,8
Non-Annex I countries 1,7 3,5 3,5 -0,5 +111,2
World 4,3 5,0 4,9 -1,2 +15,1
Note: the figures here refer to the CO2 emissions of a territory divided by its population. The
average emissions due to the consumption of an inhabitant are calculated using a different
approach (carbon footprint).
Sources: SDES from EDGAR, 2016, World Bank, 2017
In 2015, global CO2 emissions amounted to 4.9 t CO2/capita on average, a
decrease of 1.2% compared to 2014. The evolution was driven by the
stabilization of global CO2 emissions and a demographic growth of +1.2%.
Emissions per capita were highest in North America (over 16 t CO2/capita in the
United States), in the Middle East and in Oceania. Chinese emissions per capita
are now 7.8 t CO2/ capita, 1.1% down in 2015 compared to 2014, above the
French level of 5.1 t CO2/capita and the average for the EU-28 (6.7 t CO2/capita).
28 – Key figures on climate – France, Europe and Worldwidepart 2: Which amounts of greenhouse gases are emitted globally?
EVOLUTION OF GLOBAL CO2 EMISSIONS PER CAPITA BETWEEN 1970
AND 2015
24
22
20 United States
18
16 UE - 28
14
t CO 2 / capita
China
12
10 France
8
World
6
4
2 India
0
1990 1995 2000 2005 2010 2015
Sources: SDES from EDGAR, 2016, World Bank, 2017
Since 1990, global average emissions per capita have increased by 15%. While
emissions per capita in non-annex I countries (see glossary) are still almost three
times lower than in annex I countries, there is an ongoing catching-up process
between those two groups of countries. For instance, since 1990, emissions
per capita have been multiplied by more than 3.8 in China and by close to 2.5
in India. Simultaneously, CO2 emissions per capita have significantly decreased
in the EU (–26%) and to a lesser extent in the United States (–19%). Japan is at
an intermediate stage, its emissions per capita are relatively high (10 t CO2/
capita) and have remained quite unchanged since 1990. Unlike the situation in
the main emerging countries, emissions per capita in Sub-Saharan Africa have
not increased and remain around one ton of CO2 per capita.
Key figures on climate – France, Europe and Worldwide – 29part 2: Which amounts of greenhouse gases are emitted globally?
GLOBAL CO2 EMISSIONS IN RELATION TO GDP (EXCL. LULUCF)
Évolution (%) Évolution (%)
In t CO2 / Million $ 2011 PPP 1990 2014 2015
2015/2014 2015/1990
North America 567 353 335 -4,9 -40,9
of which: Canada 641 463 445 -3,9 -30,5
USA 541 322 307 -4,9 -43,4
Central and South America 201 183 181 -0,8 -9,7
of which: Brazil 143 162 162 +0,1 +13,1
Europe and former USSR 488 245 239 -2,3 -51,0
of which Russia 783 502 503 +0,4 -35,7
of which EU-28 366 194 192 -0,7 -47,4
of which: Germany 408 219 217 -1,0 -46,9
Spain 245 167 173 +3,6 -29,7
France 222 132 132 +0,2 -40,6
Italy 246 166 173 +4,4 -29,6
United Kingdom 381 169 158 -6,2 -58,5
Poland 942 318 313 -1,6 -66,8
Sub-Saharan Africa 409 278 269 -3,2 -34,1
Middle East and North Africa 323 350 351 +0,4 +8,9
of which Saudi Arabia 290 318 319 +0,4 +9,9
Asia 472 411 392 -4,6 -17,1
of which: China 1 257 614 571 -7,0 -54,6
South Korea 520 361 351 -2,7 -32,6
India 430 336 329 -2,3 -23,5
Japan 318 284 276 -2,7 -13,1
Océania 539 412 409 -0,8 -24,1
Annex I countries 499 301 290 -3,5 -41,9
Non-Annex I countries 404 359 346 -3,4 -14,3
World 483 350 339 -3,0 -29,8
Note: GDP at constant prices converted to US dollars on a Purchasing Power Parity (PPP)
basis for 2011 (see glossary)
Sources: SDES from EDGAR, 2016, World Bank, 2017
The quantity of CO2 emitted per unit of GDP keeps declining worldwide with a
3.0% decrease in 2015, the largest drop since 1990. This evolution is explained
by the light decline in emissions and a global economic growth of 3%. There
are strong disparities between countries with the highest values in China
(570 t CO2/ Million $) or in Russia. The United States (307 t CO2/ Million $) or
Japan are slightly below the global average, while the lowest values are in the
EU (192 t CO2/ Million $), in particular in France (132 t CO2/ Million $).
30 – Key figures on climate – France, Europe and Worldwidepart 2: Which amounts of greenhouse gases are emitted globally?
EVOLUTION OF GLOBAL CO2 EMISSIONS IN RELATION TO GDP BETWEEN
1990 AND 2015
1600
China
1400
United States
1200
t CO2 / Million $ 2011 PPP
1000 World
800 UE - 288
600 India
400
France
200
0
1990 1995 2000 2005 2010 2015
Sources: SDES from EDGAR, 2016, World Bank, 2017
The quantity of CO2 emitted per unit of GDP shows the gradual decoupling of
CO2 emissions from economic growth. It has dropped by 29% worldwide since
1990 and has decreased in almost all countries. The main exceptions are oil-
producing countries such as Saudi Arabia (+10%) or raw materials exporting
countries like Brazil (+13%). China was the country that recorded the sharpest
drop in 25 years, with emissions per unit of GDP down by more than half. The
decline in CO2 intensity in relation to GDP since 1990 is also significant in the
EU (-47%) and in the United States (-43%).
Key figures on climate – France, Europe and Worldwide – 31part 2: Which amounts of greenhouse gases are emitted globally?
Sectorial distribution of global CO2
emissions
DISTRIBUTION OF CO2 EMISSIONS FROM FUEL COMBUSTION FOR THE
MAIN EMITTERS IN 2014
As %
100 4 4 5 7
4 Other sectors
6 7
90 (including tertiary)
9 11
80 23
Residential
70 33
32 28
60 Transport
19
50 9 13
10 Industry
8 5 and construction
40 6
30
Energy sector
20 40 43 41 outside electricity
36
10
Electricity generation
0
World China United States EU-28
Source: IEA, 2016
Accounting for 40% of global energy-related CO 2 emissions, electricity
generation was the first emitting sector in 2014. Coal-fired power plants alone
are responsible for 31% of global emissions. Next are the transport sector and
industry, respectively accounting for 23% and 19% of energy-related CO2
emissions. In China, electricity generation (43%) and industry (32%) are
responsible for a higher share of emissions than the global average. As for the
transport sector, it is responsible of a higher share than the global average in the
EU (28%) and in the United States (33%).
32 – Key figures on climate – France, Europe and Worldwidepart 2: Which amounts of greenhouse gases are emitted globally?
part 3
How much
greenhouse gas is
emitted in Europe
and in France?
— Within the UNFCCC framework, the European Union and France
report the greenhouse gases emitted on their territory. In 2015, the
EU emitted 4 308 Mt CO2e excluding LULUCF, representing a drop of
24% compared to 1990. In France, emissions excluding LULUCF
reached 457 Mt CO2e in 2015 and have decreased by 16% since
1990. In the EU, the energy sector is the first emitting sector while the
transport sector contributes the most to French emissions. The
footprint approach, complementary to the territorial approach, gives
an estimate of GHG emissions arising from the consumption of
French residents. In 2012, French consumption-based emissions
were over 50% higher than territory-based emissions.
Key figures on climate – France, Europe and Worldwide – 33part 3: How much greenhouse gas is emitted in Europe and in France?
Overview of GHG emissions in Europe
EU-28 GHG EMISSIONS IN 2015
In Mt CO2e
Source Years CO2 CH4 N2O F-gases Total
1990 4 111,6 193,9 31,0 0,0 4 336,6
Energy use
2015 3 241,2 87,4 29,4 0,0 3 358,0
Industrial processes 1990 325,3 1,8 117,9 71,9 516,9
and use of solvents 2015 243,4 1,6 11,0 117,9 373,9
Agriculture (excluding 1990 15,2 306,0 227,1 0,0 548,3
energy use)) 2015 10,3 241,7 184,8 0,0 436,7
1990 5,2 226,7 9,0 0,0 240,9
Waste
2015 3,2 125,3 10,8 0,0 139,3
1990 4 457,4 728,4 385,0 71,9 5 642,7
Total excl. LULUCF
2015 3 498,1 456,0 236,0 117,9 4 308,0
1990 -251,7 6,9 13,1 0,0 -231,8
LULUCF
2015 -323,6 5,0 13,7 0,0 -304,9
1990 4 205,7 735,3 398,1 71,9 5 410,9
Total
2015 3 174,4 461,1 249,7 117,9 4 003,1
Note: the waste sector excludes waste incineration with energy recovery (included in “energy
use”)
Source: EEA, 2017
In 2015, European GHG emissions excluding LULUCF reached 4 308 Mt CO2e
of which 81% are CO2 emissions and 11% are CH4 emissions. European GHG
slightly increased by 0.5% compared to 2014 and decreased by 23.7% over
the period 1990-2015.
34 – Key figures on climate – France, Europe and Worldwidepart 3: How much greenhouse gas is emitted in Europe and in France?
DISTRIBUTION OF GHG EMISSIONS (EXCL. LULUCF) IN THE EU IN 2015
As%
Energy sector
28.8
Agriculture
10.1 Energy use
Industrial Processes 77.9 Transport 21.0
and use of solvents
8.7
Manufacturing industry
and construction 11.2
Residential tertiary
Waste 12.8
3.2 Other 4.1
Source: EEA, 2017
In the EU, energy use was the main source of GHG emissions (78%) in 2015,
followed by agriculture at around 10%. The largest GHG emitting sector was
the energy sector (29% of emissions), ahead of transport (21%).
In 2015, EU GHG emissions have slightly increased, breaking the trend of the
past 5 years. This evolution can be explained by a rebound of emissions in the
residential-tertiary sector (+4.9%), consequence of a winter less mild than in
2015, and to a lesser extend by a rise of emissions in the transport sector
(+1.9%). Between 1990 and 2015, the decline of GHG emissions is driven by
significant decreases in the energy (-42%) and manufacturing industry (- 15%)
sectors while the transport sector contributed to more emissions (+16%).
Key figures on climate – France, Europe and Worldwide – 35part 3: How much greenhouse gas is emitted in Europe and in France?
Overview of GHG emissions in France
GHG EMISSIONS IN FRANCE IN 2015
In Mt CO2e
Source Years CO2 CH4 N2O F-gases Total
1990 364,5 12,6 3,2 0,0 380,3
Energy use
2015 310,2 2,9 3,7 0,0 316,9
Industrial processes 1990 31,1 0,1 23,8 11,8 66,8
and use of solvents 2015 22,9 0,0 1,3 20,3 44,5
Agriculture (excluding 1990 1,8 43,2 38,1 0,0 83,1
energy use)) 2015 2,0 40,9 35,4 0,0 78,4
1990 2,2 13,7 0,9 0,0 17,4
Waste
2015 1,5 15,0 0,8 0,0 19,5
1990 399,6 69,6 66,0 11,8 547,1
Total excl. LULUCF
2015 336,6 58,9 41,3 20,3 457,1
1990 -29,8 0,9 2,4 0,0 -26,5
LULUCF
2015 -39,1 1,1 2,2 0,0 -35,8
1990 369,7 70,6 68,4 11,8 520,59
Total
2015 297,5 60,0 43,5 20,3 421,32
Source: Citepa, 2017
In 2015, French GHG emissions, excluding LULUCF, reached 457 Mt
CO 2e, of which 74% are CO 2 emissions and 13% are CH 4 emissions.
French GHG emissions increased by 0.8% compared to 2014 and
dropped by 16.4% over the period 1990-2015.
36 – Key figures on climate – France, Europe and Worldwidepart 3: How much greenhouse gas is emitted in Europe and in France?
DISTRIBUTION OF GHG EMISSIONS (EXCL. LULUCF) IN FRANCE IN 2015
As%
Energy sector
9.2
Agriculture Transport 29.0
17,1
Energy use
69.3
Industrial Processes
and use of solvents Manufacturing industry
9.7 and construction 11.0
Residential tertiary
16.5
Other 3.6
Waste
4.3
Source: Citepa, 2017
As throughout the EU, energy use was the main GHG emission source in France
accounting for 70% of total emissions excluding LULUCF. However, unlike the
EU average, the largest emitting sector in France is transport (29%), while the
energy sector has relatively low emissions (9%), owing to the extent of nuclear
electricity generation.
The rise in emissions between 2014 and 2015, is driven by a rebound of
emissions in the residential-tertiary sector (+4.9%), consequence of a winter
less mild than in 2015. Over the period 1990-2015, the evolution is similar to the
rest of the EU, the sectors contributing the most to the reduction of French
emissions are the manufacturing industry (-38%) and the energy (–25%) sectors.
Key figures on climate – France, Europe and Worldwide – 37part 3: How much greenhouse gas is emitted in Europe and in France?
Carbon footprint and emissions from
imported goods
COMPARISON BETWEEN THE FOOTPRINT APPROACH AND
THE TERRITORIAL INVENTORY APPROACH FOR METROPOLITAN
FRANCE-2012
800
705 Mt CO2 e
700
600
Emissions from 458 Mt CO2e
500 imported goods
Mt CO2e
400 Emissions from exported goods
300
Emissions from domestic Emissions from domestic
production (excluding exports) production (excluding exports)
200
100 Direct emissions from housholds Direct emissions from housholds
in France (cars and heating) in France (cars and heating)
0
Footprint Inventory
The inventory and the carbon footprint include the 3 main GHGs (CO2, CH4, N2O)
Sources: SDES, 2017 from Citepa, Eurostat, Insee, Customs, IEA, 2016
Two complementary methods allow to estimate a country pressure on global
climate:
- National inventories account for GHGs physically emitted inside a country
using a territorial approach. These national inventories are carried out each year
according to UNFCCC guidelines.
- The carbon footprint approach accounts for emissions from final domestic
demand in the country. It includes emissions from imported goods in addition
to direct emissions from households (housing and cars) and from domestic
production (excluding exports). Taking into account the 3 main GHGs, 75% of
the footprint comes from CO2 emissions, 19% from CH4 and 6% from N20.
Compared to the inventory, the footprint gives a greater weight to CH4 emissions
(19% against 13%), largely because of emissions from imported energy
products.
38 – Key figures on climate – France, Europe and Worldwidepart 3: How much greenhouse gas is emitted in Europe and in France?
EVOLUTION OF METROPOLITAN FRANCE'S GHG EMISSIONS
ACCORDING TO THE TERRITORIAL APPROACH AND THE FOOTPRINT
APPROACH Carbon Footprint National inventory
11,6 11,6 11,3 12
800 10,5 10,5
700 10
9,1 9,0 8,6
600 7,7
t CO2e/capita
302 6,6 8
276 348
Mt CO2e
500 200 374
6
400
300 4
528 530 526 480
200 408 404 404 425
359
303 2
100
0 0
1995 2000 2005 2010 2015 1995 2000 2005 2010 2015
Emissions from imported goods
Emissions inside metropolitan France (households and economic activities excluding exports)
Emissions inside metropolitan France (households and economic activities including exports)
GHG footprint per capita
GHG territorial emissions per capita
Note : The inventory and the carbon footprint include the 3 main GHGs (CO2, CH4, N2O)
Sources: SDES, 2017 from Citepa, Eurostat, Insee, Customs, IEA
In 2015, the French carbon footprint (678 Mt CO2e) is widely higher (+54%) than
the inventory. The footprint is 11.7% higher than in 1995, notably emissions from
imported goods increased by 76% over the same period.
However, if population growth is taken into account, the footprint calculated per
capita in 2015 is almost the same as in 1995. Over this period, GHG emissions
(CO2, CH4 et N2O) inside metropolitan France decreased by 19.5% and the
average emissions per capita by 27.8%. The carbon footprint per capita have
been declining since 2005 after a period of increase while territorial emissions
per capita have been steadily declining since 1995.
Key figures on climate – France, Europe and Worldwide – 39part 3: How much greenhouse gas is emitted in Europe and in France?
INTERNATIONAL COMPARISON OF CO2 EMISIONS FROM FUEL
COMBUSTION ACCORDING TO THE TWO APPROACHES
16
14
OCDE in 1990
12
10
Gt CO2
8
China
6
EU-28
4
2
Middle East and North Africa
0 Latin America
1990 1992 1994 1996 1998 2000 2002 2004 2006 2008 2010 2012 2014
Approach CO2 transfert
Footprint Net imports
Territorial Net exports
Source: I4CE from Global Carbon Budget, 2016
Between 1990 and 2014, CO2 emissions from fuel combustion increased by
4% in the OECD according to the territorial approach, and by 9% according to
the footprint approach. In the EU 28, over the same period, they dropped by
23% according to the territorial approach but only by 17% with the footprint
approach. In China, they have more than tripled according to both approaches.
Emissions per capita in China are now higher than in the EU 28, with the territorial
approach (7.6 tCO2/capita in China against 6.8 tCO2/capita in the EU 28).
However, with the footprint approach, emissions per capita in China are 20%
lower than in the EU 28, and more than 40% lower than the OECD average
(6.6 tCO2/capita in China, against 8.3 tCO2/capita in the EU 28 and
11.2 tCO2/capita on average in the OECD).
40 – Key figures on climate – France, Europe and Worldwidepart 3: How much greenhouse gas is emitted in Europe and in France?
part 4
What is the sectoral
distribution of GHG
emissions in Europe
and in France?
— European and French inventories enable a breakdown of GHG
emissions by economic sectors and subsectors. In Europe and in
France, the decline in emissions since 1990 has been the most
significant in the manufacturing industry followed by the energy sector.
Emissions in the residential and tertiary sectors have also been following
a downward trend in the EU and to a lesser extent, in France. The
transport sector is an exception as the level of emissions in 2015 was
higher than in 1990, both in Europe and in France. However, since the
mid 2000s, emissions have been on a decreasing trend in the transport
sector at both levels. Emissions from LULUCF are negative, hence
meaning that there is a net sequestration of CO2 by biomass and soils.
Key figures on climate – France, Europe and Worldwide – 41part 4: What is the sectoral distribution of GHG emissions in Europe and in France?
GHG emissions from the energy sector
GHG EMISSIONS FROM THE ENERGY SECTOR IN THE EU
2 000 Public electricity
1 800 and heat production
GHG emissions (Mt CO2e)
1 600
1 400 Fugitive emissions
1 200 from fuels
1 000
800 Manufacture of
600 solid fuels and
other
400
200
Petroleum refining
0
1990 1995 2000 2005 2010 2015
Note: public electricity and heat production includes waste incineration with energy recovery.
Heat refers here to traded heat only.
Source: AEE, 2017
GHG EMISSIONS FROM THE ENERGY SECTOR IN FRANCE
100
90 Public electricity
GHG emissions (Mt CO2e)
and heat production
80
70
Fugitive emissions
60 from fuels
50
40 Manufacture of
30 solid fuels and
20 other
10
Petroleum refining
0
1990 1995 2000 2005 2010 2015
Note: public electricity and heat production includes waste incineration with energy recovery.
Heat refers here to traded heat only. Including Overseas territories
Source: Citepa, 2017
42 – Key figures on climate – France, Europe and Worldwidepart 4: What is the sectoral distribution of GHG emissions in Europe and in France?
CO2 EMISSIONS FROM THE GENERATION 1 KWH OF ELECTRICITY
IN THE EU
1 100 Poland
1 000
Germany
900
800
g CO2 / kWh
United
700 Kingdom
600 Italy
500
UE-28
400
300
France
200
100
Sweden
0
1990 1995 2000 2005 2010 2015
Note: cogeneration and autoproduction are included
Source: SDES from IEA, 2017
Most of GHG emissions in the energy sector come from electricity and heat
production, both in the EU (80% in 2015) and in France (68%). CO2 emissions
per unit of electricity generated vary greatly from one country to another in the
EU-28, even if the downward trend since 1990 is common to almost all EU
countries. They are very high (over 400 gCO2/kWh) in countries where coal
remains a major source for electricity production, such as Germany or Poland.
They are lower in countries where renewable energy and/ or nuclear power have
been significantly developed, such as France (76% nuclear and 11% hydro in
2015) and Sweden (46% hydro and 35% nuclear).
Key figures on climate – France, Europe and Worldwide – 43part 4: What is the sectoral distribution of GHG emissions in Europe and in France?
GHG Emissions from transport
GHG EMISSIONS FROM TRANSPORT IN THE EU
1 000
Other
800
GHG emissions (MtCO2e)
Rail
60
Aviation
40
Shipping
20
and inland
waterways
0
Road
1990 1995 2000 2005 2010 2014
Note: emissions from international aviation and shipping are excluded.
Source: AEE, 2017
GHG EMISSIONS FROM TRANSPORT IN FRANCE
150
Other
GHG emissions (MtCO2e)
100 Rail
8
Aviation
6
4
Shipping
2 and inland
waterways
0 Road
1990 1995 2000 2005 2010 2014
Note: emissions from international aviation and shipping are excluded. Emissions inside
overseas territories and between metropolitan France and French overseas territories are
included.
Source: Citepa, 2017
44 – Key figures on climate – France, Europe and Worldwidepart 4: What is the sectoral distribution of GHG emissions in Europe and in France?
GHG EMISSIONS BY TRANSPORT MODE IN FRANCE (INCL. OVERSEAS
TERRITORIES)
Light commercial vehicules
19,2% Motorcycles 1,2%
Aviation
Heavy goods 3,5%
vehicules
20,8%
Other
5,1%
Private vehicules Shipping and inland
53,7% waterways 1,0%
Other 0,3%
Rail 0,3%
Source: Citepa, 2017
INTENSITY OF GHG EMISSIONS IN METROPOLITAN FRANCE
110
105
Index base 100 in 1990
100 Domestic
95 passenger
transport
90
85
Domestic
80 freight
transport
75
70
65
1990 1995 2000 2005 2010 2015
Note: the indicators used for freight and passenger transport are, respectively, GHG emissions
per tonne-kilometre and GHG emissions per passenger-kilometre.
Source: SDES, 2017
Key figures on climate – France, Europe and Worldwide – 45part 4: What is the sectoral distribution of GHG emissions in Europe and in France?
GHG EMISSIONS FROM THE MANUFACTURING INDUSTRY
AND CONSTRUCTION
1 500
1 400
1 300 Food processing,
1 200 beverages and
GHG emissions (Mt CO2e)
1 100 tobacco
1 000 Other manufactu-
900 ring,industries
800 and constructions
700 Metal industry
600
500 Chimie
400
300 Non-metallic
200 minerals
100
0
1990 1995 2000 2005 2010 2015
Note: emissions from each sector include energy-related emissions and emissions from
industrial processes.
Source: AEE, 2017
GHG EMISSIONS FROM THE MANUFACTURING INDUSTRY
AND CONSTRUCTION IN FRANCE
150
140
130 Food processing,
beverages and
120
GHG emissions (Mt CO2e)
tobacco
110
100 Other manufactu-
90 ring,industries
80 and constructions
70 Metal industry
60
50
40 Chimie
30
20 Non-metallic
10 minerals
0
1990 1995 2000 2005 2010 2015
Note: emissions from each sector include energy-related emissions and emissions from
industrial processes. Overseas territories are included
Source: Citepa, 2017
46 – Key figures on climate – France, Europe and WorldwideYou can also read