Different Wood Anatomical and Growth Responses in European Beech (Fagus sylvatica L.) at Three Forest Sites in Slovenia
←
→
Page content transcription
If your browser does not render page correctly, please read the page content below
ORIGINAL RESEARCH
                                                                                                                                                     published: 26 July 2021
                                                                                                                                             doi: 10.3389/fpls.2021.669229

                                              Different Wood Anatomical and
                                              Growth Responses in European
                                              Beech (Fagus sylvatica L.) at Three
                                              Forest Sites in Slovenia
                                              Domen Arnič1,2*, Jožica Gričar 3, Jernej Jevšenak 3, Gregor Božič4, Georg von Arx 5 and
                                              Peter Prislan 1
                                              1
                                                Department for Forest Technique and Economics, Slovenian Forestry Institute, Ljubljana, Slovenia, 2 Biotechnical Faculty,
                                              University of Ljubljana, Ljubljana, Slovenia, 3 Department of Forest Yield and Silviculture, Slovenian Forestry Institute,
                                              Ljubljana, Slovenia, 4 Department of Forest Physiology and Genetics, Slovenian Forestry Institute, Ljubljana, Slovenia,
                                              5
                                                Swiss Federal Research Institute for Forest, Snow and Landscape Research (WSL), Birmensdorf, Switzerland
                         Edited by:
                   Jian-Guo Huang,
      South China Botanical Garden,           European beech (Fagus sylvatica L.) adapts to local growing conditions to enhance its
Chinese Academy of Sciences (CAS),
                              China           performance. In response to variations in climatic conditions, beech trees adjust leaf
                      Reviewed by:            phenology, cambial phenology, and wood formation patterns, which result in different tree-
                        Marcin Klisz,         ring widths (TRWs) and wood anatomy. Chronologies of tree ring width and vessel features
      Forest Research Institute (IBL),
                                              [i.e., mean vessel area (MVA), vessel density (VD), and relative conductive area (RCTA)]
                              Poland
           Ignacio García-González,           were produced for the 1960–2016 period for three sites that differ in climatic regimes and
           University of Santiago de          spring leaf phenology (two early- and one late-flushing populations). These data were used
                 Compostela, Spain
                  Shaokang Zhang,             to investigate long-term relationships between climatic conditions and anatomical features
Chinese Academy of Sciences (CAS),            of four quarters of tree-rings at annual and intra-annual scales. In addition, we investigated
                               China
                                              how TRW and vessel features adjust in response to extreme weather events (i.e., summer
                 *Correspondence:
                                              drought). We found significant differences in TRW, VD, and RCTA among the selected
                        Domen Arnič
               domen.arnic@gozdis.si          sites. Precipitation and maximum temperature before and during the growing season were
                                              the most important climatic factors affecting TRW and vessel characteristics. We confirmed
                   Specialty section:
         This article was submitted to
                                              differences in climate-growth relationships between the selected sites, late flushing beech
             Functional Plant Ecology,        population at Idrija showing the least pronounced response to climate. MVA was the only
               a section of the journal       vessel trait that showed no relationship with TRW or other vessel features. The relationship
            Frontiers in Plant Science
                                              between MVA and climatic factors evaluated at intra-annual scale indicated that vessel
        Received: 18 February 2021
           Accepted: 05 July 2021             area in the first quarter of tree-ring were mainly influenced by climatic conditions in the
           Published: 26 July 2021            previous growing season, while vessel area in the second to fourth quarters of tree ring
                              Citation:       width was mainly influenced by maximum temperature and precipitation in the current
       Arnič D, Gričar J, Jevšenak J,
               Božič G, von Arx G and
                                              growing season. When comparing wet and dry years, beech from all sites showed a similar
     Prislan P (2021) Different Wood          response, with reduced TRW and changes in intra-annual variation in vessel area. Our
  Anatomical and Growth Responses             findings suggest that changes in temperature and precipitation regimes as predicted by
           in European Beech (Fagus
          sylvatica L.) at Three Forest       most climate change scenarios will affect tree-ring increments and wood structure in beech,
                      Sites in Slovenia.      yet the response between sites or populations may differ.
        Front. Plant Sci. 12:669229.
     doi: 10.3389/fpls.2021.669229            Keywords: Fagus sylvatica, wood anatomy, tracheograms, dendrochronology, intra specific plasticity

Frontiers in Plant Science | www.frontiersin.org                                      1                                                July 2021 | Volume 12 | Article 669229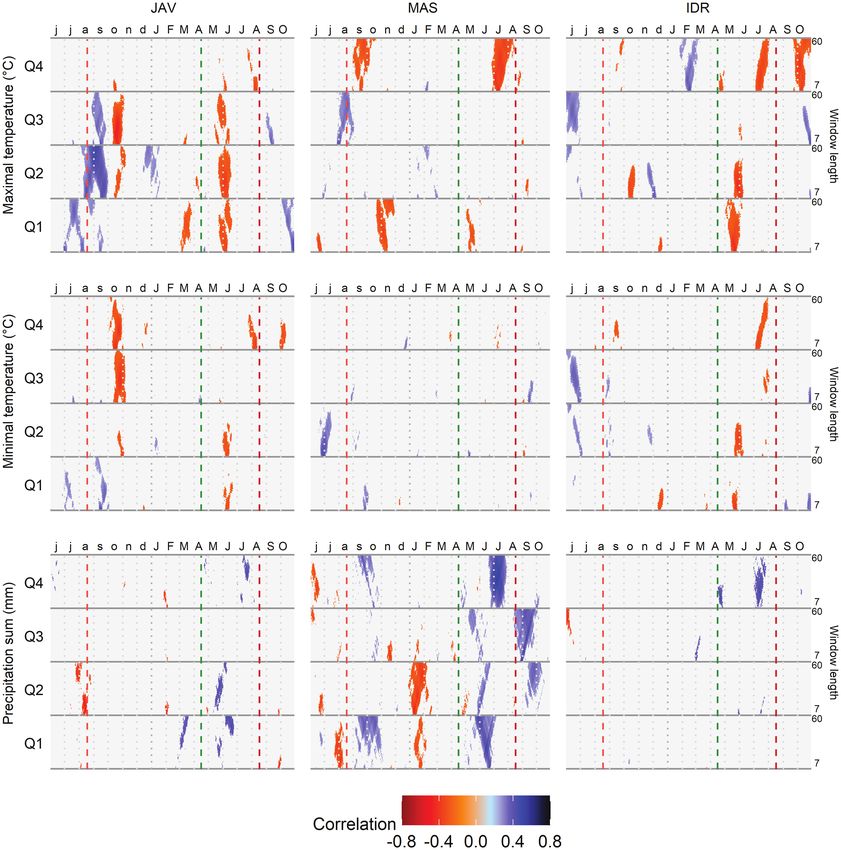
Arnič et al.                                                                                                     Climate-Growth Interactions in Beech

INTRODUCTION                                                                 growth (Stojanović et al., 2018; Garamszegi et al., 2020). The
                                                                             response of trees to variations in climatic conditions also differed
European beech (Fagus sylvatica L.) is one of the dominant                   with elevation; in contrast to low elevation sites, higher
tree species of mixed and deciduous temperate European forests               temperatures during the growing season at high elevation sites
(del Río et al., 2017), with a wide distribution range and thus              had the opposite effect on beech growth (Di Filippo et al.,
high intra-specific plasticity (Dieler and Pretzsch, 2013). It               2007). Moreover, future predictions based on climate change
grows on forest sites with diverse growing conditions; from                  scenarios suggest that at optimal forest sites with sufficient
moist and cold sites in the southern part of Scandinavia to                  water availability, the duration of the growing season and,
dry and hot areas in the northern part of the Iberian and                    consequently, xylem increments will increase in the coming
Apennine peninsulas (Bolte et al., 2007). Due to the wide                    decades (Prislan et al., 2019).
distribution range, beech populations adjust their growth traits,                While several studies have been performed on the impact
such as leaf phenology and growth and frost resistance, to                   of the environment on beech radial growth, little is known
their specific environmental conditions (Vitasse et al., 2011).              about how intra-annual variability of temperature and
Phenotypic plasticity of beech has been extensively studied in               precipitation affects xylem structure. However, structural
past decades to understand the survival and future distribution              adjustments of wood to environmental cues play a decisive
range of beech under climate change (Matyas et al., 2009).                   role in defining the hydraulic and mechanical properties of
Across Europe, common garden experiments were established                    wood and, consequently, tree performance, and survival (Chave
to understand the effect of beech provenances under different                et al., 2009; Fonti et al., 2010). Stojnic et al. (2013) found
environmental conditions (Robson et al., 2018). Numerous                     similar productivity rates and wood structure in provenances
studies performed in these experiments focused on leaf phenology.            from mesic sites and local provenances adapted to dry conditions
A latitudinal trend in leaf flushing was observed, with northern             at the provenance trial, suggesting that provenances form mesic
and southern provenances being late and early flushing,                      conditions are able to adapt to drier conditions. Eilmann et al.
respectively, although some exceptions exist (Stojnić et al.,                (2014) confirmed that beech from southern provenances respond
2015). In addition, productivity and wood structure (Eilmann                 differently to drought conditions compared to those from
et al., 2014; Jezik et al., 2016; Klisz et al., 2019) or growth              northern provenances, suggesting genetic control of xylem
strategy and survival (Vitasse et al., 2010) were investigated.              performance in beech. Little is known about the impact of
Although such experiments provided important insights into                   drought conditions on the anatomical features of wood. Giagli
differences between provenances, they were usually performed                 et al. (2016) found higher vessel density (VD) and water
on relatively young trees, which exhibit different climate sensitivity       conductive area in a year characterized by drought conditions.
compared to older trees (Trouillier et al., 2018). Thus, studies             Schume et al. (2004) observed that drought conditions were
investigating the response to changing climate in adult beech                responsible for reduced vessel area in poplar. Furthermore,
populations differing in leaf phenology in terms of xylem wood               Hajek et al. (2016) observed that beech responds to drought
structure are rare.                                                          by adjusting vessel number rather than vessel area. Similarly,
    Although leaf unfolding in spring coincides with the onset               Prislan et al. (2018) recorded differences in VD between two
of wood formation in beech (Čufar et al., 2008), no clear                    sites with sufficient water availability but at different altitude.
relationship between variation in leaf phenology and radial                  Unlike short-term wood formation studies, quantifying wood
growth was observed (Čufar et al., 2015). The variability of                 cell anatomical features in tree rings provides a long-term
climate conditions prior to and during the growing season                    approach to monitoring changes in growth phenology, climate
significantly affects tree growth and thus the productivity of               sensitivity, xylem functioning, and xylem plasticity (Abrantes
beech forests (Di Filippo et al., 2007). Different climatic factors          et al., 2012; Reyer et al., 2015; Castagneri et al., 2017). The
influence growth throughout the European beech distribution                  availability of this information may be critical for evaluating
range. In southern and western Europe, high temperatures in                  the range of plasticity in tree species under different
early spring positively affected the onset of beech xylem                    environmental conditions and, ultimately, for predicting their
production, which is reflected in wider tree rings while high                responses to future climate scenarios.
summer temperatures showed a negative effect on growth (Di                       The aim of this study was to analyze the relationships
Filippo et al., 2007; Čufar et al., 2008; Lenz et al., 2013;                 between climatic conditions, tree ring widths, and xylem vessel
Martinez del Castillo et al., 2018). In northern and north-                  features in beech in three forest stands with different climatic
eastern parts of Europe, summer precipitation and frequent                   regimes and different leaf phenology of beech (two early and
spring frosts positively and negatively influenced beech radial              one late flushing site; Kramer et al., 2017; Robson et al., 2018)
growth, respectively (Weigel et al., 2018; Harvey et al., 2019;              for a period between 1960 and 2016. By subdividing annual
Muffler et al., 2020). At the limit of the eastern distribution              xylem increments into quarters, we evaluated intra-annual
range, annual increments in beech were positively affected by                variations in the vessel characteristics to understand how beech
late spring precipitation and negatively by summer temperatures              from the selected sites adjust xylem anatomy to short-term
(Šimůnek et al., 2019). In central and south-central Europe,                 changes in growth conditions, as previously shown by Sass
tree ring width in beech was positively correlated with summer               and Eckstein (1995), Abrantes et al. (2012), and Castagneri
precipitation while more frequent drought-induced extreme                    et al. (2017). In addition, we analyzed the influence of extreme
climatic events were the main negative influencing factor on                 weather events (i.e., exceptionally hot or wet summers) on

Frontiers in Plant Science | www.frontiersin.org                         2                                        July 2021 | Volume 12 | Article 669229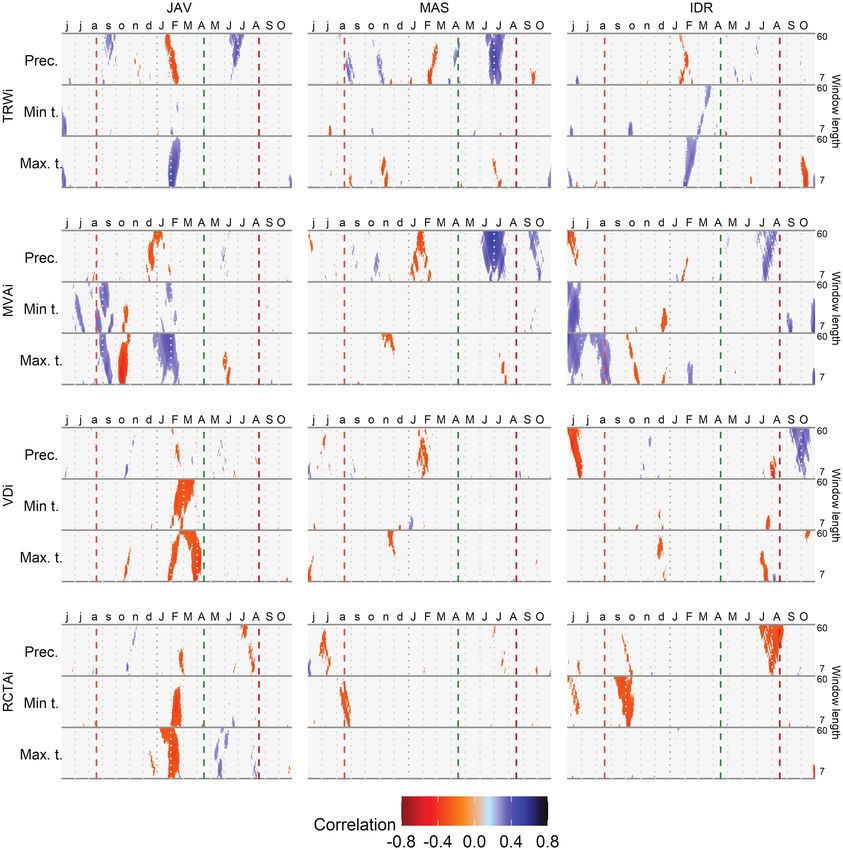
Arnič et al.                                                                                                    Climate-Growth Interactions in Beech

vessel features within the tree rings. We hypothesized that (1)            performed using CooRecorder & CDendro software (Cybis,
there is no relationship between tree-ring widths (TRWs) and               Saltsjöbaden, Sweden). The final cross-dating was done using
vessel area because they contain different climatic information;           PAST-5 (SCIEM, Brunn, Austria) software.
(2) beech trees at the selected sites respond differently to local
climatic conditions with respect to TRWs and vessel features               Analysis of Xylem Vessel Features
suggesting adaptation to local conditions; (3) intra-annual                Quantitative wood anatomy analysis was performed on six
vessel-climate relationship is not temporarily stable resulting            randomly selected cores per site. The random selection was
in different trend of climatic signal in vessel area; and (4) at           used to ensure representative within-population variability rather
the site with the late flushing population, trees are more                 than maximizing the climate signal. Since the same cores were
susceptible to weather variation than those characterized as               used as for TRW measurements, they were first soaked in water
early flushing, due to the shorter growing season.                         before removal from the wooden holders. The samples were
                                                                           then prepared for observations under a light microscope according
                                                                           to the protocol suggested by von Arx et al. (2016); i.e., each
MATERIALS AND METHODS                                                      core was split into segments of similar length (3–4 cm). A
                                                                           15–20 μm thick transverse section was cut from each segment
Study Species, Site Characteristics, and                                   with a WSL sledge microtome using OLFA-80×9 mm spare
Climate Data                                                               blades (Gärtner et al., 2015). The sections were then treated
The selected forest sites represent origin forest stands for three         with bleaching solution (5–15% chlorine content) to remove
European beech provenances in Slovenia, i.e., Idrija, Javornik,            sawdust from the cell lumina and to improve the staining intensity
and Mašun. Seed collected at these sites was previously used               in the subsequent staining with a water mixture of safranin
in European beech provenance trials, in which differences in               and Astra-blue. Permanent slides were prepared using Euparal
leaf phenology, growth trends, and survival strategies were                mounting medium. High-resolution images (0.514 pixel/1 μm)
assessed (von Wühlisch, 2004; Gömöry and Paule, 2011; Robson               of the sections were prepared using a Leica DM 4000 B light
et al., 2011); beech at the Idrija site (IDR) is a late flushing,          microscope (Leica Microsystems, Wetzlar, Germany) at 50×
while beech from Mašun (MAS) and Javornik (JAV) are                        magnification, a Leica DFC 280 digital camera (Leica Microsystems,
characterized as early flushing. All studied sites are located at          Wetzlar, Germany), and LAS image analysis software (Leica
a similar altitude between 904 and 958 m a.s.l. and belong                 Application Suite). Image-sequences of the xylem rings were
to the Abieti-Fagetum forest association (Table 1).                        captured with at least 25% of the overlapping area and then
   We used the E-OBS daily climate data version 21e o 0.1                  merged using PTGui v11.16 Pro (New House Internet Services
regular grid (Cornes et al., 2018) and extracted mean, minimum             B.V., Rotterdam, Netherlands). Panoramic pictures were then
and maximum daily temperatures, and sum daily precipitation                processed with image analysis software Image-Pro Plus 7.1 and
from the nearest grid point. All sites receive relatively large            ROXAS (v3.0.437) to obtain vessel features (von Arx and Carrer,
amounts of precipitation, i.e., between 1,500 and 2,100 mm                 2014). Vessel lumen areas were measured within each ring for
annually, which are nearly equally distributed over the entire             the period 1940–2016. Chronologies of the following parameters
year, with a peak in October and November (Figure 1;                       were then established; (1) mean vessel area (MVA), (2) VD as
Supplementary Figure S4). The E-OBS climate database refers                the number of vessels per squared mm, and (3) relative conductive
to records from weather stations where daily climate data were             area (RCTA) representing the percentage of cumulative vessel
collected from ground-based observation stations, operated by              area within the measured area (the radial width of the measured
the National Meteorological Services between January 1950                  area was represented by TRW, while the tangential width of
and December 2019 (Cornes et al., 2018). Since the national                the measured area was around 2 mm). Furthermore, to assess
weather stations located around the selected sites started recording       the intra-annual variability of vessel features, each vessel was
climate data around 1960, we identified the 1960–2016 periods              assigned to one of four radial tree-ring sectors of equal width
as optimal and used this for further analyses.                             (henceforth “quarters”) based on its center coordinate and then
                                                                           MVA was calculated for each quarter (Q1–Q4 MVA).
Sampling and Tree-Ring Width
Measurements                                                               Statistical Analyses
Sampling was performed at the end of August in 2016, when                  All raw TRW series, as well as annual time series of vessel features,
the xylem ring was already fully formed (Prislan et al., 2013).            i.e., MVA, VD, RCTA, and Q1–Q4 MVA, were standardized using
At each site, 17 dominant beech trees were selected, with an               the detrend() function from dplR (Bunn, 2008). A cubic smoothing
average diameter at breast height (DBH) of 42 ± 6 cm (Table 1).            spline with a 50% frequency cut-off at 32 years was fitted to
Two cores were collected per tree using a 5-mm increment                   each individual raw series. To obtain a detrended index, the ratio
borer (Haglöf Sweden, Långsele). In the laboratory, the collected          between the observed and fitted values was calculated. Finally,
cores were air-dried and fixed on wooden holders. They were                for each parameter and site, standardized series were pre-whitened
then sanded to obtain a clear surface for recognition of tree              and averaged to residual chronologies by computing the robust
ring borders. ATRICS (Levanic, 2009) was used to capture                   bi-weight mean. Residual chronologies were therefore used to
high-resolution digital images, while TRW measurements were                calculate climate-growth correlations, while raw series were compared

Frontiers in Plant Science | www.frontiersin.org                       3                                        July 2021 | Volume 12 | Article 669229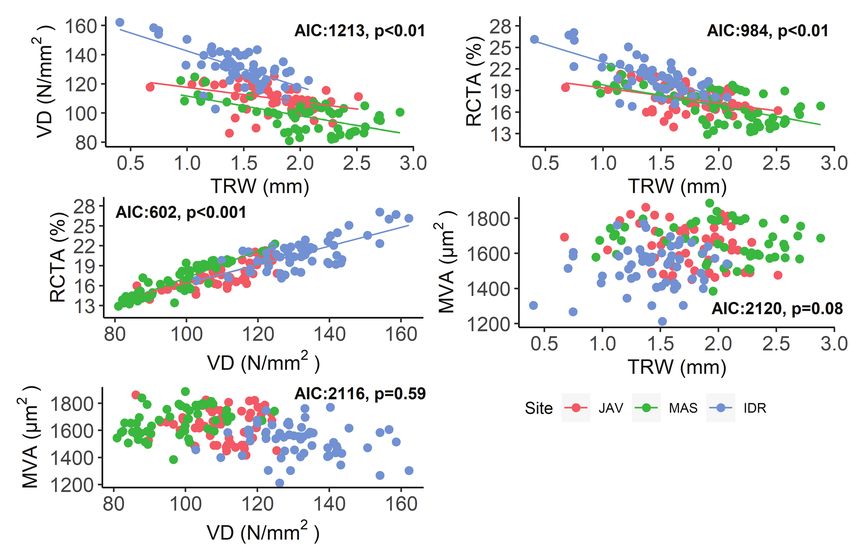
Arnič et al. Climate-Growth Interactions in Beech
to assess differences among sites. Please note, since we use raw
and detrended chronologies, we refer to raw chronologies as TRW,
H (m)
30.0
28.0
27.5
TABLE 1 | Characteristics of the sites JAV, MAS, and IDR; representing the local site conditions, as well as sampled tree characteristics, number of trees (N), mean diameter at breast height (DBH), and mean tree
MVA, VD, RCTA and Q1-Q4 MVA, while detrended chronologies
are referred to by the postposition “i,” i.e., TRWi, MVAi, VDi,
Tree characteristics
RCTAi, and Q1–Q4 MVAi. The quality of site chronologies was
DBH (cm)
described with common descriptive statistics, such as expressed
43.0
39.1
43.7
population signal (EPS), mean inter-series correlation (rbar), and
Gleichlaufigkeit (%GLK; Cook and Kairiukstis, 1990).
To test the hypothesis of equal means of tree-ring
characteristics, i.e., TRW, MVA, VD, RCTA, and Q1–Q4 MVA
17
17
17
N
among the sites, we used parametric and non-parametric
statistical tests. Repeated measures (rm) ANOVA was used
when assumptions for parametric tests were met, while in
Precipitation
other cases, the nonparametric Friedman test was applied.
(mm)
Similarly, subsequent pairwise comparisons for rmANOVA were
1,514
1,609
2,090
assessed with Tukey’s test, while for the Friedman test; pairwise
comparisons were done with the Wilcoxon test. Finally, linear
regression models were used to assess the relationships between
TRW and vessel features (MVA, VD, and RCTA).
Minimal
2.8
1.7
4.2
Climate-growth correlations were analyzed using the daily_
response() function from the dendroTools R package (Jevšenak
and Levanič, 2018; Jevšenak, 2020), whereby day-wise aggregated
Temperature (°C)
correlations were calculated using 1,000 bootstrap samples
Maximal
considering all windows between 7 and 60 days from the
13.0
11.1
13.2
previous June to the current October. Pearson correlation
coefficients were calculated for the 1960–2016 period and only
those with p < 0.05 were used to infer the relationship of
Average
climate and TRWi and vessel features (i.e., MVAi, VDi, and
7.9
6.4
8.4
RCTAi within the tree rings, and in the case of MVAi also
within the tree-ring quarters).
To assess the plasticity of tree-ring structure resulting from
Inclination (°)
extreme weather conditions, we employed an additional
Site characteristics
comparison of standardized tracheograms (Schume et al., 2004)
10
11
10
and compared these within three extreme dry and wet summers.
Extreme years at each site were selected according to maximal
or minimal amount of precipitation between the first of June
and first of August, respectively. To ensure the selection of
extreme years, the standardized precipitation evapotranspiration
Aspect
index (SPEI) was calculated (Vicente-Serrano et al., 2010). An
SW
SE
S
ANOVA test was performed to test the differences of relationship
between tree ring width characteristics (TRW, VD, and RCTA)
Limestone,
Sandstone
45° 43' 59,09" 14° 20' 59,38" Limestone
45° 37' 59,87" 14° 23' 00,43" Limestone
and climatic conditions (maximum and minimum temperatures,
Bedrock
46° 00' 09,71" 13° 53' 52,94" Flint, and
precipitation amount, and SPEI) between dry and wet years.
Furthermore, to develop the tracheograms, we divided the area
of each vessel by the raw MVA in the particular year to account
Longitude
for the age-related trend (Carrer et al., 2015). We then smoothed
each trend using the general additive model (GAM), which
were then used in the Kolmogorov–Smirnov test to infer
statistically significant differences in the intra-annual MVA
Latitude
distribution in years with extreme wet and dry conditions.
RESULTS
Tree-Ring Width and Vessel Features
height (H).
The local TRW chronologies at MAS, JAV, and IDR were between
MAS
Site
JAV
IDR
112 and 151 years long (Table 2). The widest mean TRW for
Frontiers in Plant Science | www.frontiersin.org 4 July 2021 | Volume 12 | Article 669229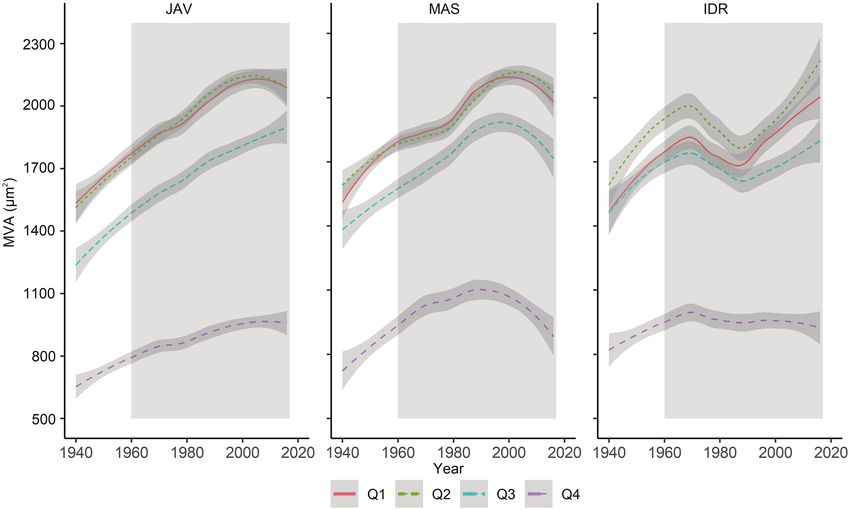
Arnič et al.                                                                                                                       Climate-Growth Interactions in Beech

  FIGURE 1 | Geographical locations and climate diagrams of selected sites, i.e., Idrija (IDR), Javornik (JAV), and Mašun (MAS). Climate diagrams are based on
  E-OBS daily climate datasets for the period from 1960 to 2016.

TABLE 2 | Tree ring width and wood anatomy chronologies and descriptive statistics: first-order autocorrelation (AC1), Gleichläufigkeit coefficient (%GLK), mean inter-
series correlation (rbar), and expressed population signal (EPS) for the selected sites; Javornik (JAV), Masun (MAS), and Idrija (IDR).

Site                                               Start year      End year                AC1                 %GLK                   rbar                  EPS

JAV                         TRW                      1885             2016                 0.63                   69                  0.38                  0.89
MAS                                                  1904             2016                 0.80                   64                  0.48                  0.93
IDR                                                  1865             2016                 0.77                   66                  0.25                  0.83
JAV                         MVA                      1940             2016                 0.59                   49                  0.45                  0.83
MAS                                                  1940             2016                 0.56                   50                  0.32                  0.74
IDR                                                  1940             2016                 0.63                   53                  0.01                  0.04
JAV                          VD                      1940             2016                 0.63                   51                  0.04                  0.04
MAS                                                  1940             2016                 0.73                   53                  0.06                  0.29
IDR                                                  1940             2016                 0.61                   52                  0.10                  0.38
JAV                         RCTA                     1940             2016                 0.64                   49                  0.19                  0.58
MAS                                                  1940             2016                 0.62                   52                  0.11                  0.42
IDR                                                  1940             2016                 0.68                   54                  0.14                  0.48
JAV                       MVA-Q1                     1940             2016                 0.51                   54                  0.32                  0.74
JAV                       MVA-Q2                     1940             2016                 0.58                   47                  0.35                  0.79
JAV                       MVA-Q3                     1940             2016                 0.48                   50                  0.32                  0.74
JAV                       MVA-Q4                     1940             2016                 0.37                   51                  0.23                  0.64
MAS                       MVA-Q1                     1940             2016                 0.50                   51                  0.28                  0.69
MAS                       MVA-Q2                     1940             2016                 0.52                   50                  0.31                  0.73
MAS                       MVA-Q3                     1940             2016                 0.43                   50                  0.23                  0.64
MAS                       MVA-Q4                     1940             2016                 0.37                   53                  0.30                  0.71
IDR                       MVA-Q1                     1940             2016                 0.55                   54                  0.08                  0.32
IDR                       MVA-Q2                     1940             2016                 0.54                   54                  0.06                  0.26
IDR                       MVA-Q3                     1940             2016                 0.49                   53                  0.04                  0.15
IDR                       MVA-Q4                     1940             2016                 0.46                   53                  0.04                  0.16

the 1960–2016 period was measured at MAS (2 ± 0.5 mm),                                    The measured vessel traits generally exhibited significant
followed by JAV (1.8 ± 0.3 mm) and IDR (1.4 ± 0.3 mm);                                 relationships with TRW (Figure 3). At all sites, a negative
the differences were statistically significant (Figure 2A). The                        relationship was observed between TRW and VD and between
measured vessel features VD and RCTA were significantly different                      TRW and RCTA, indicating differences in theoretical specific
between all sites (Figures 2B–C). MVA was similar at MAS                               conductivity and vessel densities between wider and narrower
and JAV, but significantly different at site IDR (Figure 2D).                          tree rings (Figures 3A,B; Supplementary Tables S2 and S3).

Frontiers in Plant Science | www.frontiersin.org                                   5                                               July 2021 | Volume 12 | Article 669229
Arnič et al.                                                                                                                        Climate-Growth Interactions in Beech

                         A                                                              B

                         C                                                              D

                         E                                                              F

                         G                                                              H

  FIGURE 2 | Differences among the sites Javornik (JAV), Mašun (MAS), and Idrija (IDR) in (A) tree ring width (TRW), (B) vessel density (VD), (C) relative conductive
  area (RCTA), (D) mean vessel area (MVA), and (E-H) MVA in first to fourth quarter of tree ring (MVA-Q1–MVA-Q4) analyzed by rm-ANOVA or the Friedman test.
  Significance of differences in tree ring characteristic between sites are market by ns-not significant. *p < 0.05, **p < 0.01, ***p < 0.001, and ****p < 0.0001.
  Additional information is available in Supplementary Table S1.

Consequently, RCTA and VD showed a significant positive                                 neither there was no significant relationship between TRW
relationship at all sites (Figure 3C; Supplementary Table S4);                          and MVA, nor between VD and MVA (Figures 3D,E;
rings with higher VD resulted in higher RCTA. As expected,                              Supplementary Tables S5 and S6).

Frontiers in Plant Science | www.frontiersin.org                                    6                                               July 2021 | Volume 12 | Article 669229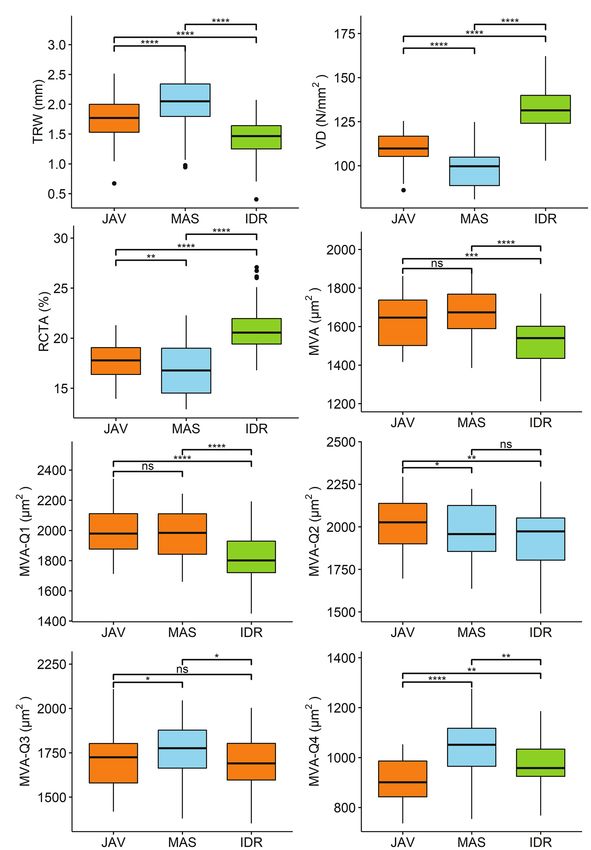
Arnič et al.                                                                                                                 Climate-Growth Interactions in Beech

                A                                                                       B

                    C                                                               D

                E

  FIGURE 3 | Relationships between: (A) vessel density (VD) and tree-ring width (TRW), (B) relative conductive area (RCTA) and TRW, (C) RCTA and VD, (D) mean
  vessel area (MVA) and TRW, and (E) MVA and VD in beech at Javornik (JAV), Mašun (MAS), and Idrija (IDR) with models Akaike information criterion (AIC) and
  significance level. Further statistical information for the presented generalized linear models is given in Supplementary Tables S2–S6.

    Further comparison of MVA values in the tree-ring quarters                      correlations. The time window of 7–60 days showed a relatively
showed a consistent decrease in vessel area from the first to the                   constant climate response with the most pronounced correlations
last quarter (Figure 4). In general, MVA was similar in the first                   between 25 and 35 days. In the case of the MVA, high correlations
and second quarters, but was smaller in the third and fourth                        were also observed for shorter time-windows (7–20 days; Figure 5).
quarters (Figures 2E–H, 4). The differences in MVA between the                          The highest correlations were observed at JAV; the inter-
first and second quarters were largest at IDR, while at MAS and                     annual variability of TRWi was mainly related to the conditions
JAV, the values were similar (Figure 4). MVA in the third quarter                   in late winter, when maximum temperature and precipitation
was smaller than in the first two quarters at all sites. A decrease                 showed positive (rtmax > 0.40) and negative (rprec < −0.30)
in MVA from the second to the third quarter was between 10%                         correlations, respectively. The highest negative correlation at JAV
at MAS and 15% at JAV. An abrupt decrease in MVA was noted                          was observed between the previous autumn maximum temperature
for the fourth quarter, where MVA at all selected sites decreased                   (rtmax > 0.40) and MVAi, while the maximum temperature at
by more than 40% compared to the third quarter (Figures 2G,H;                       the end of winter shoved a positive correlation (rtmax > 0.30).
Supplementary Table S1). Nevertheless, inter-quarter correlation                    VDi and RCTAi were negatively correlated by both maximum
analyses revealed a relatively strong positive relationship between                 and minimum temperature in late winter and early spring.
MVA in the individual tree-ring quarters at each site. At JAV                       Correlations between climate parameters and tree-ring features
correlation values were similar between quarters, while slightly                    were the least pronounced at IDR, where the highest positive
lower correlation values were found between the first and last                      correlations were found between MVAi and minimum and
quarters at sites MAS and IDR (Supplementary Figure S1).                            maximum temperatures at the end of the previous growing
                                                                                    season (rtmax > 0.30). Furthermore, the maximum temperature
The Effect of Climate Variables on                                                  at the beginning of the growing season positively correlated
Tree-Ring and Vessel Parameters                                                     with TRW. While at MAS, the variability in TRWi and MVAi
Correlation analysis between long-term daily climate data and                       was mainly positively correlated with early summer precipitation.
the studied tree-ring parameters showed a strong and significant
association with temperature and precipitation at all sites (Figure 5).             The Effect of Climate on Intra-Annual
In general, the most important climatic factors related to tree-                    Vessel Area Characteristics
ring characteristics were amount of precipitation and maximum                       Correlation analysis revealed differences in MVAi responses to
temperature, while minimum temperature showed lower                                 changing climatic conditions among the tree-ring quarters. In

Frontiers in Plant Science | www.frontiersin.org                                7                                            July 2021 | Volume 12 | Article 669229
Arnič et al. Climate-Growth Interactions in Beech
FIGURE 4 | Long-term trends in MVA in evaluated tree-ring quarters (Q1–Q4) at Javornik (JAV), Mašun (MAS) and Idrija (IDR). The gray area represents the period
between 1960 and 2016, which was considered for further analysis. The relationships between sectors are presented in Supplementary Figure S1.
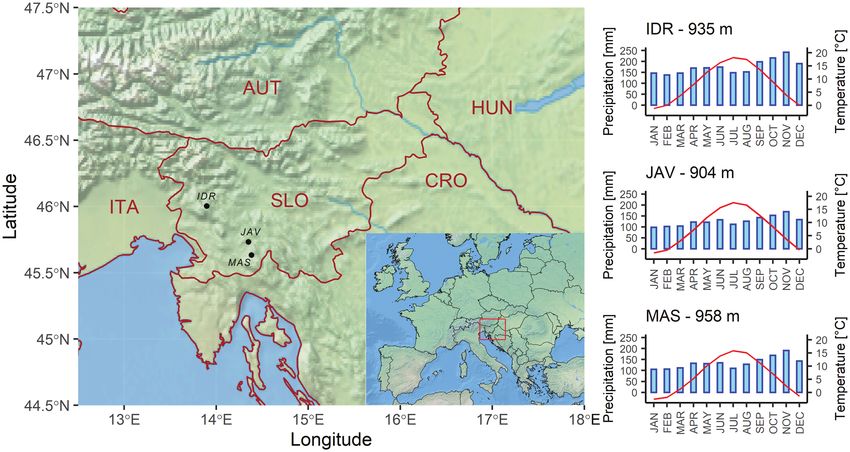
addition, differences in response to climate variations were in general lower than those of the other three quarters. The
observed among the forest sites (Figure 6). In general, precipitation exception was maximum temperature at JAV, which showed
and maximum temperature were the main climatic drivers high negative correlations in the previous autumn (rtmax < −0.50).
significantly correlated with MVAi among quarters (Figure 6). In the fourth quarter, the highest positive correlations were
Temporarily similar patterns of climate response among the observed between MVAi and summer precipitation (rprec > 0.55),
sites were noticed for late spring temperature in the first quarter while maximum temperature during the summer revealed
and late summer precipitation in the fourth quarter. The weakest negative correlations on MVAi (rtmax < −0.4). Correlation analysis
correlation values in all quarters were observed with minimum also revealed a mostly reverse climatic signal between the end
temperature at MAS and precipitation at the site IDR, suggesting of the previous and the current growing seasons. At the end
low sensitivity of MVAi to these climatic factors. Daily response of the previous growing season, MVAi of all quarters of tree
functions revealed similar climate signal across 7–60 days climate ring was positively and negatively correlated with temperature
window. In the case of maximum and minimum temperatures, and precipitation, respectively. However, in the current growing
higher signal was observed for shorter time-windows (7–20 days), season, the relationship between MVAi of all quarters and
while for precipitation, the highest signal was found with longer temperature and precipitation was just the opposite.
time windows, i.e., 20–35 days (Figure 6).
In the first quarter of the tree rings, the strongest correlations
were observed with conditions at the end of the previous Impact of Extreme Weather Conditions
growing season and in the current year’s spring. In general, During Summer on the Studied Tree-Ring
temperature negatively affected MVAi in late spring (rtmax > 0.35), Parameters
while the positive correlations were revealed at the end of the Because late summer precipitation of the current growing season
previous growing season (rtmin > 0.30). In the same time intervals, showed the highest correlation with MVA within quarters,
precipitation showed the opposite correlations on MVAi than we identified 3 years with the driest and wettest summers at the
temperature. In the second quarter, precipitation before and selected sites to compare intra-annual vessel area distributions
during the growing season showed a negative (JAV: rprec < −0.40) between extreme wet and dry conditions. Compared to wet
and positive (JAV: rprec > 0.40; MAS: rprec > 0.30) correlations summers, drier summer conditions resulted in narrower TRW,
with MVAi, respectively. Furthermore, maximum temperature higher VD, and, consequently, a higher RCTA. Differences in the
showed the highest positive correlation at the end of the studied tree-ring parameters between wet and dry summer conditions
previous growing season at JAV (rtmax > 0.45), although were significantly different at MAS and JAV, while beech at IDR
correlations were negative during the current growing season showed smaller, insignificant differences in tree ring width parameters
(rtmax < −0.35). In the third quarter, correlation values were between extremely dry and wet years (Table 3).
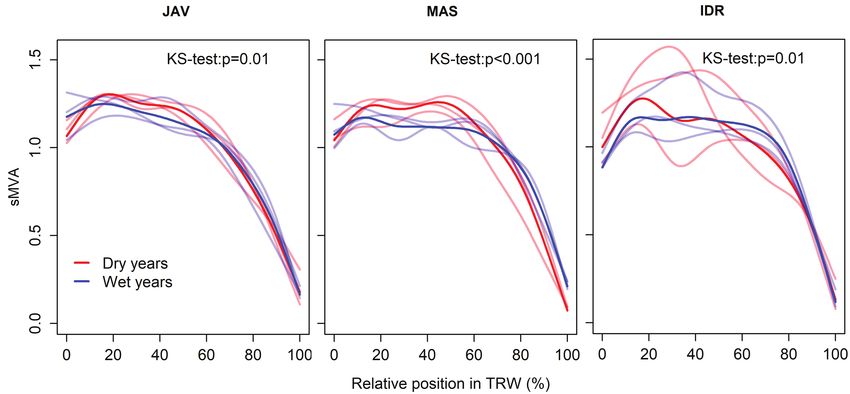
Frontiers in Plant Science | www.frontiersin.org 8 July 2021 | Volume 12 | Article 669229Arnič et al. Climate-Growth Interactions in Beech FIGURE 5 | Correlations between standardized tree-ring chronologies (tree ring width - TRWi, mean vessel area - MVAi, vessel density - VDi and relative conductive area - RCTAi) and maximum and minimum daily temperature and daily precipitation sums at Javornik (JAV), Mašun (MAS) and Idrija (IDR) using a time window spanning between 7 and 60 days. Vertical dashed lines from left to right depict the approximate timing of the growing season based on previous data (Prislan et al., 2013): end of previous growing season (light red), start (green), and end (dark red) of current growing season. In general, vessels with the largest lumen area usually DISCUSSION appeared between 15 and 40% of the tree ring width, whereas initial vessels were slightly smaller (Figures 7A–C). Furthermore, A comparison of TRW and vessel features, and their relationships a different declining trend in MVA was observed in the second with climate factors, revealed differences between beech trees half of the tree ring width in the case of wet and dry summers. from three sites in Slovenia differing in climate conditions In a wet summer, MVA slowly decreased to 60–70% of tree and leaf phenology. At all sites, a significant relationship was ring width, while an abrupt decrease in MVA was observed found between VD, RCTA, and TRW, while MVA showed in the last 25% of the tree ring width. In a dry summer, no relationship with other parameters, suggesting different MVA significantly decreased after 50% of tree ring width. At response to variation in temperature and precipitation. Our all sites, the differences in intra-annual trends between dry first hypothesis was thus confirmed. We also confirmed our and wet summers were significant (Figure 7). The most second hypothesis; the response of TRW, VD, and RCTA to pronounced differences in decreasing MVA trend were observed local climatic conditions differed between sites at the inter- at MAS (Figure 7B). annual level. Differences were also observed between sites in Frontiers in Plant Science | www.frontiersin.org 9 July 2021 | Volume 12 | Article 669229
Arnič et al.                                                                                                                          Climate-Growth Interactions in Beech

  FIGURE 6 | Correlation analysis between the standardized chronologies of mean vessel area (MVA) in quarters Q1–Q4 and maximum and minimum daily
  temperature and daily precipitation sums at Javornik (JAV), Mašun (MAS), and Idrija (IDR) using a time window spanning between 7 and 60 days. Vertical dashed
  lines from left to right depict the approximate timing of the growing season based on previous data (Prislan et al., 2013): end of previous growing season (light red),
  start (green), and end (dark red) of current growing season.

the MVA climatic signal at the intra-annual level. In addition,                           Relationship Between Measured Tree-Ring
the response of MVA varied temporally within the tree ring;                               Parameters
the first quarter showed the highest correlation with the                                 We developed multi-decadal chronologies of TRW and vessel
previous year’s climatic conditions, while the last quarter                               features at the three forest sites representing the original stands
showed the highest correlations with current summer conditions                            of three Slovenian beech provenances. The comparison showed
(confirming our third hypothesis). However, under extreme                                 significant differences among sites in terms of TRW, VD, and
weather conditions (i.e., dry summer), trees at all sites responded                       RCTA. Further correlation analysis revealed that, in wider tree
similarly (i.e., narrower TRW, higher VD, and RCTA). Contrary                             rings, VD and RCTA were generally smaller, which is in agreement
to our expectations, trees at IDR (which is characterized as                              with previous studies (Eilmann et al., 2014; Oladi et al., 2014;
a late flushing site) showed the least pronounced response                                Diaconu et al., 2016). Since vessels of multiple years are involved
to climatic conditions compared to the other two sites,                                   in water transport in diffuse-porous beech, the influence of a
(characterized as early flushing), therefore the fourth hypothesis                        single tree ring on the total water-transport capacity is only
was rejected.                                                                             partial (Gasson, 1985). Nevertheless, higher RTCA in narrower

Frontiers in Plant Science | www.frontiersin.org                                     10                                               July 2021 | Volume 12 | Article 669229
Arnič et al.                                                                                                                               Climate-Growth Interactions in Beech

TABLE 3 | Differences in mean tree-ring parameters and mean summer climatic conditions among the three wettest and driest years at sites Javornik (JAV), Mašun
(MAS), and Idrija (IDR).

                                                                                                                            Extreme June – July climate
Site            Season          Year                 TRW                 RCTA                  VD
                                                                                                                           Max. temp Min.    temp
                                                                                                          Prec. (mm)                                                 SPEI
                                                                                                                              (°C)        (°C)

                Dry      2006; 2012; 2013          1.2               21.0                121              110               25.1              11.3             −2.29
JAV                                                          **                  **
                                                                                                    ns              ***               ***                **                 ***
                Wet      1965; 1961; 1989          2.1               16.4                108              402               21.1               8.9              0.81
                Dry      2006; 2013; 2016          1.1               20.3                115              89                22.5               9.9             −2.44
MAS                                                          **                  ***                **              ***               ***                **                 ***
                Wet      1961; 1965; 1989          2.2               14.3                85               392               18.9               7.4              0.66
                Dry      1994; 2003; 2006          1.3               21.2                138              174               26.2              13.7             −1.69
IDR                                                          ns                  ns                 ns               **               ***                **                 ***
                Wet      1995; 1980; 1990          1.5               19.8                128              543               21.0              10.8              0.89

TRW, tree-ring width; RCTA, relative conductive area; VD, vessel density; Prec, precipitation amounts; Max. temp, maximum temperatures; Min. temp, minimum temperatures; and
SPEI, standardized precipitation evapotranspiration index; JAV, MAS, and IDR. Significance of differences in tree ring characteristic and climate variables between dry and wet
seasons (ANOVA) is market by ns, not significant; **p < 0.01 and ***p < 0.001.

rings suggests priority being given to water transport rather                               and thus temperature mainly controls growth. Similar findings
than mechanical functions, since the need for additional strength                           were recently shown for Norway spruce, where only temperature
becomes less important in adult trees (Rao et al., 1997).                                   was found to be a limiting climatic factor at sites with more
   In contrast to VD and RCTA, MVA did not show significant                                 than 1,600 mm annual precipitation (Jevšenak et al., 2021).
relationships with TRW. Similar results for beech were reported                                Based on 10-year xylogenetic observations of beech from
by Sass and Eckstein (1995) and Diaconu et al. (2016), who                                  two sites in Slovenia (Prislan et al., 2019), we estimated that
concluded that MVA is affected by different environmental                                   the growing season at the forest sites included in this study
signals than TRW and can therefore be used as an additional                                 starts at the beginning of May and ends by mid-August.
ecological indicator. Oladi et al. (2014) suggested that VD and                             According to these estimates, TRW at the selected sites is
TRW are highly dependent on environmental factors, while                                    mostly controlled by temperature before the growing season
MVA and RCTA are more endogenously controlled and therefore                                 and current summer precipitation (Figure 5; Piovesan et al.,
show less year-to-year variation (Carrer et al., 2015). Here,                               2005; Skomarkova et al., 2006). By comparing sites in southern
we observed that MVA was similar at JAV and MAS, while                                      and western Europe, Hacket-Pain et al. (2016) identified previous
it was significantly smaller at IDR, which could be linked to                               and current summer temperatures and summer precipitation
differences in leaf phenology. In several genetic studies (Brus,                            as the main climatic signals affecting the growth of beech.
2010; Robson et al., 2018), the beech population at IDR was                                 While for northern and north-eastern part of beech distribution
considered to be late flushing, which could be an adaptation                                range, growth was limited by combination of spring frost and
to surviving long winters during the last glacial period. The                               drought stress (Muffler et al., 2020). Finally, growth reduction
importance of the genetic predisposition of beech has been                                  in beech may also be associated with late spring frost, summer
studied in recent decades with common garden experiments                                    drought, or mast years, which are also strongly affected by
(Eilmann et al., 2014; Hajek et al., 2016). Eilmann et al. (2014)                           temperature (Kolář et al., 2017; Hacket-Pain et al., 2018; Gazol
reported that radial increments in beech are mostly controlled                              et al., 2019; D’Andrea et al., 2020). Due to climate warming,
by environment, while the water transport system may reflect                                a higher masting frequency of beech has been observed in
provenance-specific adaptation and thus genetic predisposition.                             recent decades in Central Europe (Bogdziewicz et al., 2021).

Climate Influence on Tree-Ring Width                                                        Climate Influence on Vessel Features
Trees at JAV showed the strongest response to variation in                                  Variation in vessel diameter is one of the most important
climatic conditions and trees at IDR the weakest. IDR was                                   parameters for evaluating tree-water relations. Vessel diameter
characterized by the highest amount of annual precipitation                                 determines numerous physiological xylem traits, such as hydraulic
and had the highest average annual temperature among the                                    conductivity, vulnerability to freezing-induced embolism,
sites (Table 1). Considering the findings from provenance trials                            vulnerability to drought-induced cavitation, and probably also
(e.g., Robson et al., 2011) that IDR is a late flushing provenance,                         to pathogen spread. By adjusting vessel diameter, number and
it could be assumed that radial growth at this site occurs at                               distribution within annual rings, trees regulate water transport
higher temperatures and that the trees are therefore less sensitive                         efficiency and xylem safety (Oladi et al., 2014; Gleason et al.,
to fluctuations in climatic conditions (Prislan et al., 2013;                               2016). Hajek et al. (2016) found that beech copes with drought
Martinez del Castillo et al., 2018). Similar weak climate-growth                            stress by adjusting vessel number rather than vessel area. Most
relationships have been found for several other beech forest                                recent studies, however, have shown that certain tree-level
sites in the eastern Alps at elevations between 800 and                                     properties, such as tree size and crown size, explain vessel
1,100 m a.s.l. (Dittmar et al., 2003; Di Filippo et al., 2007).                             diameter variation much more than general climatic conditions
This implies that precipitation is not limiting at these sites,                             (Rosell et al., 2017). Due to basipetal vessel widening, vessel

Frontiers in Plant Science | www.frontiersin.org                                       11                                                   July 2021 | Volume 12 | Article 669229
Arnič et al. Climate-Growth Interactions in Beech
A B C
FIGURE 7 | Standardized tracheograms sMVA in common beech for the wettest and the driest summer seasons at the selected sites; (A) Javornik (JAV),
(B) Mašun (MAS), and (C) Idrija (IDR). Red and blue lines represent extreme dry and wet years, respectively. Lines with more intensive color represent the mean
while transparent lines showing the variability of the selected 3 years for each extreme climate condition. The differences between general additive model (GAM)
trends were tested by the Kolmogorov–Smirnov test.
area also depends on its position in a tree (Anfodillo et al., features, only MVA showed consistently high correlations with
2012), which needs to be considered when conduit characteristics different climatic parameters at all sites, but at different time
among different trees and sites are compared (Carrer et al., periods. While MVA at IDR and JAV showed high positive
2015). In our study, beech trees of comparable heights were correlations with the temperature in the previous growing season,
sampled to rule out this effect on conduit properties. it was mainly correlated by summer precipitation at MAS. Although
The final area of vessels is influenced by endogenous (hormones the annual amount of precipitation at MAS is relatively high
and cell turgor) and environmental factors (temperature, water (more than 1,600 mm), it is located in the sub-Mediterranean
availability, and soil nutrients) to optimize xylem water transport Karst region, on soils with low water retention capacity (Bakalowicz,
from roots to leaves in terms of its safety and efficiency (Tyree 2015). Thus, trees can experience water deficit during growth,
and Sperry, 1989; Arend and Fromm, 2007; Hölttä et al., 2010; even with a relatively high amount of precipitation. The positive
Hacke et al., 2017). In beech, leaf development and cambial correlation between temperatures in summer and autumn of the
stem reactivation in spring occur almost simultaneously (Prislan previous year on vessel area at JAV and IDR could be explained
et al., 2013). Since leaf development is also environmentally by the relationship between cessation of wood formation in the
controlled, this may affect the rate of photosynthetic activity previous autumn and the onset of leaf phenology in the current
and auxin production, as well as the rate of their transport vegetation period, recently observed by Marchand et al. (2020).
within a tree. Coordination between leaf and stem vascular They found earlier bud-burst in the case of earlier cessation of
development therefore exists. The different timing of budburst wood formation in the previous year. Earlier bud burst and the
among selected sites thus suggests that environmental conditions development of leaves may be related to changes in hormone
at the onset of radial growth differ. It can be assumed that in concentrations (i.e., auxin) affecting the differentiation of vessels
the case of the late flushing beech at IDR, these processes (Aloni, 2007). The positive effect of previous autumn conditions
occur in the period of higher temperature compared to the may thus positively contribute to the amount of storage reserves,
early flushing beech at JAV and MAS. which are used for foliage development in the next spring and
There are contradicting findings in the literature regarding for maintaining winter respiration (Barbaroux et al., 2003).
the dendroclimatological potential of beech vessel features Furthermore, assuming sufficient water availability, we would
(Pourtahmasi et al., 2011). Vessel features are species-specific expect more photo-assimilates in a warm summer and,
characteristics, although external factors affect their final area consequently, greater carbohydrate reserves (and growth; Klesse
to some degree. The plastic response of beech tree-ring structure et al., 2020). Greater carbohydrate reserves could affect the turgor
in response to site conditions has been reported previously required and thus cell size (Cabon et al., 2020). Compared to
(Eilmann et al., 2014; Stojnić et al., 2015). Under favorable other species (e.g., pedunculate oak), the first quarter of tree
growing conditions, precipitation and temperature do not affect ring width in beech is less dependent on stored carbohydrate
vessel characteristics (Prislan et al., 2018), while in an extremely reserves because its growth starts at the same time as leaf
dry year, a significant link between soil moisture and vessel area development, which quickly start to supply developing tissues
has been found (Giagli et al., 2016). Of all the measured vessel with assimilates (Barbaroux and Bréda, 2002).
Frontiers in Plant Science | www.frontiersin.org 12 July 2021 | Volume 12 | Article 669229Arnič et al. Climate-Growth Interactions in Beech
Although beech is a diffuse-porous species, vessel area in spatial distribution (Saltre et al., 2015). In addition, extreme
initial and terminal parts of the tree ring differs, being smaller weather events may have different effects on tree growth (Weigel
in the latter part (Sass and Eckstein, 1995; Prislan et al., 2018). et al., 2018). Climate-associated severe events, such as droughts,
We found that initial vessels were smaller than the subsequent ice storms, and heatwaves, amplify the susceptibility of beech to
ones (Figure 7), which may reflect different environmental secondary damage by various pathogens and pests (La Porta
conditions at the time of their formation, especially in terms et al., 2008). Also in this study, we observed an unusual trend
of moisture supply. On an intra-annual scale, no atypical in the MVA chronology at IDR, indicating a decline in MVA
distribution of vessel area (e.g., intra-annual density fluctuations – around 1980 (Figure 4). Indeed, historical records show a large-
IADFs) was observed at any of the selected forest sites scale ice break disturbance at this site (Šifrer, 1977), which seems
(Supplementary Figure S2). In the first, second, and third to have affected the growth of some trees. Recent studies showed
quarters, MVA was similar among the sites (Figure 2), while that late spring frost essentially influenced beech foliage and TRW
in the last quarter, MVA significantly differed among all sites, in the current year (D’Andrea et al., 2020; Decuyper et al., 2020;
suggesting a strong link with local conditions (Pourtahmasi et al., Sanguesa-Barreda et al., 2021). However, trees fully recovered in
2011). By dividing tree rings into quarters, relationships between the following growing season, which indicates high resilience of
MVA and climate conditions were evaluated at the intra-annual beech to this stress event (D’Andrea et al., 2020). In contrast,
level (Figure 6). To the best of our knowledge, apart from Sass no effect of summer drought was found on the radial growth
and Eckstein (1995), no such analyses have been performed for of beech in the current year (D’Andrea et al., 2020), but it may
beech. We found that different climatic variables generally be evident in the following year (Decuyper et al., 2020).
controlled the distribution of vessel area within tree rings at In addition to TRW, extreme climatic events significantly
the selected sites. In the first quarter, MVA negatively and affect leaf phenology and wood anatomy (Bräuning et al., 2016;
positively correlated with maximum temperature and precipitation Carrer et al., 2016; Popkova et al., 2018). It was found that
before the growing season and in spring, respectively. While, the effect of drought on vessel diameter is more pronounced
vessel area in the second quarter was negatively correlated with if water shortage occurs early in the growing season rather
early summer temperatures. In addition, MVA in the last quarter later in the season. This suggests an increased sensitivity of
was positively and negatively correlated with mid-summer earlywood cells to drought conditions (Arend and Fromm,
precipitation and maximum temperature, respectively. A positive 2007; Cabon et al., 2020). However, we found that vessel features
correlation between late summer precipitations on vessels formed (area and distribution) in beech at the selected sites were
at the end of the growing season was also reported by Sass affected by drought conditions between June and August. In
and Eckstein (1995). The results suggest the intra-annual variability dry years, the trend of vessel area already began to decrease
in vessels area could be used for reconstruction of climate in the first half of tree ring width, which could affect turgor,
conditions before and during the time they were formed (e.g., resulting in smaller vessels (Popkova et al., 2018; Cabon et al.,
Castagneri et al., 2017). In order to better understand how 2020). This was particularly evident in the exceptionally dry
short-term climate conditions during the growing season affect year 2003, when an almost semi-ring porous distribution of
vessel formation, the findings should be verified with studies vessels was observed (Supplementary Figure S3B) in some
on intra-annual xylem formation (e.g., Prislan et al., 2018). tree rings at IDR (Bosshard, 1982; Schweingruber, 2007). In
Furthermore, the influence of intra-seasonal climate variability wetter and average years, on the other hand, an abrupt decrease
on other vessel features (e.g., vessel grouping or potential hydraulic in vessel area is observed in the fourth quarter of the annual
conductivity) may also be evaluated (Schuldt et al., 2016). ring (Figure 7; Supplementary Figure S3A).
Beech Tree Ring Features Under Climate
Change (Extreme Weather Conditions) CONCLUSION
In the past six decades, the average annual temperature has
increased by 0.36°C, and the amount of precipitation has decreased This study has shown that the emerging field of quantitative
by 3% per decade in central Europe (de Luis et al., 2014; Vertačnik wood anatomy complements both dendroecological studies and
et al., 2018). Slovenia belongs to a transitional region, which is climate change research (Buttò et al., 2020; Piermattei et al.,
affected by both, Mediterranean and temperate climate regimes 2020). For example, vessel area and distribution, in addition to
(Koffi and Koffi, 2008). Thus, based on different future climate annual tree ring width, provide a better understanding of how
scenarios further increases in temperature, changes in precipitation changes in growing conditions affect not only radial growth,
patterns and increased frequency of extreme weather events are but also wood anatomy and its properties. Our results show
expected which could result in changing climate and growth differences in relationships between climate and tree ring features
conditions (Dolschak et al., 2019). Several dendroclimatological (e.g., TRW, VD, RCTA, and MVA) at the selected sites. We can
studies have suggested that increasing temperature will positively conclude that beech trees with different leaf phenologies respond
affect radial growth at typical beech forest sites (Dulamsuren differently to changes of climatic condition, whereby early flushing
et al., 2016; Martinez del Castillo et al., 2018; Vospernik and beech sites are affected by similar climate drivers, while beech
Nothdurft, 2018; Prislan et al., 2019). However, these studies did characterized as late flushing seems to be less sensitive to climatic
not generally take into account the overall impact of extreme changes. Although wood anatomical traits, such as vessel diameter
weather events on tree growth and possible changes in beech and frequency, are easily accessible ecological or climatological
Frontiers in Plant Science | www.frontiersin.org 13 July 2021 | Volume 12 | Article 669229Arnič et al. Climate-Growth Interactions in Beech
proxies for analyzing adaptation processes to environmental image analyzing in Roxas and Image-Pro Plus. DA, JJ, and
changes (Campelo et al., 2010; Crous et al., 2012), more detailed PP analyzed and interpreted the data. All authors contributed
knowledge is needed on how much of the variability in these to the article and approved the submitted version.
traits is environmentally driven (Leal et al., 2003; Fisher et al.,
2007; Tixier et al., 2013). In order to better understand the
response of beech with different leaf phenology and growth FUNDING
strategy, additional sites from elevational transect and variable
soil and stand properties, as well as ecophysiological measurements This work was supported by the Slovenian Research Agency,
should be included in future analyses. the young researchers’ program (DA), program P4-0107, and
projects Z4-7318 and J4-2541.
DATA AVAILABILITY STATEMENT
ACKNOWLEDGMENTS
The raw data supporting the conclusions of this article will
be made available by the authors, without undue reservation. The authors gratefully acknowledge Robert Krajnc for his help
in the field and Tatjana Rajniš and Gregor Skoberne for their
help in the laboratory.
AUTHOR CONTRIBUTIONS
PP, JJ, JG, and DA planned and designed the research. PP SUPPLEMENTARY MATERIAL
and GB performed the sampling. DA and PP contributed to
the sample preparation and capturing of high resolution images The Supplementary Material for this article can be found online
with light microscope and wrote the manuscript with at: https://www.frontiersin.org/articles/10.3389/fpls.2021.669229/
contributions from all co-authors. DA and GA contributed to full#supplementary-material
Brus, R. (2010). Growing evidence for the existence of glacial refugia of European
REFERENCES beech (Fagus sylvatica L.) in the South-Eastern Alps and north-western
Dinaric Alps. Period. Biol. 112, 239–246.
Abrantes, J., Campelo, F., García-González, I., and Nabais, C. (2012). Environmental
Bunn, A. G. (2008). A dendrochronology program library in R (dplR).
control of vessel traits in Quercus ilex under Mediterranean climate: relating
Dendrochronologia 26, 115–124. doi: 10.1016/j.dendro.2008.01.002
xylem anatomy to function. Trees 27, 655–662. doi: 10.1007/s00468-012-0820-6
Aloni, R. (2007). “Phytohormonal mechanisms that control wood quality formation Buttò, V., Shishov, V., Tychkov, I., Popkova, M., He, M., Rossi, S., et al. (2020).
in young and mature trees” in The Compromised Wood Workshop. eds. K. Entwistle, Comparing the cell dynamics of tree-ring formation observed in microcores
P. Harris and J. Walker; January 29–30, 2007 (Christchurch, New Zealand: The and as predicted by the Vaganov–Shashkin model. Front. Plant Sci. 11:1268.
Wood Technology Research Centre, University of Canterbury), 1–22. doi: 10.3389/fpls.2020.01268
Anfodillo, T., Deslauriers, A., Menardi, R., Tedoldi, L., Petit, G., and Rossi, S. Cabon, A., Fernandez-de-Una, L., Gea-Izquierdo, G., Meinzer, F. C.,
(2012). Widening of xylem conduits in a conifer tree depends on the longer Woodruff, D. R., Martinez-Vilalta, J., et al. (2020). Water potential control
time of cell expansion downwards along the stem. J. Exp. Bot. 63, 837–845. of turgor-driven tracheid enlargement in scots pine at its xeric distribution
doi: 10.1093/jxb/err309 edge. New Phytol. 225, 209–221. doi: 10.1111/nph.16146
Arend, M., and Fromm, J. (2007). Seasonal change in the drought response Campelo, F., Nabais, C., Gutiérrez, E., Freitas, H., and García-González, I.
of wood cell development in poplar. Tree Physiol. 27, 985–992. doi: 10.1093/ (2010). Vessel features of Quercus ilex L. growing under Mediterranean
treephys/27.7.985 climate have a better climatic signal than tree-ring width. Trees 24, 463–470.
Bakalowicz, M. (2015). Karst and karst groundwater resources in the Mediterranean. doi: 10.1007/s00468-010-0414-0
Environ. Earth Sci. 74, 5–14. doi: 10.1007/s12665-015-4239-4 Carrer, M., Brunetti, M., and Castagneri, D. (2016). The imprint of extreme
Barbaroux, C., and Bréda, N. (2002). Contrasting distribution and seasonal climate events in century-long time series of wood anatomical traits in
dynamics of carbohydrate reserves in stem wood of adult ring-porous sessile high-elevation conifers. Front. Plant Sci. 7:683. doi: 10.3389/fpls.2016.
oak and diffuse-porous beech trees. Tree Physiol. 22, 1201–1210. doi: 10.1093/ 00683
treephys/22.17.1201 Carrer, M., von Arx, G., Castagneri, D., and Petit, G. (2015). Distilling allometric
Barbaroux, C., Bréda, N., and Dufrêne, E. (2003). Distribution of above-ground and environmental information from time series of conduit size: the
and below-ground carbohydrate reserves in adult trees of two contrasting standardization issue and its relationship to tree hydraulic architecture. Tree
broad-leaved species (Quercus petraea and Fagus sylvatica). New Phytol. Physiol. 35, 27–33. doi: 10.1093/treephys/tpu108
157, 605–615. doi: 10.1046/j.1469-8137.2003.00681.x Castagneri, D., Fonti, P., von Arx, G., and Carrer, M. (2017). How does climate
Bogdziewicz, M., Hacket-Pain, A., Kelly, D., Thomas, P. A., Lageard, J., and influence xylem morphogenesis over the growing season? Insights from
Tanentzap, A. J. (2021). Climate warming causes mast seeding to break long-term intra-ring anatomy in Picea abies. Ann. Bot. 119, 1011–1020. doi:
down by reducing sensitivity to weather cues. Glob. Chang. Biol. 27, 1952–1961. 10.1093/aob/mcw274
doi: 10.1111/gcb.15560 Chave, J., Coomes, D., Jansen, S., Lewis, S. L., Swenson, N. G., and Zanne, A. E.
Bolte, A., Czajkowski, T., and Kompa, T. (2007). The north-eastern distribution (2009). Towards a worldwide wood economics spectrum. Ecol. Lett. 12,
range of European beech: a review. Forestry 80, 413–429. doi: 10.1093/ 351–366. doi: 10.1111/j.1461-0248.2009.01285.x
forestry/cpm028 Cook, E. R., and Kairiukstis, L. A. (1990). Methods of Dendrochronology:
Bosshard, H. H. (1982). Holzkunde: Band 1 Mikroskopie und Makroskopie des Applications in the Environmental Sciences. Netherlands: Springer.
Holzes. Basel: Birkhäuser Basel. Cornes, R. C., van der Schrier, G., van den Besselaar, E. J. M., and Jones, P. D.
Bräuning, A., De Ridder, M., Zafirov, N., García-González, I., Petrov Dimitrov, D., (2018). An ensemble version of the E-OBS temperature and precipitation
and Gärtner, H. (2016). Tree-ring features: indicators of extreme event data sets. J. Geophys. Res. Atmos. 123, 9391–9409. doi: 10.1029/2017jd0
impacts. IAWA J. 37, 206–231. doi: 10.1163/22941932-20160131 28200
Frontiers in Plant Science | www.frontiersin.org 14 July 2021 | Volume 12 | Article 669229You can also read