Drastic decline of flood pulse in the Cambodian floodplains (Mekong River and Tonle Sap system)
←
→
Page content transcription
If your browser does not render page correctly, please read the page content below
Hydrol. Earth Syst. Sci., 26, 609–625, 2022
https://doi.org/10.5194/hess-26-609-2022
© Author(s) 2022. This work is distributed under
the Creative Commons Attribution 4.0 License.

Drastic decline of flood pulse in the Cambodian floodplains (Mekong
River and Tonle Sap system)
Samuel De Xun Chua1 , Xi Xi Lu1 , Chantha Oeurng2 , Ty Sok2,3 , and Carl Grundy-Warr1
1 Department  of Geography, National University of Singapore, 10 Kent Ridge Crescent, 119260, Singapore
2 Facultyof Hydrology and Water Resources Engineering, Institute of Technology of Cambodia, Russian Federation Blvd.,
P.O. Box 86, Phnom Penh, Cambodia
3 Laboratoire Ecologie fonctionnelle et environnement, Université de Toulouse, CNRS, Toulouse INP,

Université Toulouse 3 – Paul Sabatier (UT3), Toulouse, France

Correspondence: Lu Xi Xi (geoluxx@nus.edu.sg)

Received: 17 July 2021 – Discussion started: 21 July 2021
Revised: 19 December 2021 – Accepted: 4 January 2022 – Published: 7 February 2022

Abstract. The Cambodian floodplains experience a yearly            1   Introduction
flood pulse that is essential to sustain fisheries and the agri-
cultural calendar. Sixty years of data, from 1960–2019, are
used to track the changes to the flood pulse there. We find        The Mekong River in Southeast Asia has attracted much at-
that minimum water levels over 2010–2019 increased by up           tention as water infrastructure development has accelerated
to 1.55 m at Kratie and maximum water levels decreased by          in the past years (Best, 2019; Soukhaphon et al., 2021). Due
up to 0.79 m at Prek Kdam when compared to 1960–1991               to its transboundary nature, the cross-border hydrological
levels, causing a reduction of the annual flood extent. Con-       impacts of anthropogenic alterations have become a con-
currently, the duration of the flooding season has decreased       tentious topic (Stone, 2010). For instance, Keovilignavong
by about 26 d (Kampong Cham) and 40 d (Chaktomuk), with            et al. (2021) described how the recent 2019–2020 Mekong
the season starting later and ending much earlier. Along the       drought was politicised by states and agencies.
Tonle Sap River, the average annual reverse flow from the             The Cambodian floodplains and the Tonle Sap Lake sys-
Mekong to the Tonle Sap Lake has decreased by 56.5 %, from         tem is home to a unique geographical phenomenon. During
48.7 km3 in 1962–1972 to 31.7 km3 in 2010–2018. As a re-           the dry season, the lake empties into the Mekong. However,
sult, wet-season water levels at Tonle Sap Lake dropped by         during the wet season, large tracts of the floodplains are in-
1.05 m in 2010–2019 compared to 1996–2009, correspond-             undated, and flow is reversed from the Mekong to the lake.
ing to a 20.6 % shrinkage of the lake area. We found that up-      This annual flood pattern is critical for both the productivity
stream contributors such as current hydropower dams cannot         of fisheries (Halls and Hortle, 2021; Sabo et al., 2017; Ziv
fully account for the observed decline in flood pulse. Instead,    et al., 2012) and the agrarian communities that are reliant
local anthropogenic causes such as irrigation and channel in-      upon the annual floodwaters for replenishment of nutrients
cision are important drivers. We estimate that water with-         and water (Arias et al., 2012; Grundy-Warr and Lin, 2020).
drawal in the Cambodian floodplains is occurring at a rate            Due to the significance of the annual floods, the ecolog-
of (2.1 ± 0.3) km3 yr−1 . Sediment decline and ongoing sand-       ical and hydrological services provided by the Cambodian
mining operations have also caused channel erosion. As the         floodplains is best understood as a consequence of the flood
flood pulse is essential for the ecological habitats, fisheries    pulse (Junk et al., 1989). Elsewhere, hydrological alterations
and livelihoods of the region, its reduction will have major       to flood pulses have been quantified in the Amazon Basin
implications throughout the basin, from the Tonle Sap sys-         (Zulkafli et al., 2016) and Missouri Basin (Bovee and Scott,
tem to the Vietnamese Mekong Delta downstream.                     2002). Within other parts of the Mekong, the flood pulse has
                                                                   been investigated vis-à-vis its relationships to climate (Räsä-
                                                                   nen and Kummu, 2013; Västilä et al., 2010) and ecosystems

Published by Copernicus Publications on behalf of the European Geosciences Union.
610                                              S. D. X. Chua: Drastic decline of flood pulse in the Cambodian floodplains

(Arias et al., 2013; Kong et al., 2017; Ngor et al., 2018).       level exceeds 12 m at Kampong Cham, extensive overbank
These studies indicate that quantification of flood pulses can    flooding will occur on both banks of the Mekong (Inomata
be useful in the understanding of the hydrology of a flood-       and Fukami, 2008; Mekong River Commission et al., 2004).
plain system.                                                     Concurrently, along the Tonle Sap River, water flows from
   In the Cambodian floodplains, the water levels in the Tonle    the Mekong to the Tonle Sap Lake, bringing along its supply
Sap Lake and the Mekong mainstream have a close relation-         of sediment and nutrients (Campbell et al., 2009; Lu et al.,
ship (Guan and Zheng, 2021; Inomata and Fukami, 2008),            2014b; Siev et al., 2018). In this study, unless otherwise de-
meaning that any alterations to flows on the mainstream will      fined, “upstream” refers to stretches of the Mekong located
affect the hydrology of the lake. Studies of the Tonle Sap        above Stung Treng.
Lake have predicted that dry-season water levels will in-            We identify three main anthropogenic factors that can
crease and wet-season water levels will decrease (Arias et        cause changes to the yearly flood pulse: upstream dam con-
al., 2012; Kummu and Sarkkula, 2008). Indeed, remotely            struction, irrigation and sand mining. In the Upper Mekong
sensed data has confirmed that the surface area of the lake       Basin (UMB), the Lancang cascade, consisting of 11 dams
has shown a declining trend since 2000 (Ji et al., 2018; Lin      over an 800 m drop, was built by China beginning with Man-
and Qi, 2017)                                                     wan Dam in 1992 (Hecht et al., 2019). These dams have
   Overall, the Cambodian floodplains can protect neighbour-      raised concerns due to their ability to alter the hydrologi-
ing Phnom Penh and the Vietnamese Mekong Delta (VMD)              cal regime downstream (Lu et al., 2014a). For example, the
downstream from floods by storing large volumes of water          two largest, Xiaowan and Nuozhadu, completed in 2010 and
during the wet season (Fujii et al., 2003; Mekong River Com-      2014 respectively, have a total reservoir capacity of 38.3 km3 ,
mission et al., 2004). In addition, the effects of upstream wa-   which is more than half of the total capacities of all reser-
ter infrastructure development, such as the Lancang dams,         voirs across the whole Mekong Basin (Mekong Region Fu-
on the VMD are also dampened by the buffering effect of           tures Institute, 2020). The cascade has been found to in-
the floodplains (Dang et al., 2015). However, despite its im-     crease dry-season discharge and reduce wet-season discharge
portance, the hydrological changes experienced by the Cam-        downstream (Li et al., 2017; Räsänen et al., 2012) to as
bodian floodplains over the past decades have been poorly         far as Kratie (Räsänen et al., 2017). Nearer the Cambodian
understood.                                                       floodplains, tributary dams such as the Pak Mun Dam in the
   This study first aims to quantify the flood pulse along the    Chi-Mun system have also been shown to regulate down-
Cambodian floodplain using sixty years of data, from 1960–        stream Mekong flows (Cochrane et al., 2014). Dams in the
2019. Then, we want to identify the anthropogenic factors         3S (Sekong, Sesan, Srepok) river basin can also affect the
that have caused the alterations to the flood pulse. Through      flood pulse downstream by increasing minimum water levels
this approach, we offer novelty in two ways. First, we stud-      (Arias et al., 2014) or by decreasing wet-season discharge
ied the Cambodian floodplains in its entirety, as compared        (Piman et al., 2013a).
to other authors who only investigated the Tonle Sap sys-            In recent years, the Cambodian floodplains have been de-
tem (Chen et al., 2021; Kummu and Sarkkula, 2008) or the          veloped to tap into their potential for rice production (Er-
Mekong system (Binh et al., 2020b). Second, we synthesised        ban and Gorelick, 2016; Yu and Fan, 2011). Under the
knowledge of the various anthropogenic drivers in the Cam-        “Rice-White Gold” policy of the Cambodian government,
bodian floodplains and associated them with observed hydro-       the country fulfilled its objective to increase rice yield to
geomorphological impacts. In so doing, we present the impli-      4 million tonnes in 2015 from just 20 000 tonnes in 2009
cations of current human activities on the Cambodian flood-       (Royal Government of Cambodia, 2010). The boom in rice
plains and the wider region.                                      production was possible with both the use of high-yielding
                                                                  rice varieties and an expansion of irrigation infrastructure
                                                                  that allowed dry-season cropping (Asian Development Bank,
2   Study area                                                    2019b). With investments from international donors such as
                                                                  the World Bank and the Asian Development Bank (ADB)
Beginning from Stung Treng, the lower reaches of the              and countries such as Japan and China, Cambodia has both
Mekong winds through a large floodplain that is seasonally        upgraded its ageing irrigation schemes and constructed new
inundated during the wet season (Fig. 1b). Connected to the       canals and reservoirs (Sithirith, 2017; Table S1 in Supple-
floodplain is the Tonle Sap system, which expands from an         ment). However, this water infrastructure consumes large
area of 2500 km2 during the dry season to up to 15 000km 2        volumes of water – Erban and Gorelick (2016) estimate that
during the wet season (Ji et al., 2018). The whole flood-         full dry-season irrigation could use up to 31 % of the total
plain is underlain by a mosaic of tropical ecosystems such as     Mekong and Bassac flow.
gallery forest, shrublands and aquatic herbaceous vegetation         Another anthropogenic activity that has increased pace
(Araki et al., 2007; Arias et al., 2013; Kummu and Sarkkula,      is sand mining within the river channels (Kondolf et al.,
2008), and man-made land use such as rice fields and canals       2018; Schmitt et al., 2017). In Cambodia alone, it was es-
(Mahood et al., 2020; Olson and Morton, 2018). When water         timated that at least 34.4 million cubic metres of sediment

Hydrol. Earth Syst. Sci., 26, 609–625, 2022                                         https://doi.org/10.5194/hess-26-609-2022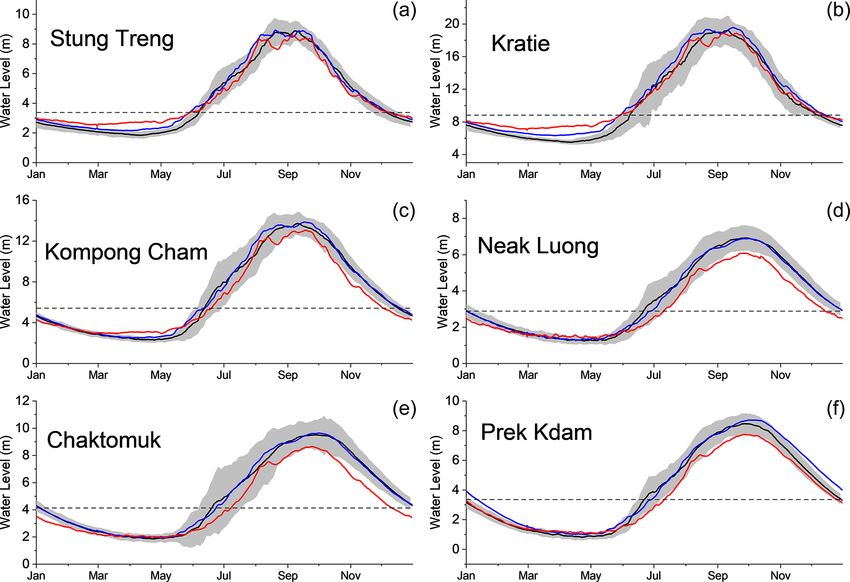
S. D. X. Chua: Drastic decline of flood pulse in the Cambodian floodplains                                                         611

Figure 1. (a) Map of the Mekong Basin showing sites of major mainstream water infrastructure as of 2019. (b) Map of the Cambodian flood-
plains, beginning from Stung Treng to the Vietnamese border. The floodplains also include the Tonle Sap Lake. (c) Map of the Chaktomuk
confluence between the Mekong mainstream, Tonle Sap River and Bassac River. Possible irrigation canals are also shown. The canals in
grey are extracted from OpenStreetMap. © OpenStreetMap contributors 2022. Distributed under the Open Data Commons Open Database
License (ODbL) v1.0.

https://doi.org/10.5194/hess-26-609-2022                                               Hydrol. Earth Syst. Sci., 26, 609–625, 2022
612                                              S. D. X. Chua: Drastic decline of flood pulse in the Cambodian floodplains

were mined per year (Bravard et al., 2013). Of this amount,       Chaktomuk (CK) : QCK = (13.943HCK + 19.992)1.8
18.1 million cubic metres was mined within the short stretch       (R 2 >0.999)                                              (3)
of the Mekong from Kampong Cham to the Vietnamese bor-
der (Bravard et al., 2013). As large volumes of sediment are      Here, Q is discharge and H is water levels. HCC refers to
being removed from the river bed, sediment contributions          water level at Chroy Changvar.
from the Upper Mekong are unable to replenish these losses           The high R 2 scores indicate high accuracy of the pre-
(Hackney et al., 2020). The problem is so severe in the neigh-    dicted discharge values and thus justify their use for further
bouring VMD that sand mining has resulted in an up to 1.3 m       analysis. Additionally, we identified an unreported change in
decrease in water levels, exacerbating the impacts of sea-        the rating curve at Stung Treng. The new curve was imple-
level rise and saltwater intrusion (Brunier et al., 2014; Vu      mented on 1 January 2005 and depressed discharge values af-
et al., 2018). On the Cambodian side, Hackney et al. (2021)       terwards, making them unsuitable for comparison with prior
estimate that sand mining has caused riverbed incision at a       data (Lu and Chua, 2021). Therefore, post-2004 discharge
rate of −0.26 m yr−1 from 2013 to 2019 with no signs of           data must be calibrated with the previous rating curve. The
abatement. Consequently, Ng and Park (2021) conjectured           previous rating curve was obtained by plotting discharge and
that this incision is causing the Tonle Sap Lake to shrink.       water level data from 2000–2004 and then seeking the best fit
                                                                  line with the smallest RMS error. The resulting polynomial
                                                                  relation (Eq. 4) achieved high accuracy with R 2 > 0.999:
3     Materials and methods
                                                                  Stung Treng (ST) : QST = 207.549HST 2 + 2598.316HST
3.1    Data
                                                                   − 4854.477(R 2 >0.999).                                   (4)
Water level and discharge data were obtained from the
                                                                  3.2   Methodology
Mekong River Commission (Mekong River Commission,
2021). On the Mekong mainstream, we obtained data from            Figure 2 offers a timeline of major anthropogenic processes
Stung Treng, Kratie, Kampong Cham, Chroy Changvar and             occurring in the Mekong Basin from 1960 to 2020. There
Neak Luong. We also obtained data from Prek Kdam (Tonle           are three distinct phases of water infrastructure development:
Sap River), Chaktomuk (Bassac River) and Kampong Lu-              1960–1991, 1992–2009 and 2010–2019. 1960–1991 consti-
ang (within Tonle Sap Lake). These stations were selected         tutes the pre-dam era and can be treated as the historical
due to their good coverage of the Cambodian floodplains and       baseline before any major water infrastructure development.
documentation of their historical records from 1960 onwards       Following the construction of the first dam on the Mekong
(Table 1).                                                        mainstream – the Manwan Dam – the growth era, from 1992
   However, there are some gaps in the digital data down-         to 2009, saw extensive hydropower development both on the
loaded from the MRC data portal. For these gaps, we con-          Mekong mainstream and its tributaries upstream in China,
sulted physical data records at the MRC office and Ministry       Thailand and Laos. For example, during this period, China
of Water Resources and Meteorology, Cambodia. While most          constructed the Manwan, Dachaoshan and Jinghong dams
of these missing entries were found and filled, there are still   in the Upper Mekong Basin, with a total storage capacity
some years without documentation despite our best efforts         of no less than 2.95 km3 (Mekong Region Futures Insti-
(Fig. S1 in the Supplement). Precipitation data were also ob-     tute, 2020). Within Cambodia, irrigation infrastructure was
tained from the MRC for Kampong Cham and Chaktomuk.               still small scale and sand mining was only on the scale of
   At Kampong Cham, Neak Luong and Chaktomuk, missing             13.5 Mt yr−1 (United Nations, 2017). However, after 2010,
discharge data from 2012–2019 were calibrated from their          the pace of dam construction increased with the operational-
corresponding water levels using the rating curves derived        isation of mega-dams in China such as the Xiaowan and
by the Mekong River Commission et al. (2004; Eqs. 1 to 3).        Nuozhadu dams, with a combined storage capacity of up
To test the validity of these curves, they were used to gen-      to 38.3km3 , thereby marking the start of the mega-dam era
erate predictions of daily discharge values from 2003–2011.       (MRFI, 2020). Concurrently, the Cambodian government an-
The predictions were then compared with actual discharge          nounced the “Rice-White Gold” policy paper in 2010, spark-
readings measured during the same period to obtain their re-      ing a burst of intensive irrigation projects in the Cambodian
spective R 2 score. The plots of actual and predicted values      floodplain (Asian Development Bank, 2019a; Royal Govern-
are available in Fig. S2 in Supplement.                           ment of Cambodia, 2010). By 2019, the pace of sand mining
                                                                  increased to almost 50.2 Mt yr−1 (Hackney et al., 2021), al-
Kampong Cham (KC) : QKC = (8.869HKC + 29.811)2                    most 4 times its 2009 rate.
 (HKC − HCC )0.3 + 2412.182(R 2 = 0.998)                   (1)       This division of our study period into the three eras allows
                                                    2             us to view any hydrological changes within the context of
Neak Luong (NL) : QNL = (12.718HNL + 62.250)
                                                                  wider basin developments in the Mekong. Furthermore, this
 (HCC − HNL )0.2 (R 2 = 0.993)                             (2)    division is consistent with other studies in the region (Binh

Hydrol. Earth Syst. Sci., 26, 609–625, 2022                                         https://doi.org/10.5194/hess-26-609-2022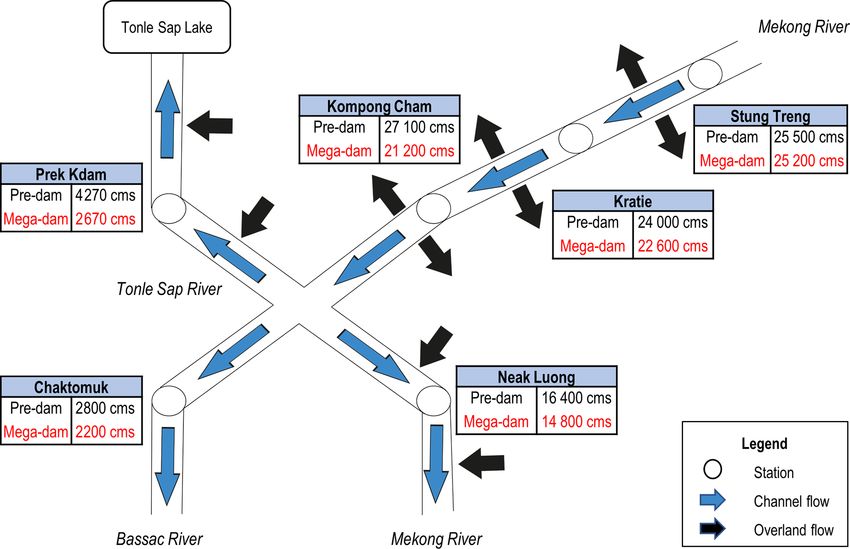
S. D. X. Chua: Drastic decline of flood pulse in the Cambodian floodplains 613
Table 1. Summary of obtained data records from the various stations.
Actual Data Computed Discharge Data
Water Level Discharge
Mekong mainstream Stung Treng 1960–2019 1960–2019 2005–2019 Calibrated to 2000–2004 rating curve
because new rating curve depressed dis-
charge values from 2005 onwards
Kratie 1960–2019 1960–1969
1980–2019
Kampong Cham 1960–2019 1960–2011 2012–2019 Used the rating curve from the Mekong
River Commission et al. (2004) to esti-
mate discharge for missing years
Chroy Changvar 2000–2019
Neak Luong 1960–2019 1960–2011 2012–2019 Used the rating curve from the Mekong
River Commission et al. (2004) to esti-
mate discharge for missing years
Tonle Sap River Prek Kdam 1960–2019 1962–1972
1995–2018
Bassac River Chaktomuk 1960–2019 1960–2011 2012–2019 Used the rating curve from the Mekong
River Commission et al. (2004) to esti-
mate discharge for missing years
Tonle Sap Lake Kampong Luang 1996–2019
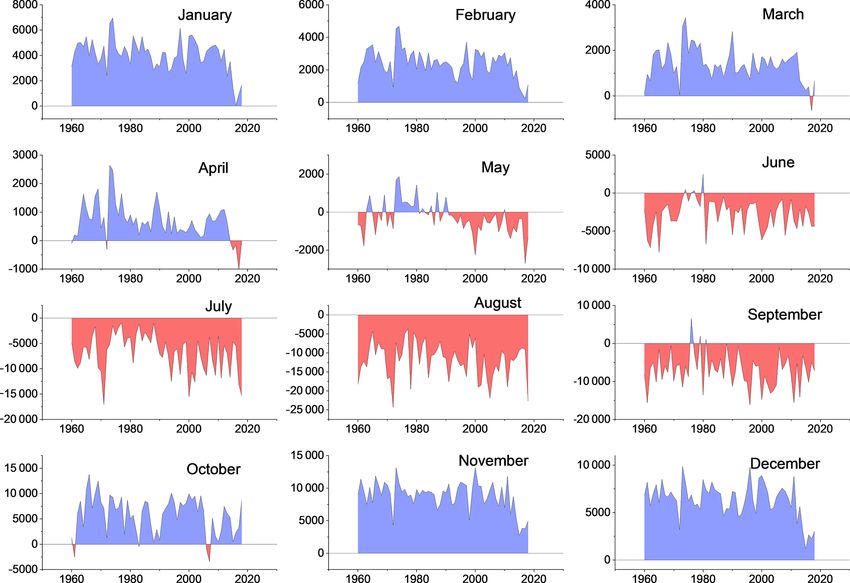
Figure 2. Timeline of major water infrastructure activities in the Cambodian floodplains and the wider Mekong Basin. Blue labels indicate
mainstream dams constructed across the Mekong (including the Lancang Cascade). Black labels indicate irrigation projects within Cambodia.
The red chart represent the estimated rate sand mined per year in millions of tonnes (Mt). Mining data from 1998–2015 were obtained from
the United Nations (2017), while mining data from 2016–2020 were obtained from Hackney et al. (2021).
https://doi.org/10.5194/hess-26-609-2022 Hydrol. Earth Syst. Sci., 26, 609–625, 2022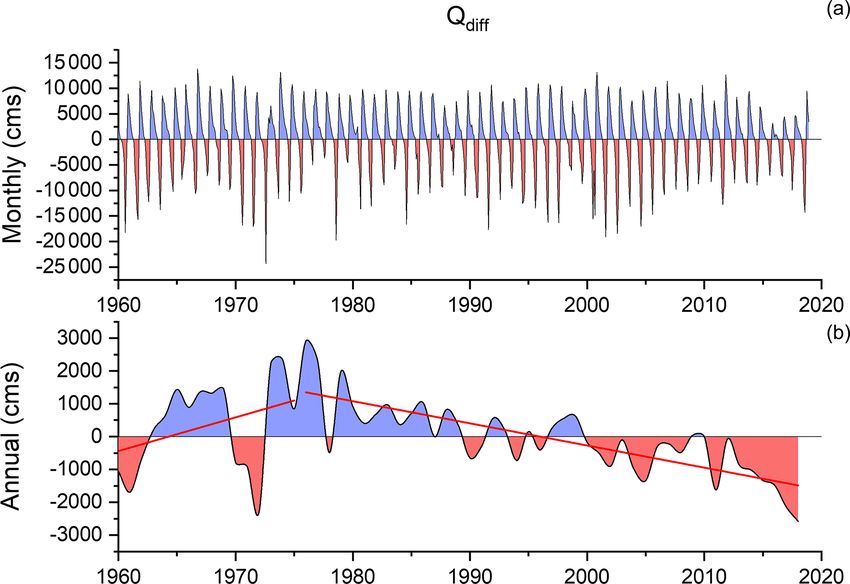
614                                                 S. D. X. Chua: Drastic decline of flood pulse in the Cambodian floodplains

                                                                      THRESHOLD (FT) (m) = 50th percentile of all water
                                                                       levels in study period                                    (8)
                                                                      START DATE = Date when water level > FT AND
                                                                       remain more than FT for next 10 d                         (9)
                                                                      END DATE = Date when water level < FT AND
                                                                       remain less than FT for next 10 d                        (10)
                                                                      DURATION (d) = Days between START DATE
                                                                       and END DATE                                             (11)
                                                                      PEAK DATE = Date of MAXannual                             (12)
                                                                                              MAXannual − FT
                                                                      RISE RATE (m d−1 ) =                                      (13)
                                                                                           Days from START DATE
                                                                                               to PEAK DATE
                                                                                    −1        MAXannual − FT
                                                                      FALL RATE (m d ) =                                        (14)
                                                                                           Days from PEAK DATE
                                                                                                to END DATE
                                                                         Comparisons of the means of numerical variables such
                                                                      as AMPLITUDE, RISE RATE and FALL RATE were con-
                                                                      ducted with Welch’s t test. For comparison of dates, the date
                                                                      was first converted to its Julian date. Thereafter, the median
                                                                      date of each study period was compared and validated with a
                                                                      Mann–Whitney test.

                                                                      3.2.2   Reverse flow at Prek Kdam

                                                                      The parameters used to characterise reverse flow (RF) where
                                                                      water flows from the Mekong to Tonle Sap Lake are stated in
                                                                      Eqs. (15) and (16):
                                                                                            X
                                                                      ANNUALRF (km3 ) =         RF in a year                 (15)
Figure 3. (a) Schematic of flood pulse variables in virtual annual    MAXRF (cms) = highest RF of a year                        (16)
water level plot in the Cambodian floodplains. (b) Schematic of the
various phases at Prek Kdam observed through a typical annual dis-       Three phases of the flow pattern are observed: normal
charge plot. Negative discharge values indicate reverse flow from     phase, transition phase and reverse phase (Fig. 3b). The nor-
the Mekong to the Tonle Sap Lake.                                     mal phase is when water flows from the Tonle Sap towards
                                                                      the Mekong. The transition phase begins on the date when
                                                                      the river record water flowing in the reverse direction for the
et al., 2020b; Guan and Zheng, 2021; Li et al., 2017; Räsä-           first time in the year. The reversal phase starts when water
nen et al., 2017), allowing for the cross-comparison of re-           continues to flow towards the lake and does not switch di-
sults. However, due to missing data years at some stations,           rection until the water abruptly changes back to the normal
the study duration might not be consistent. Nevertheless, our         phase flow. Note: not all years have a transition phase.
analysis still reflects the general trend and central tendency
across the different timeframes because only average values           3.2.3   Discharge changes
were compared.
                                                                      At each station, the mean discharge (in cubic metres per sec-
                                                                      ond) from June to September was computed. By comparing
3.2.1   Flood pulse                                                   average values during the pre-dam and mega-dam eras, the
                                                                      change in flood pulse across the entire Cambodian flood-
The various parameters used to characterise flood pulse as            plain can be visualised. Additionally, the difference in dis-
seen in Fig. 3a were determined from Eqs. (5) to (14) below.          charge (Qdiff ) between the downstream stations of Chakto-
                                                                      muk (CK) and Neak Luong (NL), and the upper station of
MINannual (m) = lowest water level of a year                   (5)    Stung Treng (ST), was calculated to estimate the amount of
MAXannual (m) = highest water level of a year                  (6)    water loss/gain in the Cambodian floodplains (Eq. 17).
AMPLITUDE (m) = MAXannual − MINannual                          (7)    Qdiff = (QCK + QNL ) − QST                                (17)

Hydrol. Earth Syst. Sci., 26, 609–625, 2022                                             https://doi.org/10.5194/hess-26-609-2022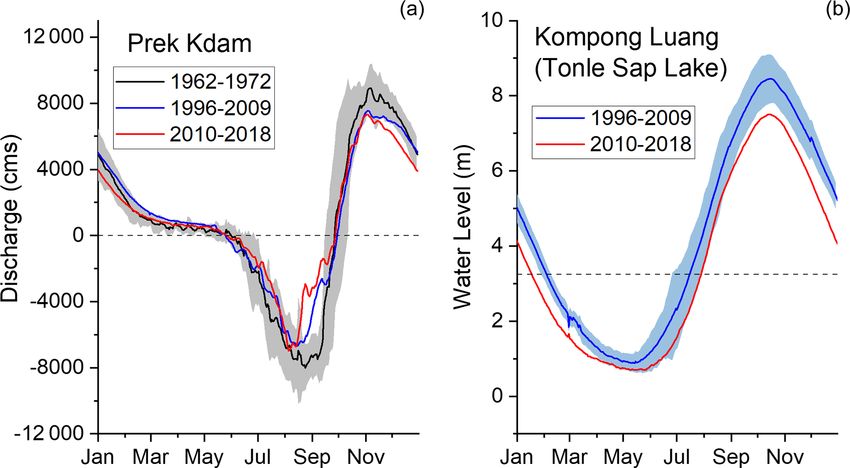
S. D. X. Chua: Drastic decline of flood pulse in the Cambodian floodplains                                                    615

   If Qdiff = 0, then it means that the amount of water enter-    delay in the start of the flooding season was observed to in-
ing the floodplain system is roughly equivalent to the amount     crease with further distance downstream. For instance, while
exiting. If Qdiff > 0, then it means that there is additional     the start date was only later by 9 d at Kampong Cham, it was
water going to the Cambodian floodplains from outside the         later by 11 d at Chaktomuk and 15 d at Neak Luong. For the
Mekong mainstream. This addition can come from precipita-         end dates of the flood season, it was earlier by 18 d at Kam-
tion or discharge from tributaries. Conversely, if Qdiff < 0,     pong Cham, 25 d at Chaktomuk and 18 d at Neak Luong.
then it means that water is lost to outside the Cambodian         Thus, for areas downstream of Kratie, the floodwaters have
floodplains through diversion or evapotranspiration.              indeed arrived later and receded earlier, resulting in a shorter
                                                                  wet season and a longer dry season.

4     Results                                                     4.1.3    Changes to rise and fall rates

4.1     Mekong River mainstream                                   Changes in rise/fall rates reflect influences of upstream wa-
                                                                  ter infrastructure. During the rising limb of the wet season,
4.1.1    Changes to annual flood extent                           reservoirs have to release the water stored during the dry
                                                                  season in preparation for the incoming water (Richter et al.,
The annual flood extent is given by the yearly maximum and        1997; Singer, 2007). Also, the presence of irrigation canals
minimum water levels of the Mekong. Compared to the pre-          increases the conveyance speed of floodwaters across the
dam era from 1962–1991, minimum water level was higher            floodplains, resulting in an increased rise rate. After the wet
during the growth era from 1992–2009 (Fig. 4). The trend          season, upstream reservoirs and irrigated fields retain water
continued into the mega-dam era (2010–2019) with signifi-         (Cochrane et al., 2014). As flows to the main channel is re-
cant increases recorded at all stations except Chaktomuk (Ta-     duced, the fall rate is correspondingly higher.
ble S2 in the Supplement). For reference, the minimum wa-            At Kampong Cham, Chaktomuk and Neak Luong, both
ter levels were higher by 0.60 m at Stung Treng, 1.55 m at        rise and fall rates were observed to increase during the mega-
Kratie, 0.60 m at Kampong Cham and 0.10 m at Neak Lu-             dam era as compared to the pre-dam era. The largest change
ong.                                                              in rise rate was observed at Chaktomuk with a 53.8 % in-
   Furthermore, maximum water levels decreased at all sta-        crease, from 0.062 to 0.096 m d−1 . In terms of fall rates, the
tions downstream of Kratie during the mega-dam era as com-        largest percentage change was observed at Kampong Cham:
pared to the pre-dam era. For example, Neak Luong and             a 23.8 % increase, from 0.089 to 0.111 m d−1 . These ob-
Chaktomuk experienced 0.55 and 0.76 m drops respectively.         served alterations point at anthropogenic hydrological reg-
Correspondingly, the amplitude of the flood pulse decreased.      ulation in the region.
Comparing records from the mega-dam era to the pre-dam
era, the amplitude dropped by 7.9 % at Kratie, 5.6 % at Kam-      4.2     Tonle Sap system
pong Cham, 10.6 % at Neak Luong and 8.9 % at Chaktomuk.
This observed increase in dry-season minima and decrease          4.2.1    Changes to water exchange at Tonle Sap River
in wet-season maxima are consistent with studies in other
parts of the Mekong Basin (Binh et al., 2020b; Li et al., 2017;   At Prek Kdam (Fig. 4f), the hydrological changes mirrored
Räsänen et al., 2017), demonstrating that the impacts of wa-      those in the Mekong mainstream. Compared against pre-dam
ter infrastructure development are evident within the Cambo-      records, the mega-dam era saw minimum water levels in-
dian floodplains.                                                 creased significantly by 0.25 m and maximum water level
   In practical terms, more areas of the riverbanks are now       decreased by 0.79 m. This resulted in a significant 12.9 % re-
permanently inundated during the dry season. As the flood         duction in amplitude – from 8.27 to 7.20 m. Furthermore, the
amplitude decreases, the annual flood extent is reduced,          flood duration was shorter by around 20 d. The average start
meaning that some parts of the floodplains are no longer be-      date in the mega-dam era was 10 July, a significant 15 d delay
ing flooded during the wet season.                                from 25 June previously during the pre-dam era.
                                                                     The total annual outflow from the Tonle Sap Lake to
4.1.2    Changes to annual flood duration                         the Mekong decreased from 74.54 km3 in 1962–1972 to
                                                                  62.81 km3 in 2010–2019 (Fig. 5a and Table S3 in the Sup-
When compared against 1960–1991 records, the flood sea-           plement). Similarly, the reverse flow from the Mekong to the
sons in 1992–2009 did not show many significant changes.          Tonle Sap decreased from 49.67 km3 in the pre-dam era to
However, the mega-dam era showed greater alterations in           only 31.74 km3 in the mega-dam era – a drastic reduction
flood timing. Downstream from Kratie, flood duration de-          of 56.5 %. In addition, the duration of the reverse phase de-
creased significantly by 26 d at Kampong Cham, 36 d at Neak       creased by around 13 d, from 125 d in 1962–1972 to 112 d in
Luong and 40 d at Chaktomuk. The drastic shortening of the        2010–2019.
flood season by up to more than a month was caused by both
a delay in flood pulse and an early end to the flooding. The

https://doi.org/10.5194/hess-26-609-2022                                          Hydrol. Earth Syst. Sci., 26, 609–625, 2022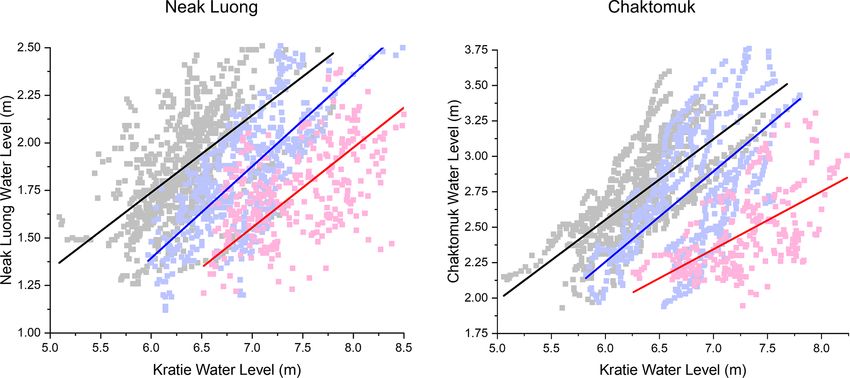
616                                               S. D. X. Chua: Drastic decline of flood pulse in the Cambodian floodplains

Figure 4. Variation of mean water levels at various stations within the Cambodian floodplains over time. Dotted horizontal line: flood
threshold; black curve: water levels from 1960–1991; blue curve: water levels from 1992–2009; red curve: water levels from 2010–2019.
Shaded region represents 1 standard error of mean water levels from 1960–1991.

                                                                     ume (V ) and area (A) as derived by Kummu et al. (2014;
                                                                     Eqs. 18 and 19),

                                                                     A = −5.5701H 3 + 137.40H 2 + 470.29H
                                                                        + 1680.2(R 2 >0.99)                                      (18)
                                                                                    2                           2
                                                                     V = 0.7307H − 0.3554H + 0.9127(R >0.99);                    (19)

                                                                     the 1.05 m drop in the maximum water level meant that
                                                                     3990 km2 of previously seasonally inundated land is now
                                                                     permanently dry. Correspondingly, the reduction in maxi-
                                                                     mum water volume is a drastic 12.1 km3 . This reduction
Figure 5. (a) Change in discharge at Prek Kdam over time. Shaded
region indicates standard error of mean discharge during 1962–       translates to a decrease in 20.6 % of maximum area and
1972. (b). Change in water level at Kampong Luang over time.         23.4 % of maximum water volume. During the dry season,
Shaded region indicates standard error of mean water level during    the minimum area is now 3.1 % smaller (2080 to 2010 km2 )
1996–2009.                                                           and contain 5.8 % less water (1.02 to 0.96 km3 ).
                                                                        This observed decrease in both the minimum and max-
                                                                     imum water levels is consistent with recent scholars who
4.2.2   Changes to Tonle Sap Lake flooding pattern                   monitored the change in Tonle Sap Lake area using remote
                                                                     sensing methods (Ji et al., 2018; Lin and Qi, 2017; Wang
At the Kampong Luang station in the Tonle Sap Lake, an-              et al., 2020). However, the observed decrease in dry-season
nual minimum water levels decreased from 0.70 m in 1996–             flow does not follow hydro-modelling results that suggest
2009 to 0.60 m in 2010–2019 (Fig. 5b and Table S4 in the             that the water level should be higher during the dry season
Supplement). Similarly, the yearly maximum water level               at the Tonle Sap Lake (Arias et al., 2012, 2014; Kummu and
dropped significantly from 8.58 m (1996–2009) to 7.52 m              Sarkkula, 2008; Piman et al., 2013b). We postulate that the
(2010–2019). Using the relation of water level (H ) to vol-          models adopted might not have considered the development

Hydrol. Earth Syst. Sci., 26, 609–625, 2022                                             https://doi.org/10.5194/hess-26-609-2022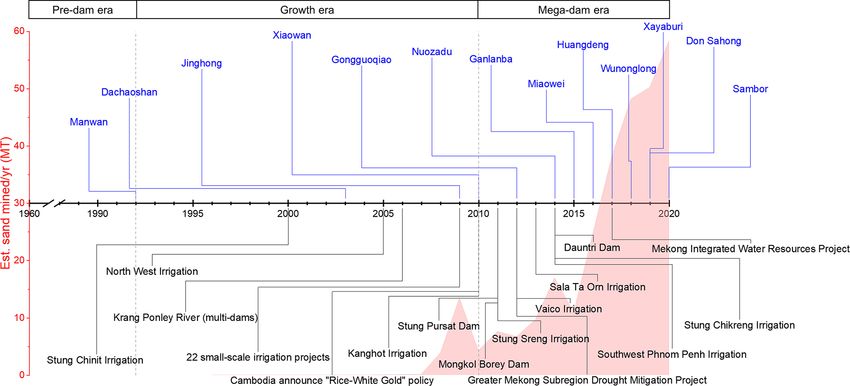
S. D. X. Chua: Drastic decline of flood pulse in the Cambodian floodplains                                                     617

of water infrastructure on Tonle Sap Lake tributaries (Asian       5     Discussion
Development Bank, 2019a).
   Additionally, there was a significant drop in flood duration,   5.1    Impacts of upstream dams and precipitation
from 198 to 163 d. This reduction was caused by an early end
to the flood season. During 1996–2009, the average end date        Section 4 has demonstrated that the flood pulse has indeed
of the flood season was 31 January but during 2010–2019            been decreasing across the Cambodian floodplains. However,
the season ended roughly on 18 January, earlier by 13 d. The       whether the reduction is caused by upstream dams, climate
shortened flooding season follows the same trend as in the         or local operations is hotly debated. For instance, the claim
Mekong mainstream.                                                 that Chinese dams have minimal impact on the inundation
                                                                   area of the Tonle Sap by Wang et al. (2020) was refuted in a
4.3   Changes to the flood pulse                                   response letter by Kallio and Kummu (2021). To investigate
                                                                   these competing drivers, we compared the reduction of wet-
Figure 6 shows a schematic of the annual flood pulse on the        season discharge across various stations.
Cambodian floodplains. During the pre-dam era of 1960–                Since Stung Treng, the uppermost station of the Cambo-
1991, the discharge at Stung Treng during the wet season           dian floodplains, only registered a reduction of 300 m3 s−1 ,
was 25 500 m3 s−1 . Downstream at Kratie, discharge reduced        then the cumulative contribution of infrastructure and pre-
slightly to 24 000 m3 s−1 , which could be caused by over-         cipitation in the upper reaches of the Mekong only accounted
land flooding between Stung Treng and Kratie. From Kratie          for 300 m3 s−1 of discharge. Propagating this 300 m3 s−1 de-
to Kampong Cham, as additional water arrived from the sur-         crease further, the percentage of discharge reduction caused
rounding watersheds, discharge increased to 27 100 m3 s−1 .        by upstream development versus that by local development
Thereafter, extensive overland flooding was experienced at         can be ascertained. Thus, only 21 % of reduction at Kratie
the Chaktomuk confluence of the Mekong, Bassac and Tonle           and 5 % of reduction at Kampong Cham could be attributed
Sap rivers. At Prek Kdam, 4270 m3 s−1 of water flowed              to the upper reaches (Table 2). Similarly, even though the
to the Tonle Sap Lake. At Chaktomuk and Neak Luong,                downstream stations of Prek Kdam, Neak Luong and Chak-
2800 m3 s−1 and 16 400 m3 s−1 of water continued to flow           tomuk also registered declines in discharge, only about 8 %
towards the Vietnamese Delta via the Bassac and Mekong             of the flow reduction at these three lower stations could be
rivers respectively.                                               attributed to development upstream. Furthermore, there were
   During the mega-dam era of 2010–2019, there were reduc-         no significant changes to either maximum flood levels or
tions in wet-season discharge across all stations. At Stung        flood duration at Stung Treng (Table S2 in the Supplement).
Treng, discharge only decreased by 300 m3 s−1 , a small               The changes in Qdiff further support the argument that lo-
1.2 % reduction. At Kratie and Kampong Cham, discharge             cal factors are more likely to be the main reason for the re-
decreased to 22 600 and 21 200 m3 s−1 , a larger percent-          duction of flood pulse. The only natural mechanism able to
age reduction of 5.8 % and 21.7 % respectively. All subse-         explain the reduction in Qdiff as shown in Sect. 4.3 is that
quent downstream stations also observed lower discharge.           overbank flooding has become more frequent, leading to an
Flow towards the Tonle Sap Lake at Prek Kdam dropped               increased loss of water through evapotranspiration. However,
from 37.5 % to 2670 m3 s−1 and discharge at Neak Luong             from the analysis of flood pulse in Sect. 4.1, we have identi-
and Chaktomuk decreased to 14 800 and 2200 m3 s−1 respec-          fied that both flooding extent and duration show a decreasing
tively.                                                            trend. Therefore, the only plausible mechanism for the drop
   As seen in Fig. 7, whether Qdiff is positive or negative de-    in Qdiff is local diversion of Mekong flows.
pends on the time of the year. In the dry months from October         Also, as observed in Fig. 9, measured rainfall in the
to April, Qdiff is generally positive, implying that there is a    Cambodian floodplains has remained roughly constant from
net contribution of water from the tributaries. Alternatively,     1960–2019, in line with observations via other sensing meth-
in the wet months from June to September, Qdiff is generally       ods (Raghavan et al., 2018; Singh and Qin, 2020; Thoeun,
negative as water is lost through the increased evapotranspi-      2015). This observation implies that local precipitation is not
ration from the flooding. This alternating gain-loss pattern is    the driving factor for the reduction in discharge. Thus, the ob-
elucidated in Fig. 8.                                              served reduction of flood discharge in the Cambodian flood-
   Figure 8b also showed two general trends in Qdiff across        plains cannot be attributed solely to either upstream devel-
time. During 1960–1975, Qdiff showed an increasing trend.          opment or natural climatic variability – local anthropogenic
However, from 1976–2019, Qdiff decreased significantly             factors are likely the main reason.
at a slope of −(68 ± 8) m3 s−1 yr−1 . This implied that the
Cambodian floodplains have been losing water at a rate of          5.2    Impacts of water withdrawal
(2.1 ± 0.3) km3 yr−1 .
                                                                   The scale of irrigation and construction of irrigation reser-
                                                                   voirs has been increasing since the Cambodian govern-
                                                                   ment announced its “Rice-White Gold” policy with numer-

https://doi.org/10.5194/hess-26-609-2022                                              Hydrol. Earth Syst. Sci., 26, 609–625, 2022
618 S. D. X. Chua: Drastic decline of flood pulse in the Cambodian floodplains Figure 6. Schematic of wet-season discharge on the Cambodian floodplains during the pre-dam and mega-dam era. Across all stations, there is a reduction of discharge during the mega-dam era of 2010–2019. Figure 7. Monthly plots of Qdiff (cms) from 1960–2019. Blue zones indicate Qdiff > 0, meaning an addition of water from outside the Cambodian floodplains. Red zones indicate Qdiff < 0, meaning a loss of water to outside the Cambodian floodplains. Generally, during the wet season from June to September, Qdiff < 0. Hydrol. Earth Syst. Sci., 26, 609–625, 2022 https://doi.org/10.5194/hess-26-609-2022
S. D. X. Chua: Drastic decline of flood pulse in the Cambodian floodplains                                                                  619

Table 2. Percentage contribution of influences upstream of Stung Treng to the reduction of discharge at the various stations in the Cambodian
floodplains.

                              Wet-season discharge   Total reduction     From upper    Contribution (%)   From Cambodian      Contribution (%)
                                     (cms)                    (cms)    reaches (cms)                      floodplains (cms)
                              Pre-dam    Mega-dam
  Stung Treng                   25 500      25 200            −300              −300               100
  Kratie                        24 000      22 600           −1400              −300                21              −1100                  79
  Kampong Cham                  27 100      21 200           −5900              −300                 5              −5600                  95
  Downstream (Prek Kdam +       23 470      19 670           −3800              −300                 8              −3500                  92
  Neak Luong + Chaktomuk)

                                                                          much lower than in neighbouring Thailand and Vietnam (Kea
                                                                          et al., 2016), meaning that Cambodia can still expand its rice
                                                                          production. As drought occurrences are likely to increase in
                                                                          the future (Oeurng et al., 2019), water availability will be the
                                                                          major challenge for the continued expansion of the Cambo-
                                                                          dian agriculture sector (Bresney et al., 2020; Sithirith, 2021).

                                                                          5.3    Impacts of channel incision

                                                                          There are two main drivers of channel incision: reduced sedi-
                                                                          ment flux and sand mining. Due to hydropower development
                                                                          in the Upper Mekong Basin, sediment flux has declined in
                                                                          the past decades (Bussi et al., 2021; Kondolf et al., 2014;
                                                                          Kummu et al., 2010; Lu et al., 2014b; Wang et al., 2011).
Figure 8. (a) Time series plot of Qdiff from 1960 to 2019 with            This sediment reduction results in the formation of “hungry
monthly steps. (b) Time series plot of Qdiff from 1960 to 2019            water” (Kondolf, 1997), which causes greater erosion of the
with yearly steps. From 1976–2019, Qdiff decreased at a slope of
                                                                          channels, leading to channel deepening (Kondolf et al., 2018;
−(68 ± 8) m3 s−1 yr−1 (p < 0.01).
                                                                          Lu et al., 2007). Concurrently, sand mining has increased
                                                                          pace within the last decade, with mining areas expanding the
                                                                          most rapidly within the Chaktomuk confluence area at Ph-
ous large projects. For instance, reservoirs have been con-               nom Penh (Hackney et al., 2021). Other areas identified as
structed along the tributaries feeding into Tonle Sap Lake.               mining hotspots include the stretch from Phnom Penn to the
Further downstream, projects such as the Vaico irrigation                 Vietnamese border along both the Mekong and Bassac chan-
project have seen canals constructed across the floodplains               nels (Bravard et al., 2013).
east of the Mekong. This infrastructure draws water from the                 Figure 10 shows the relationship between water levels dur-
Mekong, resulting in the observed decrease in Qdiff .                     ing February at Neak Luong and Chaktomuk, versus that
   As Fig. 7 shows, there has been a sharp and obvious de-                at Kratie. In the absence of man-made hydrological alter-
cline in Qdiff during November and December from 2010                     ations, the water levels at upstream Kratie will be tightly
onwards, coinciding with the start of the Cambodian “Rice-                coupled with those at downstream stations throughout the
White Gold” policy. This reduction follows the planting cal-              year. However, the water levels at Neak Luong and Chak-
endar of dry-season cropping from around December to April                tomuk have been decreasing with respect to water levels at
(Cramb et al., 2020). While the wet-season cropping is pri-               Kratie. In other words, for the same water level at Kratie,
marily rainfed and does not require much diversion of water,              the water level at Neak Luong/Chaktomuk has decreased
dry-season cropping must be extensively irrigated (Mekong                 from the 1960s to 2010s. During February, the changes in
River Commission, 2009). Consequently, farmers will store                 mean discharge at Neak Luong and Chaktomuk in the mega-
water during the preceding year’s wet season for the upcom-               dam era, as compared to that in the pre-dam era, is +8.3 %
ing second growing season (Phengphaengsy and Okudaira,                    and −23.3 % respectively – the lowest percentage change
2008).                                                                    among all months. Thus, changes in water level then have
   Although irrigation coverage has increased to approxi-                 a greater contribution from channel incision than from dis-
mately 22.6 % of paddy land by 2015, the percentage is still              charge change.

https://doi.org/10.5194/hess-26-609-2022                                                   Hydrol. Earth Syst. Sci., 26, 609–625, 2022
620 S. D. X. Chua: Drastic decline of flood pulse in the Cambodian floodplains
Figure 9. Mean 3-month rainfall at Kampong Cham and Chaktomuk from 1960–2019. There is no statistically significant trend in rainfall
within the data period (Mann–Kendall test: p = 0.8).
Figure 10. Comparison of water levels at Neak Luong/Chaktomuk against water levels at Kratie during February (black: 1960–1991; blue:
1992–2009; red: 2010–2019). Given the same water level at Kratie, the water levels at Neak Luong/Chaktomuk have been decreasing over
time.
The relationship given in Fig. 10 shows that incision at the 5.4 Wider environmental implications
downstream stations has occurred relatively faster than in-
cision at upstream Kratie. If incision were faster at Kratie, The Tonle Sap Lake has been decreasing in size throughout
then the y intercept of the best-fit lines would get progres- the years (Sect. 4.2.2; Kallio and Kummu, 2021; Wang et al.,
sively larger over time, which is not the case. Given a fixed 2020). A parallel can be drawn with Poyang Lake in Yangtze
water level of 7.0 m at Kratie, the water level at Neak Lu- River. There, the Three Gorges Dam has reduced the water
ong has dropped by about 0.60 m from the pre-dam to mega- level downstream. As the water level was reduced, the hy-
dam era. Similarly, at Chaktomuk, the water level dropped draulic gradient from Poyang Lake to the Yangtze increased,
by about 0.79 m. Actual measurements of water level reduc- resulting in a reduction of lake volume there (Zhang et al.,
tion due to sand mining are likely to be higher since the in- 2014, 2015).
cision at Kratie has not been factored in here. Thus, even In the case of the Tonle Sap Lake, there is a reduction
without decreases in discharge, channel incision would have of water levels in the Mekong mainstream during the wet
contributed to the reduction of water levels, leading to the ob- season. As expected from hydrological models (Inomata and
served decrease in flood pulse in the Cambodian floodplains. Fukami, 2008; Mekong River Commission et al., 2004), the
reduced hydraulic gradient from the water levels between the
Mekong and the lake leads to lesser water entering the lake
from the Mekong. During the pre-dam era, 74.54 km3 of wa-
ter emptied into the Mekong during the normal flow phase,
Hydrol. Earth Syst. Sci., 26, 609–625, 2022 https://doi.org/10.5194/hess-26-609-2022S. D. X. Chua: Drastic decline of flood pulse in the Cambodian floodplains 621
while 49.67 km3 of water entered the lake during the reverse caused by sand mining and other anthropogenic activities,
flow phase annually, meaning that there was a net outflow the stage–discharge relationship at several key stations such
of 24.87 km3 . In the mega-dam era, only 68.81 km3 of water as Neak Luong and Chaktomuk should be maintained more
flowed into the Mekong during the normal phase and reverse frequently. Otherwise, regular bathymetry surveys should be
flow decreased to 31.74 km3 ; net outflow from the lake to done to assess the rate of channel incision more accurately
the Mekong has increased to 31.07 km3 . When comparing in the area. Thirdly, given the complex hydrology in the
the difference in discharge towards the Mekong during the Cambodian floodplains, sensors should be installed along the
pre-dam and mega-dam era, we see that the average annual canals or at key intersections in the floodplains. This way,
outflow increased by 6.20 km3 . Without a corresponding in- overland flow – a poorly quantified variable – can be mon-
crease in inflows from either precipitation or lake tributaries, itored and subsequently be included within more complex
the lake will decrease in volume over time. Based on recon- hydrological models.
structed water level data of Guan and Zheng (2021), we esti-
mated the lake volume during 1960–1990 using the volume-
stage relation by Kummu et al. (2014). Indeed, compared to 6 Conclusion
the 1960–1990 values, the Tonle Sap Lake volume during
2010–2019 decreased by 35.9 km3 , in line with other studies By using 60 years of data from numerous stations across the
that observed a shrinking of the lake (Ji et al., 2018; Lin and floodplains, this study quantified that the flood pulse at the
Qi, 2017; Wang et al., 2020). Cambodian floodplains has indeed changed drastically in the
Downstream of the Cambodian floodplains, the VMD will past decade. Compared to 1962–1991 levels, minimum water
also be affected by the decreased flood pulse. While hy- levels in 2010–2019 increased by 0.10 m (Neak Luong) and
dropower dam operations can increase dry-season water lev- 1.55 m (Kratie). As a result, the flood amplitude decreased
els (Dang et al., 2016), the combined effects of local channel by 5.6 % (Kampong Cham) to 12.9 % (Prek Kdam), mean-
incision (Binh et al., 2020b) and irrigation operations will re- ing that the annual flood extent diminished. Furthermore, the
duce dry-season water. Since irrigation infrastructure in the flood season has decreased by 26 d (Kampong Cham) and
VMD is even more developed than that in Cambodia (Tran 40 d (Chaktomuk), with the flood season starting later and
and Weger, 2018), the impacts of dry-season extraction is ending much earlier.
likely to be even greater in the VMD. Therefore, the de- Correspondingly, the altered flood pulse along the Mekong
creased flood pulse at Chaktomuk and Neak Luong is likely mainstream affected the annual reverse flows along the Tonle
to propagate further downstream to the VMD. Also, a smaller Sap River. At Prek Kdam, total annual reverse flow dropped
flood pulse will bring fewer sediments to the VMD (Binh et from 48.67 km3 in 1962–1972 to 31.74 km3 in 2010–2018,
al., 2021). As a result, the current problems of land subsi- representing a dramatic drop of 56.5 %. Correspondingly, the
dence and seawater intrusion there may become more severe Tonle Sap Lake has also been altered by this huge change.
in the future (Binh et al., 2020a; Kantoush et al., 2017; Zoc- There, minimum and maximum water levels have dropped by
carato et al., 2018). 0.10 and 1.06 m respectively. These reductions correspond to
The continued expansion of irrigation and sand-mining a decrease in lake area of 3.1 % in the dry season and 20.6 %
operations in the Cambodian floodplains may be unsustain- during the wet season.
able in the long run. The annual flood pulse is key to regu- These figures were put into perspective as we consid-
lation of the health of the floodplains, from fisheries to sedi- ered various possible anthropogenic drivers for the hydro-
ment replenishment. For instance, annual floods increase soil logical change. We showed that it is unlikely that upstream
health through buffering acidity and increasing its nutrient dams are the main contributing factor for the decline in flood
content (Dang et al., 2016; Sakamoto et al., 2007). A reduc- pulse. Instead, the hydrological alterations are more likely
tion of the flood pulse amplitude and duration will reduce to be caused by local factors. The boom in irrigation in-
the annual flood extent, thereby reducing soil productivity. frastructure in the last decade has resulted in more water
Concurrently, as fish migration cycles are intimately tied to being diverted away from the Mekong and Tonle Sap Lake
the flooding extent, the shift in flood pulse timing will affect to the fields. We estimate that an average of (2.1 ± 0.3) km3
catch rates (Baran and Myschowoda, 2009; Enomoto et al., of water was lost per year from the Cambodian floodplains
2011). from 1976–2019. Additionally, declining sediments com-
bined with sand-mining operations have caused further chan-
5.5 Limitations and future directions nel erosion. Together, irrigation and channel incision has
contributed to the observed reduction in flood pulse at the
Firstly, this study is limited by the hydrological data avail- Cambodian floodplains.
able. For example, the water level data at Kampong Luang As the hydraulic gradient governing the reverse flow to
(Tonle Sap Lake) are only available from 1996 onwards, the Tonle Sap Lake decreases, the lake may suffer a perma-
hampering efforts to understand the hydrology of the lake nent reduction in water volume. Furthermore, the impacts of
during the pre-dam era. Secondly, in light of channel incision the runoff reduction will be felt further downstream in the
https://doi.org/10.5194/hess-26-609-2022 Hydrol. Earth Syst. Sci., 26, 609–625, 2022622 S. D. X. Chua: Drastic decline of flood pulse in the Cambodian floodplains
VMD. This identified shift in flood pulse is non-trivial, with References
far-reaching ecological and environmental impacts across in-
ternational borders. Therefore, policy planners must consider Araki, Y., Hirabuki, Y., Powkhy, D., Tsukawaki, S., Rachna, C.,
the long-term impact of their plans such that the harvesting Tomita, M., and Suzuki, K.: Influence of Large Seasonal Water
Level Fluctuations and Human Impact on the Vegetation of Lake
of the Mekong can be conducted sustainably.
Tonle Sap, Cambodia, in Forest Environments in the Mekong
River Basin, edited by: Sawada, H., Araki, M., Chappell, N.
A., LaFrankie, J. V., and Shimizu, A., Springer, Japan, 281–294,
Data availability. Hydrological data are open source and can be Tokyo, https://doi.org/10.1007/978-4-431-46503-4_26, 2007.
downloaded from the MRC data portal at https://portal.mrcmekong. Arias, M. E., Cochrane, T. A., Piman, T., Kummu, M., Caruso,
org/home (Mekong River Commission, 2021). Precipitation data B. S., and Killeen, T. J.: Quantifying changes in flood-
used in this study were also obtained from the MRC portal. ing and habitats in the Tonle Sap Lake (Cambodia) caused
by water infrastructure development and climate change
in the Mekong Basin, J. Environ. Manage., 112, 53–66,
Supplement. The supplement related to this article is available on- https://doi.org/10.1016/j.jenvman.2012.07.003, 2012.
line at: https://doi.org/10.5194/hess-26-609-2022-supplement. Arias, M. E., Cochrane, T. A., Norton, D., Killeen, T. J., and Khon,
P.: The Flood Pulse as the Underlying Driver of Vegetation in the
Largest Wetland and Fishery of the Mekong Basin, Ambio, 42,
Author contributions. SDXC: conceptualisation, data curation, for- 864–876, https://doi.org/10.1007/s13280-013-0424-4, 2013.
mal analysis, methodology, writing – original draft, writing – review Arias, M. E., Piman, T., Lauri, H., Cochrane, T. A., and
and editing. LXX: conceptualisation, data curation, methodology, Kummu, M.: Dams on Mekong tributaries as significant con-
writing – review and editing, funding acquisition. CO: data cura- tributors of hydrological alterations to the Tonle Sap Flood-
tion, methodology, writing – review and editing. TS: data curation, plain in Cambodia, Hydrol. Earth Syst. Sci., 18, 5303–5315,
methodology, writing – review and editing. CGW: writing – review https://doi.org/10.5194/hess-18-5303-2014, 2014.
and editing. Asian Development Bank: Irrigated Agriculture Improvement
Project: Report and Recommendation of the President, available
at: https://www.adb.org/projects/documents/cam-51159-002-rrp
Competing interests. The contact author has declared that neither (last access: 1 July 2021), 2019a.
they nor their co-authors have any competing interests. Asian Development Bank: Kingdom of Cambodia: Preparing
the Irrigated Agriculture Improvement Project, available at:
https://www.adb.org/sites/default/files/project-documents/
Disclaimer. Publisher’s note: Copernicus Publications remains 51159/51159-001-tacr-en.pdf (last access: 1 July 2021), 2019b.
neutral with regard to jurisdictional claims in published maps and Baran, E. and Myschowoda, C.: Dams and fisheries in the
institutional affiliations. Mekong Basin, Aquat. Ecosyst. Health, 12, 227–234,
https://doi.org/10.1080/14634980903149902, 2009.
Best, J.: Anthropogenic stresses on the world’s big rivers, Nat.
Geosci., 12, 7–21, https://doi.org/10.1038/s41561-018-0262-x,
Special issue statement. This article is part of the special issue
2019.
“Socio-hydrology and transboundary rivers”. It is not associated
Binh, D. Van, Kantoush, S., and Sumi, T.: Changes to long-
with a conference.
term discharge and sediment loads in the Vietnamese Mekong
Delta caused by upstream dams, Geomorphology, 353, 107011,
https://doi.org/10.1016/j.geomorph.2019.107011, 2020a.
Acknowledgements. We want to thank the Mekong River Commis- Binh, D. Van, Kantoush, S. A., Saber, M., Mai, N. P., Maskey,
sion (MRC) for access to the hydrological data. We want to thank S., Phong, D. T., and Sumi, T.: Long-term alterations of flow
the Ministry of Water Resources and Meteorology, Cambodia for regimes of the Mekong River and adaptation strategies for the
their support. Also, we would like to thank our three anonymous Vietnamese Mekong Delta, J. Hydrol. Reg. Stud., 32, 100742,
reviewers and editor Fuqiang Tian for their insightful comments. https://doi.org/10.1016/j.ejrh.2020.100742, 2020b.
This study was supported by the National University of Singapore Binh, D. Van, Kantoush, S. A., Sumi, T., Mai, N. P., Ngoc, T. A.,
(R-109-000-227-115; R-109-000-273-112). Trung, L. V., and An, T. D.: Effects of riverbed incision on the
hydrology of the Vietnamese Mekong Delta, Hydrol. Process.,
35, e14030, https://doi.org/10.1002/hyp.14030, 2021.
Financial support. This research has been supported by the Na- Bovee, K. D. and Scott, M. L.: Implications of flood pulse restora-
tional University of Singapore (grant nos. R-109-000-227-115 and tion forpopulus regeneration on the upper Missouri River, River
R-109-000-273-112). Res. Appl., 18, 287–298, https://doi.org/10.1002/rra.672, 2002.
Bravard, J.-P., Goichot, M., and Gaillot, S.: Geography of Sand
and Gravel Mining in the Lower Mekong River, EchoGéo, 26,
Review statement. This paper was edited by Fuqiang Tian and re- https://doi.org/10.4000/echogeo.13659, 2013.
viewed by three anonymous referees. Bresney, S. R., Forni, L., Mautner, M. R. L., Huber-Lee, A.,
Shrestha, M., Moncada, A. M., Ghosh, E., and Sophar-
ith, T.: Investigating Tradeoffs between Agricultural Devel-
Hydrol. Earth Syst. Sci., 26, 609–625, 2022 https://doi.org/10.5194/hess-26-609-2022S. D. X. Chua: Drastic decline of flood pulse in the Cambodian floodplains 623
opment and Environmental Flows under Climate Change in Guan, Y. and Zheng, F.: Alterations in the Water-Level
the Stung Chinit Watershed, Cambodia, Hydrology, 7, 95, Regime of Tonle Sap Lake, J. Hydrol. Eng., 26, 05020045,
https://doi.org/10.3390/hydrology7040095, 2020. https://doi.org/10.1061/(ASCE)HE.1943-5584.0002013, 2021.
Brunier, G., Anthony, E. J., Goichot, M., Provansal, M., Hackney, C. R., Darby, S. E., Parsons, D. R., Leyland, J., Best, J.
and Dussouillez, P.: Recent morphological changes in L., Aalto, R., Nicholas, A. P., and Houseago, R. C.: River bank
the Mekong and Bassac river channels, Mekong delta: instability from unsustainable sand mining in the lower Mekong
The marked impact of river-bed mining and implications River, Nat. Sustain., 3, 217–225, https://doi.org/10.1038/s41893-
for delta destabilisation, Geomorphology, 224, 177–191, 019-0455-3, 2020.
https://doi.org/10.1016/j.geomorph.2014.07.009, 2014. Hackney, C. R., Vasilopoulos, G., Heng, S., Darbari, V., Walker,
Bussi, G., Darby, S. E., Whitehead, P. G., Jin, L., Dadson, S. S., and Parsons, D. R.: Sand mining far outpaces natural sup-
J., Voepel, H. E., Vasilopoulos, G., Hackney, C. R., Hut- ply in a large alluvial river, Earth Surf. Dynam., 9, 1323–1334,
ton, C., Berchoux, T., Parsons, D. R., and Nicholas, A.: Im- https://doi.org/10.5194/esurf-9-1323-2021, 2021.
pact of dams and climate change on suspended sediment Halls, A. S. and Hortle, K. G.: Flooding is a key driver of the
flux to the Mekong delta, Sci. Total Environ., 755, 142468, Tonle Sap dai fishery in Cambodia, Sci. Rep.-UK, 11, 3806,
https://doi.org/10.1016/j.scitotenv.2020.142468, 2021. https://doi.org/10.1038/s41598-021-81248-x, 2021.
Campbell, I. C., Say, S., and Beardall, J.: Tonle Sap Lake, the Hecht, J. S., Lacombe, G., Arias, M. E., Dang, T. D., and Pi-
Heart of the Lower Mekong, in The Mekong, edited by: Camp- man, T.: Hydropower dams of the Mekong River basin: A re-
bell, I. C., Elsevier, 251–272, https://doi.org/10.1016/B978-0-12- view of their hydrological impacts, J. Hydrol., 568, 285–300,
374026-7.00010-3, 2009. https://doi.org/10.1016/j.jhydrol.2018.10.045, 2019.
Chen, A., Liu, J., Kummu, M., Varis, O., Tang, Q., Mao, G., Inomata, H. and Fukami, K.: Restoration of historical hydrological
Wang, J., and Chen, D.: Multidecadal variability of the Tonle data of Tonle Sap Lake and its surrounding areas, Hydrol. Pro-
Sap Lake flood pulse regime, Hydrol. Process., 35, e14327, cess., 22, 1337–1350, https://doi.org/10.1002/hyp.6943, 2008.
https://doi.org/10.1002/hyp.14327, 2021. Ji, X., Li, Y., Luo, X., and He, D.: Changes in the Lake
Cochrane, T. A., Arias, M. E., and Piman, T.: Historical impact of Area of Tonle Sap: Possible Linkage to Runoff Alter-
water infrastructure on water levels of the Mekong River and ations in the Lancang River?, Remote Sens., 10, 866,
the Tonle Sap system, Hydrol. Earth Syst. Sci., 18, 4529–4541, https://doi.org/10.3390/rs10060866, 2018.
https://doi.org/10.5194/hess-18-4529-2014, 2014. Junk, W. J., Bayley, P. B., and Sparks, R. E.: The flood pulse concept
Cramb, R., Sareth, C., and Vuthy, T.: The Commercialisation in river-floodplain systems, Can. J. Fish. Aquat. Sci., 106, 110–
of Rice Farming in Cambodia, in White Gold: The Com- 127, 1989.
mercialisation of Rice Farming in the Lower Mekong Basin, Kallio, M. and Kummu, M.: Comment on “Changes of inundation
Springer Singapore, edited by: Cramb, R., Singapore, 227–245, area and water turbidity of Tonle Sap Lake: responses to climate
https://doi.org/10.1007/978-981-15-0998-8_11, 2020. changes or upstream dam construction?”, Environ. Res. Lett., 16,
Dang, T. D., Arias, M. E., Van, P. D., Vries, T. T., and Cochrane, 058001, https://doi.org/10.1088/1748-9326/abf3da, 2021.
T. A.: Analysis of water level changes in the Mekong floodplain Kantoush, S., Binh, D. Van, Sumi, T., and Trung, L. V.:
impacted by flood prevention systems and upstream dams, in E- Impact of upstream hydropower dams and climate change
proceedings of the 36th IAHR World Congress, The Hague & on hydrodynamics of Vietnamese Mekong delta, J. Japan
Delft, 28 June–3 July 2015, 7935, 2015. Soc. Civ. Eng. Ser. B1 (Hydraul. Eng.), 73, I_109–I_114,
Dang, T. D., Cochrane, T. A., Arias, M. E., Van, P. D. T., and de https://doi.org/10.2208/jscejhe.73.I_109, 2017.
Vries, T. T.: Hydrological alterations from water infrastructure Kea, S., Li, H., and Pich, L.: Technical Efficiency and Its Deter-
development in the Mekong floodplains, Hydrol. Process., 30, minants of Rice Production in Cambodia, Economies, 4, 22,
3824–3838, https://doi.org/10.1002/hyp.10894, 2016. https://doi.org/10.3390/economies4040022, 2016.
Enomoto, K., Ishikawa, S., Hori, M., Sitha, H., Song, S. L., Thuok, Keovilignavong, O., Nguyen, T. H., and Hirsch, P.: Re-
N., and Kurokura, H.: Data mining and stock assessment of fish- viewing the causes of Mekong drought before and
eries resources in Tonle Sap Lake, Cambodia, Fish. Sci., 77, 713– during 2019–20, Int. J. Water Resour. Dev., 1–21,
722, https://doi.org/10.1007/s12562-011-0378-z, 2011. https://doi.org/10.1080/07900627.2021.1967112, 2021.
Erban, L. E. and Gorelick, S. M.: Closing the irrigation deficit Kondolf, G. M.: Hungry Water: Effects of Dams and Gravel
in Cambodia: Implications for transboundary impacts on Mining on River Channels, Environ. Manage., 21, 533–551,
groundwater and Mekong River flow, J. Hydrol., 535, 85–92, https://doi.org/10.1007/s002679900048, 1997.
https://doi.org/10.1016/j.jhydrol.2016.01.072, 2016. Kondolf, G. M., Rubin, Z. K., and Minear, J. T.: Dams on the
Fujii, H., Garsdal, H., Ward, P., Ishii, M., Morishita, K., and Mekong: Cumulative sediment starvation, Water Resour. Res.,
Boivin, T.: Hydrological roles of the Cambodian floodplain of 50, 5158–5169, https://doi.org/10.1002/2013WR014651, 2014.
the Mekong River, Int. J. River Basin Manag., 1, 253–266, Kondolf, G. M., Schmitt, R. J. P., Carling, P., Darby, S., Arias, M.,
https://doi.org/10.1080/15715124.2003.9635211, 2003. Bizzi, S., Castelletti, A., Cochrane, T. A., Gibson, S., Kummu,
Grundy-Warr, C. and Lin, S.: The unseen transboundary commons M., Oeurng, C., Rubin, Z., and Wild, T.: Changing sediment bud-
that matter for Cambodia’s inland fisheries: Changing sediment get of the Mekong: Cumulative threats and management strate-
flows in the Mekong hydrological flood pulse, Asia Pac. Viewp., gies for a large river basin, Sci. Total Environ., 625, 114–134,
61, 249–265, https://doi.org/10.1111/apv.12266, 2020. https://doi.org/10.1016/j.scitotenv.2017.11.361, 2018.
Kong, H., Chevalier, M., Laffaille, P., and Lek, S.: Spatio-temporal
variation of fish taxonomic composition in a South-East Asian
https://doi.org/10.5194/hess-26-609-2022 Hydrol. Earth Syst. Sci., 26, 609–625, 2022You can also read