Speech Intensity Response to Altered Intensity Feedback in Individuals With Parkinson's Disease - Western University
←
→
Page content transcription
If your browser does not render page correctly, please read the page content below
JSLHR

                                                                   Research Article

                         Speech Intensity Response to Altered
                           Intensity Feedback in Individuals
                               With Parkinson’s Disease
                  Anita Senthinathan,a                   Scott Adams,b,c,d Allyson D. Page,b,c                              and Mandar Jogd

Purpose: Hypophonia (low speech intensity) is the most                                   feedback conditions included 5-, 10-, and 15-dB reductions
common speech symptom experienced by individuals with                                    and increases in the feedback intensity. Speech tasks were
Parkinson’s disease (IWPD). Previous research suggests                                   completed in no noise and in background noise.
that, in IWPD, there may be abnormal integration of sensory                              Results: IWPD displayed a reduced response to the altered
information for motor production of speech intensity. In the                             intensity feedback compared to control participants. This
current study, intensity of auditory feedback was systematically                         reduced response was most apparent when participants
manipulated (altered in both positive and negative directions)                           were speaking in background noise. Specific task-based
during sensorimotor conditions that are known to modulate                                differences in responses were observed such that the
speech intensity in everyday contexts in order to better                                 reduced response by IWPD was most pronounced during
understand the role of auditory feedback for speech                                      the conversation task.
intensity regulation.                                                                    Conclusions: The current study suggests that IWPD have
Method: Twenty-six IWPD and 24 neurologically healthy                                    abnormal processing of auditory information for speech
controls were asked to complete the following tasks: converse                            intensity regulation, and this disruption particularly impacts their
with the experimenter, start vowel production, and read                                  ability to regulate speech intensity in the context of speech
sentences at a comfortable loudness, while hearing their                                 tasks with clear communicative goals (i.e., conversational
own speech intensity randomly altered. Altered intensity                                 speech) and speaking in background noise.

P
        arkinson’s disease (PD) is a neurodegenerative                                   dysarthria. Hypophonia or low speech intensity has been
        movement disorder characterized by major motor                                   found to be the most common speech symptom experienced
        features of rest tremor (3–5 Hz frequency), rigidity                             by individuals with PD (IWPD), across age and disease du-
(increased, sustained muscle tone), akinesia (reduced number                             ration (Adams & Dykstra, 2009; Darley et al., 1969; Duffy,
of spontaneous movements), bradykinesia (slowed move-                                    2013; Logemann et al., 1978; Wertheimer et al., 2014). Sev-
ments), hypokinesia (reduced range of movements), postural                               eral studies have provided evidence of the impact speech
instability, and speech symptoms classified as hypokinetic                               intensity has on speech intelligibility (Adams et al., 2008;
                                                                                         Andreeta et al., 2016; Dykstra et al., 2012). Reduced loud-
a
                                                                                         ness has been implicated in reduced overall quality of life,
  Department of Speech-Language Pathology, SUNY Buffalo State,                           withdrawal from social interactions, and decreased partici-
NY
b                                                                                        pation (Miller et al., 2006).
  Department of Health and Rehabilitation Sciences, Western
University, London, Ontario, Canada
                                                                                                The specific pathological mechanism causing speech
c
 School of Communication Sciences and Disorders, Western                                 impairment in PD is unclear; however, it is hypothesized
University, London, Ontario, Canada                                                      that sensory or sensorimotor integration deficits constitute
d
  Department of Clinical Neurological Sciences, Western University,                      this aspect of PD. Several theoretical models have been
London, Ontario, Canada                                                                  proposed to describe the basis of speech motor control.
Correspondence to Anita Senthinathan: senthida@buffalostate.edu                          These models suggest an internal forward mechanism and
Editor-in-Chief: Cara E. Stepp                                                           that auditory feedback is critical for detection and correc-
Editor: Benjamin Parrell                                                                 tion of mismatches between intended and actual vocal
Received May 21, 2020                                                                    output (Bays et al., 2005; Burnett et al., 1998; Houde &
Revision received November 1, 2020                                                       Nagarajan, 2011; Tourville et al., 2008; Voss et al., 2007;
Accepted January 12, 2021                                                                Wiener, 1948, as cited in Fairbanks, 1954; Wolpert &
https://doi.org/10.1044/2021_JSLHR-20-00278
Publisher Note: This article is part of the Special Issue: Selected Papers
From the 2020 Conference on Motor Speech—Basic Science and                               Disclosure: The authors have declared that no competing interests existed at the time
Clinical Innovation.                                                                     of publication.

            Journal of Speech, Language, and Hearing Research • Vol. 64 • 2261–2275 • June 2021 • Copyright © 2021 American Speech-Language-Hearing Association       2261
    Downloaded from: https://pubs.asha.org University of Western Ontario on 07/09/2021, Terms of Use: https://pubs.asha.org/pubs/rights_and_permissions
Ghahramani, 2000). It is predicted that evidence for a sen-                   In the current context, which is less concerned with telephony
sorimotor integration deficit hypothesis for speech produc-                   and focused on concerns about auditory intensity feedback
tion would be most apparent during an ongoing speech                          regulation in speech disorders such as PD, the authors pre-
movement. If during a speech movement one experiences                         fer to use the term altered intensity feedback.
unexpected alterations of the sensory feedback (e.g., audi-                          The AIF manipulation causes the participant to hear
tory, visual, proprioceptive), the system should be able to                   their speech at an altered (increased or decreased) intensity
recognize the incongruence from the motor plan and adjust                     than is actually produced. This results in a healthy speaker
or compensate accordingly. For example, previous litera-                      adjusting their intensity to speak at a quieter loudness when
ture has described this type of compensatory response by                      hearing increased intensity feedback as a presumed com-
neurologically healthy speakers (pitch, formant structure,                    pensatory response (Ho et al., 1999; Lane et al., 1961, 1969;
and intensity perturbations) as a modification to speech pro-                 Siegel & Pick, 1974). Few previous studies have examined
duction in the opposite direction to the alteration (Bauer                    responses to AIF in PD. Ho et al. (1999) found that IWPD
et al., 2006; Burnett et al., 1998; Heinks-Maldonado &                        failed to adjust their intensity in a conversation task, implying
Houde, 2005; Purcell & Munhall, 2006; Tourville et al.,                       disrupted loudness perception. This study did not evaluate
2008). Perturbation studies involve examination of the                        the response of participants with PD to decreased intensity
rapid and unexpected response to a brief (~200–500 ms)                        feedback; however, the magnitude of the response to re-
auditory perturbation to the speech signal (e.g., pitch, for-                 duced intensity feedback may not be similar to the response
mant frequency, duration, intensity). In IWPD, studies of                     to increased intensity feedback. In addition, should a re-
auditory perturbation (pitch and formant frequency) have                      sponse to decreased intensity feedback result in increased
found that patients exhibit an abnormal response to sensori-                  speech intensity, there may be an opportunity for AIF to
motor integration compared to control groups (larger mag-                     be used for therapeutic or speech management purposes.
nitude of compensation, longer response peak and end                                 Although similar to the adaptation paradigm used by
durations; Chen et al., 2013; Huang et al., 2016; Kiran                       Abur et al. (2018), as the AIF procedure involves a presumed
& Larson, 2001). Similarly, Liu et al. (2012) found larger                    adaptation to the altered feedback, the current paradigm ex-
response magnitudes to intensity perturbations by partic-                     tends to include continuous alteration of feedback over longer
ipants with PD compared to healthy controls.                                  durations and across more complex speech tasks. Intensity
       An additional characteristic of speech motor control                   regulation involves the complex processing of external cues
is the capacity to adapt to novel conditions. Adaptation to                   or conditions; in typical conversational settings, the speaker
continuous and predictable auditory perturbations have dem-                   must monitor the environment and their own speech inten-
onstrated that healthy speakers are capable of adapting their                 sity levels in order to compensate for such factors as ambi-
speech motor strategies (see Perkell, 2012, for a review). Stud-              ent or background noise in their surroundings and how near
ies on the adaptation response to perturbed auditory feedback                 or far their listener is situated. The varied contexts that a
(fundamental frequency and first formant shifts) in PD found                  speaker experiences necessarily mean that processing of ad-
reduced responses by IWPD in comparison to control partici-                   ditional factors such as distance, communicative intent, and
pants (Abur et al., 2018; Mollaei et al., 2013). These results                cognitive load is all implicated in the regulation of speech
have been interpreted to suggest that, in PD, although an                     intensity in naturalistic contexts.
error signal is detected and corrected by the feedback con-                          Interestingly, although Ho et al. (1999) found a pos-
trol system, there is an impaired ability to update the feed-                 sible disrupted loudness perception in a conversation task,
forward control system, resulting in a reduced adaptation                     this and another study of continuous AIF report that, during
response (Abur et al., 2018).                                                 reading and counting tasks, the PD group responded simi-
       In IWPD, it has been suggested that hypophonia may                     larly to controls (Coutinho et al., 2009; Ho et al., 1999). This
be a result of auditory–motor integration deficits (Adams &                   is suggestive of a possible task effect. Due to limited previous
Dykstra, 2009). The error correction ability during altered                   research, the impact of AIF on PD-related speech intensity
intensity feedback (AIF) in IWPD may be abnormal, and                         regulation in a range of speaking conditions and speech tasks
further examination of this abnormality may provide in-                       requires further exploration.
sight into which part of the process is disrupted.
                                                                              Background Noise
AIF                                                                                 The Lombard effect (Lombard, 1911) is the phenome-
        Unlike the brief and rapid (~200–500 ms) alterations                  non in which a person increases their speech intensity when
in feedback used in perturbation and adaptation paradigms,                    speaking in a noisy environment. This observation remains
the AIF paradigm involves the continuous alteration of feed-                  consistent across reading and conversational tasks, with
back across complete utterances or across multiple utterances                 several studies providing evidence of healthy speakers in-
(i.e., conversation or reading passage). The AIF paradigm                     creasing their intensity with increasing levels of background
has been previously referred to as the side tone paradigm in                  noise and decreasing their speech intensity once the noise
the field of telephony because of the original focus on early                 is stopped (Adams, Dykstra, et al., 2006; Ho et al., 1999;
telephone operators hearing their own speech intensity al-                    Lane & Tranel, 1971; Pick et al., 1989). Previous work
tered by the simultaneous (side tone) headphone feedback.                     suggests an “overall gain reduction” for speech intensity

2262    Journal of Speech, Language, and Hearing Research • Vol. 64 • 2261–2275 • June 2021

 Downloaded from: https://pubs.asha.org University of Western Ontario on 07/09/2021, Terms of Use: https://pubs.asha.org/pubs/rights_and_permissions
in IWPD when speaking in noise (Adams, Dykstra, et al.,                       Method
2006; Ho et al., 1999). This is because IWPD spoke at a con-
sistently lower intensity despite producing sequentially in-                  Participants
creased intensity responses across increasing background                             Twenty-six IWPD (19 men and seven women, 69.38 ±
noise levels (Adams, Dykstra, et al., 2006; Ho et al., 1999).                 6.38 years old) and 24 neurologically healthy control partici-
                                                                              pants (eight men and 16 women, 73.29 ± 5.98 years) were in-
                                                                              cluded in the study (following the exclusion of one participant
Speech Tasks                                                                  with PD due to his inability to complete the full study proto-
       Speech intensity can be obtained across a vowel, a                     col for scheduling reasons, exclusion of one control partici-
sentence, and a breath group or utterance within speech                       pant due to a technical issue with the audio recording, and
(Adams et al., 2005; Huber & Darling, 2012; Neel, 2009).                      another control participant not meeting eligibility criteria
The nature of the speech task has an influence on the regu-                   for no prior speech disorder). There was no significant dif-
lation of speech intensity (Fox & Ramig, 1997; Rosen et al.,                  ference in age between the PD and control groups, t(48) =
2005). Quasispeech tasks include those that do not necessar-                  −1.517, p = .136. Participants with PD were recruited from
ily represent natural speaking intensity (e.g., vowel produc-                 patients seen by a movement disorder neurologist and were
tion compared to conversational tasks; Rosen et al., 2005).                   diagnosed by him as having idiopathic PD and some degree
Junqua et al. (1999) found speech intensity increased more                    of hypophonia. To classify hypophonia severity, a simple
in background noise (Lombard effect) during conversational                    clinical judgment of mild, moderate, or severe hypophonia
speech than in a reading task. The effect of speech task on                   was carried out by the first author with 10+ years’ experience
speech intensity regulation is also exemplified by work con-                  of working with IWPD. These ratings were made during the
ducted by S. Patel et al. (2014). These researchers found                     initial study visit while the patient produced conversational
healthy participants regulate speech intensity (during per-                   speech in a quiet room at a listener-to-talker distance of 2 m.
turbed feedback) only in speaking contexts that require a                     Control participants were recruited from the Research Re-
specific linguistic goal, specifically relating to emphatic stress            tirement Association in London and the Western University
in a sentence. However, it is possible that suprasegmental                    Alumni Association. Exclusion criteria for all participants in-
and segmental aspects of speech may be controlled by dif-                     cluded having no other speech-language impairments besides
ferent mechanisms for which auditory feedback plays dif-                      those resulting from a diagnosis of PD, cognition (assessed
ferent roles (Perkell et al., 2007).                                          using the Montréal Cognitive Assessment) in the normal
       Interestingly, whereas neurologically healthy control                  range (> 22; Nasreddine et al., 2005), and passing a binau-
participants show a tendency to increase their intensity when                 ral hearing screen with thresholds of 40 dB HL at 0.25, 0.5,
speaking in conversational tasks, particularly those with                     1, and 2 kHz frequencies. Participants with PD were stabi-
added cognitive requirements (i.e., speaking about personal                   lized on their antiparkinsonian medication and were tested
experiences), participants with PD do not make a similar                      approximately 1 hr after taking their regularly scheduled
adjustment (Ho et al., 1999; Winkworth et al., 1994). A study                 dose. The mean disease duration since diagnosis was 8.08 ±
by Moon (2005) found a greater reduction in speech inten-                     5.09 years, and mean Unified Parkinson’s Disease Rating
sity during conversational tasks compared to reading.                         Scale Part III (Goetz et al., 2007) score was 24.02 ± 7.60.
       Despite the work that has been conducted on speech                     All participants provided written consent for participation
intensity perception and production in IWPD, there is a                       in the study, and the research protocol was approved by
paucity of literature that has examined sensorimotor inte-                    the Human Subjects Research Ethics Board (Western
gration for speech production in the speech intensity domain.                 University Ethics No. 109016). Demographic information
This study aimed to (a) examine IWPD’s speech intensity                       for participants with PD is reported in Table 1.
response to AIF and determine whether this response
varied depending on the direction of the AIF (positive vs.
negative direction). In addition, examination of sensori-                     Apparatus
motor integration in the context of the range of commu-                             All participants were seated in an audiometric booth
nicative situations (such as speaking in background noise                     for the duration of the study. Participants were provided
or speaking with different interlocuter distances) and a                      with a standard set of audiometric headphones (Telephonics
range of speech tasks experienced by these individuals is                     51OCO17-1) and headset microphone (AKG C520) attached
needed. Thus, this study also aimed to (b) examine the                        to a preamplifier (M-Audio preamp USB), an audiometer
role that auditory sensory feedback plays in PD-related                       (GSI-10, model 1710), and a desktop computer. A sche-
intensity control during speech tasks, including socially                     matic of the experimental setup is provided in Figure 1.
driven speech tasks, and (c) in the naturalistic context of                   The microphone was placed 6 cm from the midline of the
speaking in background noise, which is known to impact                        participant’s mouth. Calibration of the microphone was
speech intensity. It is hypothesized that IWPD will display                   established through the use of a sound level meter placed
a reduced response to the altered feedback in both altered                    15 cm (6 in.) from the participant’s mouth while they pro-
intensity directions (positive and negative), across all speech               duced three short (< 5 s) “ah” sounds at 70 dBA SPL. The
tasks, and have particular difficulty modulating their speech                 recording module in Praat software (Boersma & Weenink,
in the context of background noise.                                           2011) was used to digitize the speech samples at 44.1 kHz

                                                               Senthinathan et al.: Altered Intensity Feedback and Parkinson’s Disease         2263
 Downloaded from: https://pubs.asha.org University of Western Ontario on 07/09/2021, Terms of Use: https://pubs.asha.org/pubs/rights_and_permissions
Table 1. Participants with Parkinson’s disease (PD) demographic
                                                                              were as follows: (1) conversation with the experimenter (1 m,
information.
                                                                              near interlocutor distance), (2) conversation with the experi-
Participant Gender Age PD duration Hypophonia severity
                                                                              menter (6 m, far interlocutor distance), (3) vowel production
                                                                              (4–5 s of sustained “ah”), and (4) reading at habitual speech
PD 01           F        68          7           Mild                         intensity (standard sentence that includes a variety of conso-
PD 02           M        71        13            Moderate                     nant and vowel sounds; useful in the acoustic analysis of PD
PD 03           M        78        NA            Moderate                     speech “She saw patty buy two poppies”; Abeyesekera et al.,
PD 04           M        69          6           Moderate
PD 05           M        80        14            Moderate                     2019; Knowles et al., 2018). Throughout each of the tasks
PD 06           M        69        12            Mild                         listed above (Tasks 1–4), the participants received randomly
PD 07           M        75          4           Moderate                     presented AIF related to their own speech. The random
PD 08           F        56          3           Moderate                     AIF conditions included two repetitions of the following
PD 09           M        66        10            Mild
PD 10           M        83          9           Moderate                     seven AIF conditions: 5-, 10-, and 15-dB reductions in the
PD 11           M        68        3.5           Mild                         feedback intensity; 5-, 10-, and 15-dB increases; and 0 dB
PD 12           M        70        13            Mild                         or no alteration in the feedback intensity. These tasks were
PD 13           M        71          5           Moderate-severe              first completed in no noise and then repeated in 65 dB SPL
PD 14           M        74          2           Mild-moderate
PD 15           M        69        10            Mild
                                                                              of multitalker background noise (four-talker Audiotec re-
PD 17           M        74        2.5           Mild                         cording). Participants were naïve to the altered feedback
PD 18           M        63          6           Mild                         conditions. AIF was initiated following instructions for
PD 19           M        78          3           Mild                         each task, just prior to participant speech production, and
PD 20           M        73          7           Mild
PD 21           M        63          7           Moderate
                                                                              was terminated once the participant completed the requested
PD 22           F        73        25            Mild                         task. For the conversation tasks, participants were requested
PD 23           F        74        11            Mild                         to discuss familiar topics with the experimenter for about
PD 24           M        72          8           Moderate                     five to 10 utterances per altered feedback condition. Topics
PD 25           F        54          5           Mild
                                                                              included family, hobbies, occupational experiences, interests,
PD 26           F        68          4           Moderate
PD 27           F        64        12            Mild                         and recent vacations. Instances of noticeably high emotion-
                                                                              ally laden utterances during which the participant was visi-
Note. Hypophonia severity = as rated by experimenter; F = female;             bly upset were excluded from analysis (e.g., discussions that
M = male; NA = data not available.
                                                                              naturally progressed to death of a loved one). In these rare
                                                                              instances, additional samples of speech for that AIF condi-
                                                                              tion were elicited and were used to replace the emotionally
and 16 bits. During speech tasks, the audiometer was used                     laden utterances. Several acoustic differences (e.g., longer
to alter the intensity of the participant’s speech. The head-                 vowel durations, longer voice onset times) have been previ-
phone output was calibrated to the input microphone using                     ously associated with vowel and reading tasks (Brown &
speech noise produced by the audiometer and an audio                          Docherty, 1995; Kent et al., 1997), and so to avoid this
speaker placed 6 cm from the headset microphone. The                          potential influence on the conversation tasks, the conversa-
calibration of the output of the headphones was accomplished                  tion tasks were completed first. The full study protocol was
with an earphone coupler (Bruel & Kjaer, Type 4152) at-                       typically completed in a single session, with an average
tached to a sound level meter (Bruel & Kjaer, Type 2203).                     duration of 2.75 hr (range: 2.5–3 hr), including components
                                                                              of the experiment that were not analyzed for the current
                                                                              study. Participant visits were scheduled so as to minimize
Procedure                                                                     possible fatigue; however, no direct measures of fatigue
      This study was part of a larger experimental proce-                     were obtained for the current study. Fatigue can be a de-
dure that included additional speech tasks and conditions.                    bilitating symptom in PD (Friedman et al., 2011) and has
The order of speech tasks analyzed for the current study                      been associated with reduced communication participation

               Figure 1. Schematic representation of the experimental setup.

2264    Journal of Speech, Language, and Hearing Research • Vol. 64 • 2261–2275 • June 2021

 Downloaded from: https://pubs.asha.org University of Western Ontario on 07/09/2021, Terms of Use: https://pubs.asha.org/pubs/rights_and_permissions
(McAuliffe et al., 2017) and increased effort while speaking                  Figure 2. Marginal means for the Parkinson’s disease (PD) and control
                                                                              groups and the seven altered intensity feedback (AIF) conditions.
(Solomon & Robin, 2005). Therefore, future AIF studies
should include measures of perceived fatigue. However, a
study by Makashay et al. (2015) indicated an overall fatigue-
resistant speech system in PD speakers. For the measure-
ment of speech intensity in all conditions and tasks, the
recorded speech audio files were measured off-line using
the acoustic intensity measurement module in the Praat
program. Using Praat, long (+250 ms) unvoiced segments
or pauses were selectively removed, and the root-mean-square
intensity contour method was used to obtain the average
intensity for each utterance.
       To examine the effect of AIF on speech intensity
responses in PD and control groups, a two-way repeated-
measures analysis of variance (ANOVA) with the between-
subjects factor of group (control and PD) and within-subject
factor of AIF condition (−15, 10, −5, 0, +5, +10, and
+15 dB) was conducted (collapsed across all tasks and
conditions).
       To examine the impact of speaking task and noise                       ηp2 = .811. A post hoc analysis was used to examine the
condition, a linear regression analysis was first performed on                pairwise comparisons related to the seven feedback conditions
each participant’s data using the speech intensity response                   (see Table 2), which showed a general trend of increasing
values and the corresponding values relating to each of the                   speech intensity response with decreasing AIF conditions.
seven AIF conditions (−15 to +15 dB). R2 values (coeffi-                      In addition, the Group × Feedback condition interaction
cient of determination) from each participant’s regression                    was statistically significant, F(6, 276) = 42.55, p = .000,
slopes were averaged, with mean values ranging from .33 to                    ηp2 = .481, for speech intensity. Group descriptive statistics
.78 across speaking tasks and conditions. Mean and stan-                      are provided in Table 3. To examine the interaction in more
dard deviation R2 for each speech task are provided in Ta-                    detail, nine of the potential 21 pairwise interaction post hoc
ble 5. From each of these individual participant regression                   analyses were selected, as these are of primary interest (see
analyses, an individual slope value of the AIF response was                   Table 4). These include the six post hoc analyses related to
obtained and was used to compare the group responses.                         the zero versus other conditions and the three post hoc anal-
A three-way ANOVA involving the between-subjects factor                       yses related to the positive (+) versus negative (−) conditions
of group (control and PD), the within-subject factor of speech                at the three feedback levels (Levels 5, 10, and 15). For the
tasks (conversation near, conversation far, vowel, and sen-                   zero versus other condition comparisons, five of the six post
tence reading), and the within-subject factor of noise (back-                 hoc analyses were significant. These post hoc results indicate
ground noise and no noise) was used to examine any possible                   that the absolute size of the compensation response, both in
task and noise condition effects on the AIF slope in the                      the negative and positive directions, was significantly and
two groups. To examine possible zero-intercept differences                    consistently lower for the participants with PD relative to
(slope intercept), an additional three-way ANOVA with the                     the controls.
between-subjects factor of group and the within-subject fac-                         With regard to the three interaction post hoc analyses
tors of speech tasks and background noise condition was                       involving the negative versus positive feedback conditions,
conducted with the zero-intercept dependent measure. All                      the results indicate the absolute size of the response intensity
analyses were followed by post hoc analyses and Bonferroni                    in the negative feedback conditions was significantly and
correction for multiple comparisons.                                          consistently smaller for the IWPD relative to the control
                                                                              participants. In addition, although not analyzed statistically,
                                                                              it was noted that IWPD displayed variable responses, in-
Results                                                                       cluding following responses to AIF (i.e., speech intensity
       The group speech intensity responses to AIF across                     response in the same direction as the altered feedback).
all speech tasks and noise conditions are illustrated in
Figure 2. For the two-way (Group × AIF Feedback condi-
tion) ANOVA, the sphericity assumption was not met (< .05),                   Slope Analysis
and Greenhouse–Geisser correction was used for all subse-                            The group speech intensity results and Figure 2 indi-
quent analyses. Results indicated that there was no signifi-                  cated a difference in the AIF function for the PD and
cant main effect of group, F(1, 46) = 0.327, p = .570, with                   control groups. It also appeared that the function is a near-
IWPD having a similar marginal mean (M = 68.204, SD =                         linear relationship that could be approximated by the slope
2.98) to that of the control group (M = 68.639, SD = 2.21).                   of a linear regression. Results of the three-way (Group ×
In contrast, there was a significant main effect of AIF con-                  Speech Task × Background Noise condition) ANOVA in-
dition on speech intensity, F(6, 276) = 197.48, p = .000,                     dicated that the assumption of sphericity was violated and

                                                               Senthinathan et al.: Altered Intensity Feedback and Parkinson’s Disease         2265
 Downloaded from: https://pubs.asha.org University of Western Ontario on 07/09/2021, Terms of Use: https://pubs.asha.org/pubs/rights_and_permissions
Table 2. Post hoc results related to pairwise comparisons involving the marginal means for the seven altered
intensity feedback conditions: −15, −10, −5, 0, +5, +10, and +15 dB.
Pairwise comparisons and p values
Feedback
conditions M SD −15 −10 −5 0 +5 +10 +15
−15 dB 69.91 2.76
−10 dB 69.71 2.73 .291
−5 dB 68.98 2.65 < .001* < .001*
0 dB 68.56 2.64 < .001* < .001* < .001*
+5 dB 67.87 2.63 < .001* < .001* < .001* < .001*
+10 dB 67.38 2.69 < .001* < .001* < .001* < .001* < .001*
+15 dB 66.55 2.78 < .001* < .001* < .001* < .001* < .001* < .001*
*Significant at p < .002 (.05/21 comparisons).
Greenhouse–Geisser correction was used for all subsequent tasks, and in the control group, the reading task led to a re-
analyses. The results indicated a main effect of group, duced slope (M = −.099, SD = .047) compared to all other
F(1, 43) = 60.59, p = .000, ηp2 = .585, such that the PD tasks. A post hoc interaction analysis is provided in Table 6.
group had a significantly lower (flatter) slope (M = −.061, Figure 4 shows the slope values for each group across the
SD = .043) compared to the steeper negative slope of the four speech tasks. A post hoc analysis and a visual analysis
control group (M = −.167, SD = .047). Figure 3 depicts of the graph can be used to highlight the Group × Speech
this group difference (group regression lines and slope Task interaction results. For example, the control participants
function). Note that the negative slope values suggest that, show a much larger negative slope than the participants with
as the AIF values increased, the speech intensity that was PD for the conversation tasks, but these group differences
produced decreased. Results also revealed a significant in the slope values are less pronounced and almost converge
main effect of speech task, F(2.35, 101.04) = 17.434, p = during the vowel and reading tasks. Thus, the group differ-
.000, such that the only significant differences were be- ences in slope values are most pronounced in the conversa-
tween the reading task (reduced slope) and all other tasks tion tasks compared to the reading and vowel tasks.
(reading M = −.075, conversation near M = −.118, con- Results of the ANOVA revealed an interaction of
versation far M = −.120, vowel M = −.142). The slope Background Noise × Group, F(1, 43) = 5.354, p = .026,
values of the four speech tasks in the PD and control groups ηp2 = .111. Figure 5 presents these findings, and these are
are presented in Table 5. A significant main effect of back- also reflected in the post hoc analysis of the interaction,
ground noise was found, F(1, 43) = 11.717, p = .001, which revealed a significantly reduced slope was produced
ηp2 = .214, such that a significantly reduced slope was pro- by both groups in the no-noise condition (M = −.10, SD =
duced by both groups in the no-noise condition (M = −.099, .05) compared to the steeper slope produced in the 65-dB
SD = .047) compared to the steeper slope produced in the noise condition (M = −.13, SD = .06). A within-group anal-
65-dB noise condition (M = −.129, SD = .060). ysis revealed that the PD group had slope values that were
The Group × Speech Task interaction was statistically similar across the noise conditions (no noise M = −.056,
significant, F(2.35, 101.04) = 26.96, p = .000, ηp2 = .385, and SD = .038; 65-dB noise M = −.066, SD = .043; p = .29),
a pairwise analysis of simple main effects showed that, in the while the control group showed a significant difference in
PD group, the vowel task led to a statistically significant in- slope values across the noise conditions (no noise M = −.141,
creased slope (M = −.099, SD = .047) compared to all other SD = .52; 65-dB noise M = −.192, SD = .080; p = .003). An
interaction post hoc analysis of difference scores revealed the
Table 3. Marginal means and standard deviations related to the noise condition difference (PD: no noise vs. 65-dB noise M =
seven altered intensity feedback (AIF) conditions obtained for the −.01, SD = .05; control: no noise vs. 65-dB noise M = −.05,
Parkinson’s disease (PD; n = 25) and healthy control (HC; n = 23) SD = .07) was significantly different (p < .05/2 comparisons =
groups. .025) across the two participant groups (difference score
M = .04, SE = .02, p = .019). This slope analysis indicates
PD HC that the control participants produced a steeper AIF func-
AIF conditions M SD M SD tion compared to the participants with PD and that this
group difference in the AIF slope becomes greater in the
−15 dB 68.93 2.99 70.88 2.48 context of background noise.
−10 dB 68.88 2.97 70.54 2.45
−5 dB 68.54 2.96 69.43 2.25
The Task × Background Noise interaction was also
0 dB 68.39 3.06 68.72 2.09 statistically significant, F(2.53, 108.65) = 3.204, p = .033,
+5 dB 67.89 2.98 67.84 2.18 ηp2 = .069. A post hoc analysis revealed a difference be-
+10 dB 67.67 3.00 67.09 2.29 tween the reading task (increased slope) compared to all
+15 dB 67.13 3.10 65.97 2.37
other tasks in no noise ( p < .005), whereas in 65-dB noise,
2266 Journal of Speech, Language, and Hearing Research • Vol. 64 • 2261–2275 • June 2021
Downloaded from: https://pubs.asha.org University of Western Ontario on 07/09/2021, Terms of Use: https://pubs.asha.org/pubs/rights_and_permissionsTable 4. Post hoc comparisons related to the feedback condition versus group interaction.
PD HC PD–HC difference score
Difference Standard error
conditions M SD M SD Mean difference difference t p
−15 vs. 0 −0.49 0.73 −2.12 1.02 1.64 0.25 t(48) = 6.46 < .001*
−10 vs. 0 −0.44 0.59 −1.79 0.94 1.35 0.22 t(48) = 6.05 < .001*
−5 vs. 0 −0.13 0.66 −.70 0.58 0.57 0.18 t(48) = 3.26 .002*
+5 vs. 0 0.52 0.64 0.86 0.61 −0.34 0.18 t(48) = −1.92 .060
+10 vs. 0 0.73 0.58 1.57 0.72 −0.84 0.18 t(48) = −4.59 < .001*
+15 vs. 0 1.30 0.79 2.68 1.06 −1.38 0.26 t(48) = −5.31 < .001*
−15 vs. +15 −1.78 1.05 −4.80 1.71 3.01 0.26 t(48) = 7.48 < .001*
−10 vs. +10 −1.17 0.75 −3.36 1.33 2.19 0.21 t(48) = 7.16 < .001*
−5 vs. +5 −0.65 0.61 −1.56 0.77 0.92 0.16 t(48) = 4.69 < .001*
Note. These post hoc analyses include a series of t tests involving the feedback condition difference scores versus group difference scores.
The post hoc analyses focused on the zero versus other feedback conditions and the corresponding positive versus negative feedback
conditions (i.e., +15 vs. −15 dB) instead of examining all possible pairwise comparisons. PD = Parkinson’s disease; HC = healthy control.
*Significant at p < .005 (.05/9 comparisons).
the reading task was only significantly different from the noise. For example, the IWPD had a slope value for the
vowel prolongation ( p < .005). conversation near task that was similar to the reading task
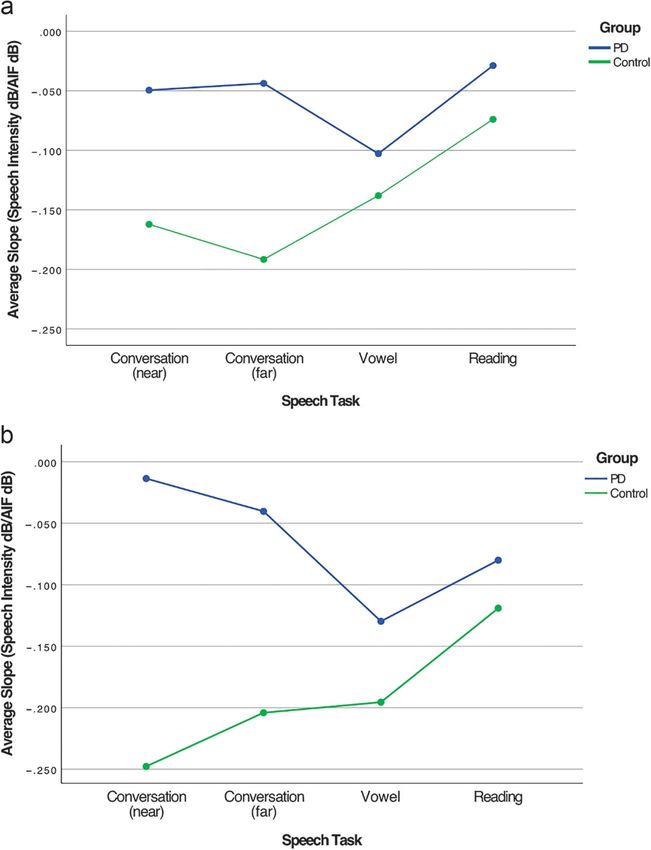
Finally, there was a significant three-way interaction while the controls had a steeper slope for the conversation
involving group, speech task, and background noise, F(2.53, near task relative to the reading task. This Group × Task
108.65) = 6.515, p = .001, ηp2 = .132. To better understand interaction becomes even greater when the 65-dB noise is
this three-way interaction, two separate graphs were created introduced. Table 7 provides a post hoc analysis of the three-
for each of the noise conditions (see Figures 6 and Figure 6a way interaction. The two significant three-way post hoc
and 6b). Examination of these graphs reveals that, during analyses (and one approaching statistical significance) in-
the no-noise condition, the IWPD and controls show differ- volve the conversation at a near distance task.
ent patterns that reflect the previously described two-way The zero-intercept was also analyzed using a three-
Group × Task interaction. Thus, the Group × Task interac- way (Group × Speech Task × Background Noise condi-
tion, with a greater group difference in the conversation tion) ANOVA. There was a significant main effect of task,
tasks, is further exaggerated in the context of background F(2.32, 106.50) = 69.41, p = .000, ηp2 = .601 (post hoc with
Bonferroni correction revealed conversation at a far distance
and the vowel task were both greater than conversation at
Figure 3. Group regression lines and slope value across all speech a near distance, which was greater than the intercept during
tasks and noise conditions in the Parkinson’s disease (PD; solid the reading task) and a main effect of background noise,
blue line) and control (dashed red line) groups. Shaded variance
bands represent 95% confidence interval. F(1, 46) = 24.77, p = .000, ηp2 = .350 (65-dB noise intercept
was greater than in no noise). The Task × Background
Noise interaction was also statistically significant, F(2.53,
108.65) = 3.204, p = .033, ηp2 = .069. A post hoc analysis
revealed an increased intercept in conversation far and vowel
compared to conversation near and reading in no noise
( p < .005), whereas in 65-dB noise, all tasks differed from
each other ( p < .005) with the exception of the vowel task
and conversation at a near distance. Neither the main effect
Table 5. Descriptive statistics for the slope values of the four speech
tasks in the Parkinson’s disease (PD) and control groups.
PD R2 Control R2
Speech task M SD M SD M SD M SD
Conversation (near) −.032 .05 .333 .19 −.205 .08 .460 .14
Conversation (far) −.042 .06 .385 .20 −.198 .06 .782 .15
Vowel −.116 .07 .616 .22 −.167 .07 .760 .18
Reading −.054 .03 .400 .24 −.097 .06 .548 .27
Note. R2 values denote coefficient of determination.
Senthinathan et al.: Altered Intensity Feedback and Parkinson’s Disease 2267
Downloaded from: https://pubs.asha.org University of Western Ontario on 07/09/2021, Terms of Use: https://pubs.asha.org/pubs/rights_and_permissionsTable 6. Post hoc analyses related to the two-way interaction involving group and speech tasks.
PD–control difference
PD Control score t test
Difference Mean Mean Mean Standard error
conditions difference SD difference SD difference difference t p
ConvoNear–ConvoFar −0.021 0.064 0.005 0.067 −0.025 0.018 t(48) = −1.37 .175
ConvoNear–Vowel −0.084 0.074 0.037 0.066 −0.121 0.020 t(48) = −6.05 < .001*
ConvoNear–Reading −0.025 0.046 0.110 0.051 −0.134 0.014 t(48) = −9.74 < .001*
ConvoFar–Vowel −0.064 0.090 0.032 0.072 −0.095 0.023 t(48) = −4.09 < .001*
ConvoFar–Reading −0.004 0.059 0.105 0.067 −0.109 0.018 t(48) = −6.07 < .001*
Reading–Vowel 0.059 0.056 0.073 0.047 −0.014 0.015 t(48) = −0.93 .358
Note. The mean difference scores between conditions are shown for each group on the left side of the table. The mean group difference
score and the related t value and p value for the post hoc interaction comparison are shown on the right hand side of the table. The four
speech tasks are labeled as follows: ConvoNear–ConvoFar, ConvoNear–Reading, ConvoNear–Vowel, ConvoFar–Reading, ConvoFar–Vowel,
and Reading–Vowel. PD = Parkinson’s disease; ConvoNear = conversation (near); ConvoFar = conversation (far).
*Significant at p < .008 (.05/6 comparisons).
of group nor any other interactions were statistically signifi- participants decreased and vice versa. However, the response
cant at p < .05 (see Appendix for ANOVA results and de- to AIF was different between the two groups. Specifically,
scriptive statistics). IWPD were observed to produce a reduced magnitude of
the response in all AIF conditions, and the slope of the AIF
function was significantly reduced in the PD group. This
Discussion difference was observed despite the lack of a significant dif-
Sensorimotor integration deficits have been hypothe- ference between the two groups’ speech intensity (lack of
sized as an explanation for several of the clinical symptoms group effect in a zero-intercept analysis), suggesting this
associated with PD, including hypokinesia and bradykine- pattern is observable even in mild hypophonia. Compared
sia (Bronstein et al., 1990; Klockgether & Dichgans, 1994; to previous studies, the current protocol included AIF in
Rinalduzzi et al., 2015; Schneider et al., 1986; Tatton et al., the negative direction, and Table 4 suggests that IWPD were
1984). Hypophonia in IWPD may be related to abnormal observed to produce a reduced magnitude of the response
auditory perception or auditory–motor integration processes in both positive- and negative-direction AIF conditions. In-
(Brajot et al., 2016; Coutinho et al., 2009; Ho et al., 1999). terestingly, when the negative and positive directions were
In the current study, most participants (PD and con- compared, the magnitude of the compensation response was
trol) displayed a compensatory response to the AIF levels, significantly less in the negative direction in the PD group.
such that, as AIF levels increased, the speech intensity of This directional difference (less in the negative direction)
Figure 4. Average slope values for all tasks in the Parkinson’s disease (PD) and control groups. AIF = altered intensity feedback.
2268 Journal of Speech, Language, and Hearing Research • Vol. 64 • 2261–2275 • June 2021
Downloaded from: https://pubs.asha.org University of Western Ontario on 07/09/2021, Terms of Use: https://pubs.asha.org/pubs/rights_and_permissionsFigure 5. Average slope values for background noise and no background noise in the Parkinson’s disease (PD) and
control groups. AIF = altered intensity feedback.
could be related to the observation that loudness decreases fundamental frequency auditory alteration for the duration
may be perceived as smaller than similar amounts of increase of the participant’s vowel production and found reduced
in intensity (Larson et al., 2007). It is also possible that a adaptation responses in IWPD. It is therefore possible that
reduced relative importance of decreased loudness to the the current AIF study and the adaptation paradigm used
auditory–motor system exists such that mechanisms to con- by Abur et al. are converging on similar sensorimotor results
trol for increased loudness are more “primed” for regulation, and that the current AIF study involves sensorimotor adap-
as only louder speech has the potential to be damaging and tation to intensity alterations. It is possible that the reduced
uncomfortable to the speaker. Still, why this may be occur- response to AIF in the current study is related to similar
ring to a greater degree in the IWPD is unclear and requires impaired feedforward processes suggested by Abur et al.
further investigation. Overall, the data fit with the assump- The speech sensorimotor adaptation differs from the
tions of the theoretical models of speech motor control, as the AIF paradigm in that adaptation studies include numerous
reduced magnitude of the response in IWPD suggests that trials and focus on quasispeech tasks (e.g., vowel produc-
the detection and correction processes of mismatches between tion). In addition, “ramp” procedures with sequentially
intended and actual vocal output may be disrupted. In addi- increasing or decreasing altered feedback across numerous
tion, individual responses were qualitatively different between trials either pre or post “hold” phase are included. Impor-
groups. Whereas all control participants showed compensa- tantly, speech adaptation procedures (whether auditory or
tion to altered feedback, IWPD displayed highly variable somatosensory) involve examination of learning aftereffects,
responses, including following responses to AIF (i.e., same such that the altered feedforward motor commands resulting
direction as the altered feedback). from the altered feedback conditions are apparent following
The AIF paradigm in the current study involves con- the removal of altered feedback (Barbier et al., 2020; Baum
tinuous alteration in feedback over the duration of multiple & McFarland, 1997; Houde & Jordan, 1998; Shiller et al.,
utterances involving many types of speech tasks, including 2009; Villacorta et al., 2007). The current study did not
conversational speech. It is similar to what could be termed examine potential aftereffects of AIF, and instead, the ana-
the continuous altered auditory feedback paradigms that are lyzed speech samples were selected from the midsections of
used in studies of delayed auditory feedback or studies of vowel and utterance productions. This is a potential limita-
the Lombard response. These continuous altered auditory tion of the current study and presents an opportunity for
feedback procedures all involve a presumed adaptation to future research to examine the dynamic adaptation pro-
the altered feedback, but the paradigms are not referred to cesses that may be occurring in the AIF paradigm.
as adaptation studies. Previous auditory–speech adaptation
studies have found reduced adaptation to first formant alter-
ations in IWPD (Mollaei et al., 2013, 2016). The AIF para- Speech Tasks
digm contrasts with perturbations, which occur at a discrete Previous research suggests that IWPD produce in-
point in a word or vowel production of these studies; how- creased speech intensity during speech tasks that do not have
ever, a study by Abur et al. (2018) extended the altered clear communicative goals, such as vowel phonation, syllable
Senthinathan et al.: Altered Intensity Feedback and Parkinson’s Disease 2269
Downloaded from: https://pubs.asha.org University of Western Ontario on 07/09/2021, Terms of Use: https://pubs.asha.org/pubs/rights_and_permissionsFigure 6. (a) Average slope values for all tasks completed in no background noise in the Parkinson’s disease (PD)
and control groups. (b) Average slope values for all tasks completed in 65-dB background noise in the PD and control
groups. AIF = altered intensity feedback.
repetition, and sentence reading compared to monologue responses to the AIF (in comparison to the conversation
tasks (Fox & Ramig, 1997; Ramig & Dromey, 1996; Ramig task) are expected in the reading task (presumably less de-
et al., 1996). In addition, unlike control participants who manding of attentional resources). It is important to note,
increase their speech intensity when speaking in conver- however, that responses to the AIF by the PD group in
sation, IWPD display a greater reduction in speech intensity conversation (far distance) and the reading task were simi-
during conversational tasks (Ho et al., 1999; Winkworth lar in the current study (see Table 5). Thus, alternative ex-
et al., 1994). In the context of the AIF paradigm, the PD planations for the more apparent reduced response by the
group produced reduced compensations to the altered PD group in the conversation tasks are warranted.
feedback, specifically in the context of having a conver- A communicative goal hypothesis is suggested as a
sation. Adams and Dykstra (2009) hypothesized that the novel description of this phenomenon. The increased com-
compounded attentional demands associated with a con- municative goals or demands associated with the conversa-
versation task may have an impact on speech intensity regu- tion task provide a possible explanation. Perhaps speakers
lation. Based on this hypothesis, if increased attentional engage in different feedback processes or place increased
demands are forcing the PD group to produce reduced priority on auditory feedback of their own voice when en-
compensations in the conversation task, then increased gaged in speech tasks requiring clear communicative goals
2270 Journal of Speech, Language, and Hearing Research • Vol. 64 • 2261–2275 • June 2021
Downloaded from: https://pubs.asha.org University of Western Ontario on 07/09/2021, Terms of Use: https://pubs.asha.org/pubs/rights_and_permissionsTable 7. Slope post hoc tests related to the three-way interaction involving Group × Task by noise condition.
No Noise 65-dB noise
No–65 dB noise (PD) vs.
PD HC PD HC no–65-dB noise
(HC) difference
Mean Mean Mean Mean 3-way post hoc
Task difference difference difference difference Mean difference
difference (SD) (SD) (SD) (SD) (SD) t p
ConN–ConF −.01 .03 .03 −.04 −.11 −3.65 < .001*
(.05) (.07) (.08) (.08) (.03)
ConN–Vowel .05 −.02 .11 −.05 −.09 −2.68 .010
(.07) (.09) (.11) (.09) (.03)
ConN–Read −.02 −.08 .06 −.13 −.128 −4.47 < .001*
(.05) (.07) (.07) (.06) (.03)
ConF–Vowel .06 −.05 .08 −.01 .02 .437 .664
(.09) (.08) (.12) (.08) (.03)
ConF–Read −.02 −.11 .03 −.09 −.02 −.709 .482
(.06) (.08) (.09) (.07) (.03)
Vowel–Read −.07 −.07 −.05 −.08 −.04 −1.58 .120
(.07) (.06) (.07) (.06) (.02)
Note. Mean and standard deviation/standard error values for the slope difference scores are shown for the task differences, Group × Task
differences, and Group × Task × Noise differences. Significance was based on a Bonferroni correction for six comparisons (p < .05/6 = .008).
PD = Parkinson’s disease; HC = healthy control; ConvoN = conversation (near); ConvoF = conversation (far).
*Significant at p < .008 (.05/6 comparisons).
and greater communicative demands. It is possible that, in with PD and control participants). IWPD-related hypo-
PD, either this increased priority is not engaged for cogni- phonia have been shown in previous studies to display an
tive reasons, or feedback monitoring processes for motor “overall gain reduction” for speech intensity and a gradu-
execution are either not appropriately initiated or excessively ally decreasing signal-to-noise ratio with increasing back-
inhibited. Previous work suggests possible frontostriatal im- ground noise (Adams, Dykstra, et al., 2006; Ho et al., 1999).
pairment in IWPD based on dual-task studies (Ho et al., The abnormal response to AIF in the PD group appeared to
2002; Whitfield et al., 2019). Future studies are recommended be differently affected by the background noise, such that
that systematically manipulate attentional demands (e.g., although the PD group produced a flatter slope in the AIF
cognitively demanding dual tasks) and speech tasks with response than the controls in no noise, in the context of 65 dB
varying communicative intent to further elucidate the cur- SPL background noise, the group difference was emphasized
rent findings and explanations. (the PD group was observed to produce a much flatter slope
The current study expands on previous work by Ho of the AIF function compared to the control group). It ap-
et al. (1999), who found that IWPD failed to adjust their pears that when IWPD are speaking in a noisy environment,
intensity (during positive-direction AIF-level testing only) in a abnormal sensorimotor integration for speech intensity regu-
conversation task, and results from studies of altered feedback lation is more pronounced. Put differently, when the envi-
in reading and counting tasks, which found that participants ronmental condition requires a change in speech intensity,
with PD respond similarly to controls (Coutinho et al., 2009; the range of available speech intensity or the intensity capac-
Ho et al., 1999). Although the current study found reduced ity is not appropriately engaged.
compensations by the PD group in the conversation tasks, Although auditory-related dysfunction has been ob-
adjusting the interlocutor distance did not appear to impact
served in PD and may be caused by loss of dopaminergic
this group difference. Thus, the PD group did not display
neurons in the basal ganglia and subsequent projections to
an overt deficit in distance judgment as it pertained to con-
the inferior colliculus, medial geniculate nucleus, and tem-
versing with a listener. Rather, the PD group displayed
poral cortex (Lukhanina et al., 2009), the Lombard effect
an overall disruption in the regulation of speech intensity
and abnormal use of altered auditory feedback in both con- has been demonstrated in a wide range of nonhuman ani-
versation tasks. mals, and evidence suggests that the primary neural mech-
anisms for this response are subcortical (for a review, see
Luo et al., 2018). However, other studies have demonstrated
Background Noise that humans have a certain degree of control over the re-
Consistent with previous studies (Adams, Dykstra, et al., sponse, and therefore, a volitional neural network is also
2006; Garnier et al., 2010; Ho et al., 1999; Lane & Tranel, proposed (Luo et al., 2018; R. Patel & Schell, 2008). Addi-
1971; Pick et al., 1989), the presentation of background noise tionally, results from the current study suggest that the
was found to elicit an increase in speech intensity (i.e., background noise effect was even more pronounced during
Lombard response) in both experimental groups (participants the conversation at a near distance speech task. Thus, it is
Senthinathan et al.: Altered Intensity Feedback and Parkinson’s Disease 2271
Downloaded from: https://pubs.asha.org University of Western Ontario on 07/09/2021, Terms of Use: https://pubs.asha.org/pubs/rights_and_permissionspossible that the group differences in background noise may Adams, S. G., Haralabous, O., Dykstra, A., Abrams, K., & Jog, M.
be related to the reduced ability of the PD group to appropri- (2005). Effects of multi-talker background noise on the intensity
ately engage mechanisms in tasks with clear communicative of spoken sentences in Parkinson’s disease. Canadian Acous-
tics, 33(3), 94–95. https://jcaa.caa-aca.ca/index.php/jcaa/article/
goals. In the control group, the background noise may be
view/1761
eliciting a feedback monitoring process that is distinct from Andreeta, M., Adams, S. G., Dykstra, A. D., & Jog, M. (2016).
that used in the no-noise condition due to the fact that speech Evaluation of speech amplification devices in Parkinson’s dis-
intelligibility is at risk of being compromised in noise—a ease. American Journal of Speech-Language Pathology, 25(1),
communicative goal hypothesis, as it relates to the Lombard 29–45. https://doi.org/10.1044/2015_AJSLP-15-0008
response. Previous studies have considered this as a possible Barbier, G., Baum, S. R., Ménard, L., & Shiller, D. M. (2020).
explanation for the Lombard effect, such that this reflex is Sensorimotor adaptation across the speech production work-
engaged so as to mediate reduced speech intelligibility and space in response to a palatal perturbation. The Journal of the
maintain clarity of speech when communicating (R. Patel Acoustical Society of America, 147(2), 1163. https://doi.org/
10.1121/10.0000672
& Schell, 2008).
Bauer, J. J., Mittal, J., Larson, C. R., & Hain, T. C. (2006). Vocal
responses to unanticipated perturbations in voice loudness
feedback: An automatic mechanism for stabilizing voice ampli-
Summary of Discussion tude. The Journal of the Acoustical Society of America, 119(4),
The current study contributes to our understanding 2363–2371. https://doi.org/10.1121/1.2173513
of hypophonia in PD and advances our specific understanding Baum, S. R., & McFarland, D. H. (1997). The development of
of the role of auditory perception in PD-related hypophonia. speech adaptation to an artificial palate. The Journal of the
IWPD were observed to produce a reduced or flatter AIF Acoustical Society of America, 102(4), 2353–2359. https://doi.
org/10.1121/1.419619
response compared to the neurologically healthy control
Bays, P. M., Wolpert, D. M., & Flanagan, J. R. (2005). Percep-
participants in this study. Results suggest that IWPD are tion of the consequences of self-action is temporally tuned and
unable to appropriately integrate the auditory information event driven. Current Biology, 15(12), 1125–1128. https://doi.
of their speech for the production of intended intensity levels org/10.1016/j.cub.2005.05.023
(feedforward processes). These findings were especially ap- Boersma, P., & Weenink, D. (2011). Praat: Doing phonetics by
parent in contexts with naturalistic communication demands computer (Version 5.2.26.) [Computer program]. http://www.
and speaking conditions. The current study results suggest praat.org/
the importance of communication and social considerations Brajot, F., Shiller, D. M., & Gracco, V. L. (2016). Autophonic
in theoretical models of speech motor control. loudness perception in Parkinson’s disease. The Journal of the
Acoustical Society of America, 139(3), 1364–1371. https://doi.
org/10.1121/1.4944569
Acknowledgments Bronstein, A. M., Hood, J. D., & Gresty, M. A. (1990). Visual
control of balance in cerebellar and Parkinsonian syndromes.
This work was supported by a Graduate Student Research Brain, 113(3), 767–779. https://doi.org/10.1093/brain/113.3.767
Award (No. 2017-1098) from Parkinson Canada, awarded to the Brown, A., & Docherty, G. J. (1995). Phonetic variation in dys-
first author (A. S.). arthric speech as a function of sampling task. European Jour-
nal of Disorders of Communication, 30(1), 17–35. https://doi.
org/10.3109/13682829509031320
References Burnett, T. A., Freedland, M. B., Larson, C. R., & Hain, T. C.
Abeyesekera, A., Adams, S., Mancinelli, C., Knowles, T., Gilmore, G., (1998). Voice F0 responses to manipulations in pitch feed-
Delrobaei, M., & Jog, M. (2019). Effects of deep brain stimulation back. The Journal of the Acoustical Society of America, 103(6),
of the subthalamic nucleus settings on voice quality, intensity, and 3153–3161. https://doi.org/10.1121/1.423073
prosody in Parkinson’s disease: Preliminary evidence for speech Chen, X., Zhu, X., Wang, E. Q., Chen, L., Li, W., Chen, Z., &
optimization. Canadian Journal of Neurological Sciences, 46(3), Liu, H. (2013). Sensorimotor control of vocal pitch production
287–294. https://doi.org/10.1017/cjn.2019.16 in Parkinson’s disease. Brain Research, 1527, 99–107. https://
Abur, D., Lester-Smith, R. A., Daliri, A., Lupiani, A. A., Guenther, doi.org/10.1016/j.brainres.2013.06.030
F. H., & Stepp, C. E. (2018). Sensorimotor adaptation of voice Coutinho, S. B., Oliveira, G., & Behlau, M. (2009). Voice and
fundamental frequency in Parkinson’s disease. PLOS ONE, speech of individuals with Parkinson’s disease during ampli-
13(1), 1–21. https://doi.org/10.1371/journal.pone.0191839 fication, delay and masking situations. Pró-Fono Revista de
Adams, S. G., & Dykstra, A. (2009). Hypokinetic dysarthria. In Atualização Científica, 21(3), 219–224. https://doi.org/10.1590/
M. R. McNeil (Ed.), Clinical management of sensorimotor S0104-56872009000300007
speech disorders (2nd ed., pp. 166–186). Thieme. Darley, F. L., Aronson, A. E., & Brown, J. R. (1969). Differential
Adams, S. G., Dykstra, A., Abrams, K., Winnell, J., Jenkins, M., diagnostic patterns of dysarthria. Journal of Speech and Hear-
& Jog, M. (2006). Conversational speech intensity under dif- ing Research, 12(2), 246–269. https://doi.org/10.1044/jshr.
ferent noise conditions in hypophonia and Parkinson’s disease. 1202.246
Canadian Acoustics, 34(3), 96–97. https://jcaa.caa-aca.ca/index. Duffy, J. R. (2013). Motor speech disorders: Substrates, differential
php/jcaa/article/view/1839 diagnosis, and management. Elsevier.
Adams, S. G., Dykstra, A. D., Jenkins, M., & Jog, M. (2008). Dykstra, A. D., Adams, S. G., & Jog, M. (2012). The effect of
Speech-to-noise levels and conversational intelligibility in hypo- background noise on the speech intensity of individuals with
phonia and Parkinson’s disease. Journal of Medical Speech- hypophonia associated with Parkinson’s disease. Journal of
Language Pathology, 16(4), 165–172. Medical Speech-Language Pathology, 20(3), 19–30.
2272 Journal of Speech, Language, and Hearing Research • Vol. 64 • 2261–2275 • June 2021
Downloaded from: https://pubs.asha.org University of Western Ontario on 07/09/2021, Terms of Use: https://pubs.asha.org/pubs/rights_and_permissionsYou can also read