OLIVE GARDEN - Mountain West Commercial Real Estate
←
→
Page content transcription
If your browser does not render page correctly, please read the page content below
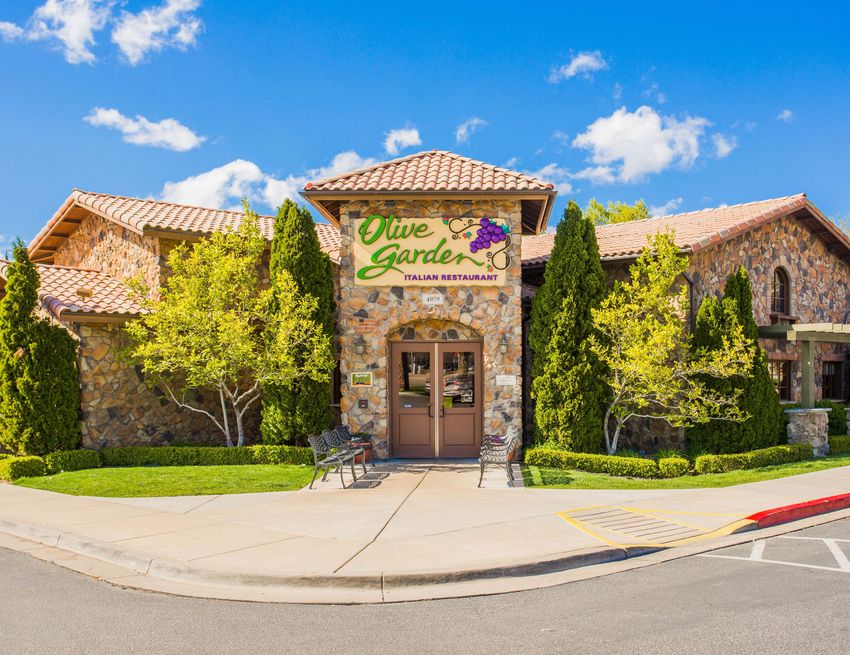
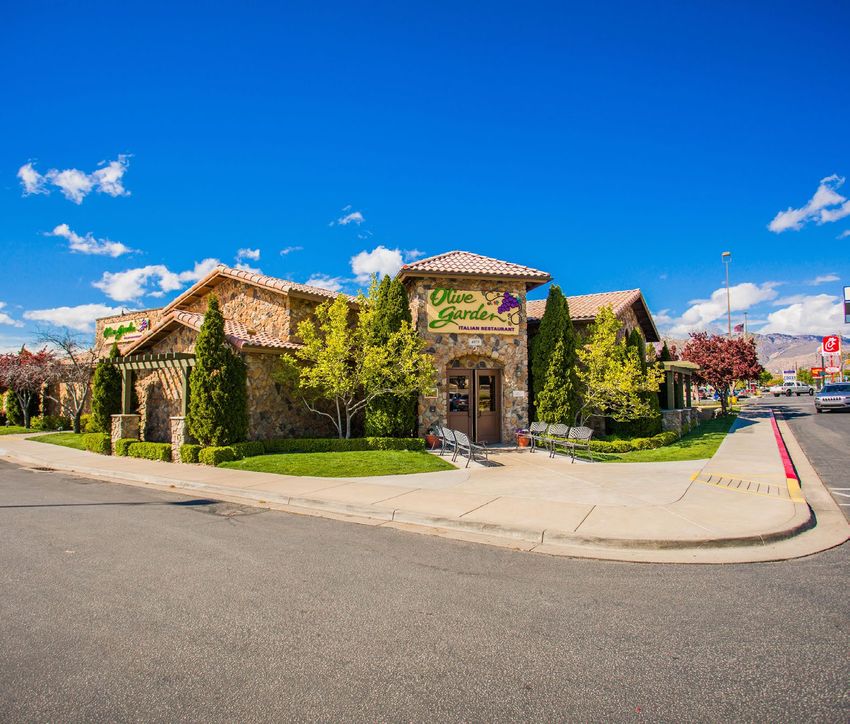
OLIVE GARDEN
4079 RIVERDALE ROAD     BEN BROWN             BRANDON GOODMAN        JOE COOLEY
RIVERDALE, UTAH 84405   bbrown@mtnwest.com    bgoodman@mtnwest.com   jcooley@mtnwest.com
                        direct 801.456.8802   direct 801.746.4708    direct 801.456.8803
                        View Profile          View Profile           View Profile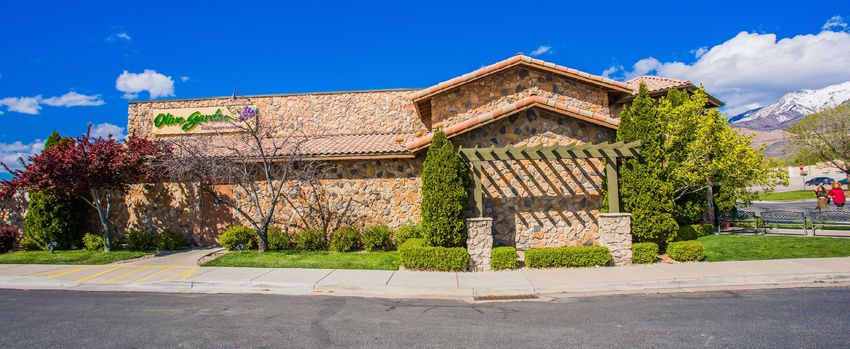
TABLE OF CONTENTS

 4   EXECUTIVE
     SUMMARY     6   PROPERTY FEATURES AND
                     LAND OVERVIEW
                                             8   MAPS
                                                        10   TENANT AERIAL
                                                             AND IMAGES
                                                                             16   TENANT
                                                                                  PROFILE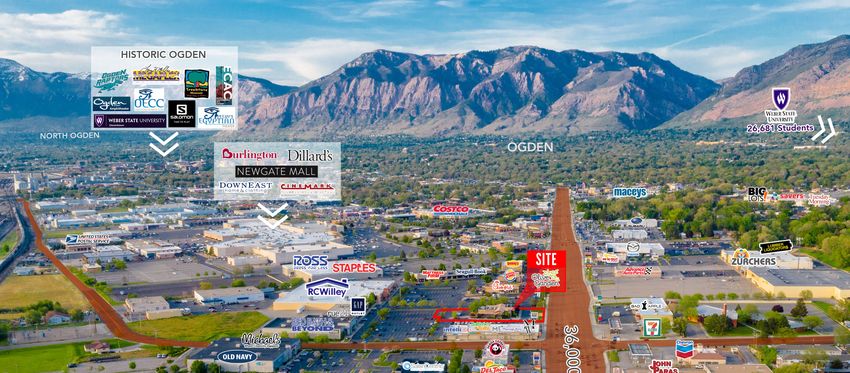
OLIVE GARDEN

                        CONFIDENTIALITY
OLIVE GARDEN            AND DISCLOSURE
4079 RIVERDALE ROAD     Mountain West Commercial Real Estate has been retained on an exclusive basis to market the property
RIVERDALE, UTAH 84405   described as 4079 Riverdale Road, Riverdale, UT 84405. Broker has been authorized by seller of the
                        property to prepare and distribute the enclosed information for the purpose of soliciting offers to
                        purchase from interested parties. More detailed financial, title and tenant lease information may be
                        made available upon request following the mutual execution of a letter of intent or contract to purchase
PREPARED BY             between the Seller and the prospective purchaser. You are invited to review this opportunity and
                        make an offer to purchase based upon your analysis. If your offer results in the Seller choosing to open
BEN BROWN               negotiations with you, you will be asked to provide financial references. The eventual purchaser will be
bbrown@mtnwest.com      chosen based upon an assessment of price, terms, ability to close the transaction and such other matters
direct 801.456.8802
View Profile            as the Seller deems appropriate.
                        The Material is intended solely for the purpose of soliciting expressions of interest from qualified
BRANDON GOODMAN         investors for the acquisition of the Property. The Material is not to be copied and /or used for any other
bgoodman@mtnwest.com    purpose or made available to any other person without the express written consent of Broker or Seller.
direct 801.746.4708     The Material does not purport to be all-inclusive or to contain all of the information that a prospective
View Profile
                        buyer may require. The information contained in the material has been obtained from the Seller and
JOE COOLEY
                        other sources and has not been verified by the Seller or its affiliates, agents, representatives, employees,
jcooley@mtnwest.com     parents, subsidiaries, members, managers, partners, shareholders, directors, or officers, makes any
direct 801.456.8803     representation or warranty regarding such pro forma. Purchaser must make its own investigation of the
View Profile            Property and any existing or available financing, and must independently confirm the accuracy of the
                        projections contained in the pro forma.

                        Seller reserves the right, for any reason, to withdraw the Property from the Market. Seller has no
                        obligation, express or implied, to accept any offer. Further, Seller has no obligation to sell the Property
                        unless and until the Seller executes and delivers a signed agreement of purchase and sale on terms
                        acceptable to the Seller, in its sole discretion. By submitting an offer, a purchaser will be deemed to
                        have acknowledged the foregoing and agreed to release Seller and Broker from any liability with respect
                        thereto.

                        Property walk-throughs are to be conducted by appointment only. Contact Broker for additional
                        information.

                                                             312 East South Temple l Salt Lake City, UT 84111 l Office 801.456.8800 l www.mtnwest.com   3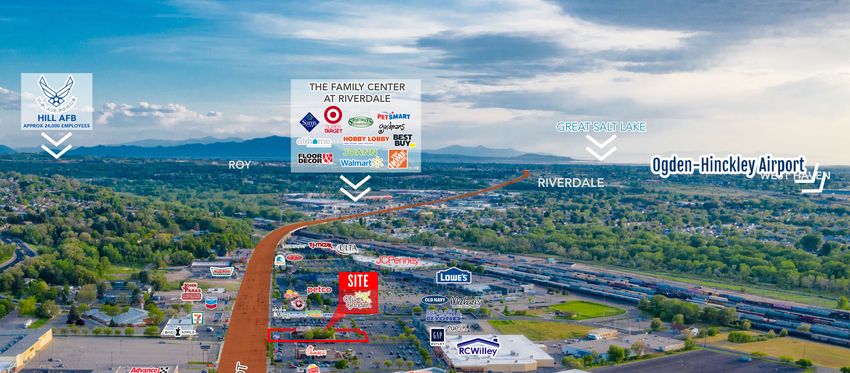
EXECUTIVE SUMMARY INVESTMENT HIGHLIGHTS
PRICING
LONG TERM GROUND LEASE
PURCHASE PRICE $1,301,000
Olive Garden has been at this site since 2003 and has approximately 9 years remaining on their
NET OPERATING INCOME $52,073 initial 25 year ground lease.
CAP RATE 4.00% CORPORATE GUARANTOR
The lease is guaranteed by Darden Restaurants, Inc (NYSE: DRI), with over 1,600 locations and 8
LEASE INFORMATION brands that include: Olive Garden, Longhorn Steakhouse, Cheddar’s Scratch Kitchen, Yard House,
TENANT TRADE NAME Olive Garden The Capital Grille, Seasons 72, Bahama Breeze, and Eddie V’s.
GMRI, Inc., a Florida HIGH TRAFFIC COUNTS
LEASE GUARANTOR
Corporation The subject property is located on one of the busiest streets in Utah called Riverdale Road with
LEASE DATE 11/21/2001 36,000 AADT (2017).
RENT COMMENCEMENT 2/17/2003 GOOD DEMOGRAPHICS
There are 87,020 people within the 3-mile radius, with an average HH income of $52,108 within
LEASE EXPIRATION 2/29/2028 the same range. Riverdale is working on plans to add hundreds of new single-family homes, town
LEASE TYPE Ground Lease homes, and apartment units over the next few years.
STRONG RETAIL TRADE AREA
LEASE TERM 10 Years
Riverdale is arguably the best retail corridor in both Weber & Davis Counties. Riverdale Road
EXTENSION OPTIONS Two, 5-Year Options extends from I-15 to Hwy 89 and is approximately 4 miles long, and includes some of the largest
retailers including, but not limited to: Walmart, Sam’s Club, Target, At Home, Sears, RCWilley, Best
PROPERTY TAXES Tenant Responsible
Buy, Ross, Staples, Home Depot, Lowes, Sportsman’s Warehouse, TJMaxx, JCPenney, Costco, etc.
INSURANCE Tenant Responsible
UTILITES Tenant Responsible
MAINTENANCE Tenant Responsible
PROPERTY INFORMATION RENT ESCALATIONS & OPTIONS
4079 Riverdale Road, LEASE TERM START EXPIRATION MONTHLY RENT ANNUAL RENT LESS: PARKING RENT NOI
PROPERTY ADDRESS EXPIRATION % RENT
Riverdale, UT 84405 LEASE
Initial TermTERM START
3/1/2018DATE 2/28/2023 $ MONTHLY
4,339.43 $ RENT ANNUAL
83,057.16 RENT
($30,984.00) $ 52,073.16
Initial Term 3/1/2023 DATE $
2/29/2028 4,762.83 $ 91,362.84 ($34,208.84) INCREASE
$ 57,154.00
BUILDING SIZE (SF) 7,500 Option
Initial1 Term 3/1/2028
2/17/2003 2/28/2033
2/28/2028$ 5,227.49
$5,208$ 100,499.16 $62,500
($37,769.32) $ 0.00%
62,729.84
Option 2 3/1/2033 2/28/2038 $ 5,737.39 $ 110,549.04 ($41,700.38) $ 68,848.66
GROSS LEASABLE AREA (SF) 25,000 Initial Term 3/1/2008 2/28/2013 $5,859 $70,313 12.50%
LAND SIZE (AC) 0.57 Initial
*The Term has a ground
property 3/1/2013 lease for2/28/2018 $6,592
a portion of the parking $79,102
lot with the adjacent 12.50%
strip center to the South.
The current ground rent is $30,984 thru 1/1/2023 with and increase on 3/1/2023 with two; five (5) year options.
Initial Term 3/1/2018 2/28/2023 $6,921 $83,057 5.00%
YEAR BUILT 2002 The rent increases based on the consumer price index (CPI), so we are assuming a 2.00% annual increase on
Initial
the Term
ground rent ever 3/1/2023
five (5) years. 2/29/2028 $7,614 $91,363 10.00%
Option 1 3/1/2028 2/28/2033 $8,375 $100,499 10.00%
Option 2 3/1/2033 2/28/2038 $9,212 $110,549 10.00%
OLIVE GARDEN
4 312 East South Temple l Salt Lake City, UT 84111 l Office 801.456.8800 l www.mtnwest.com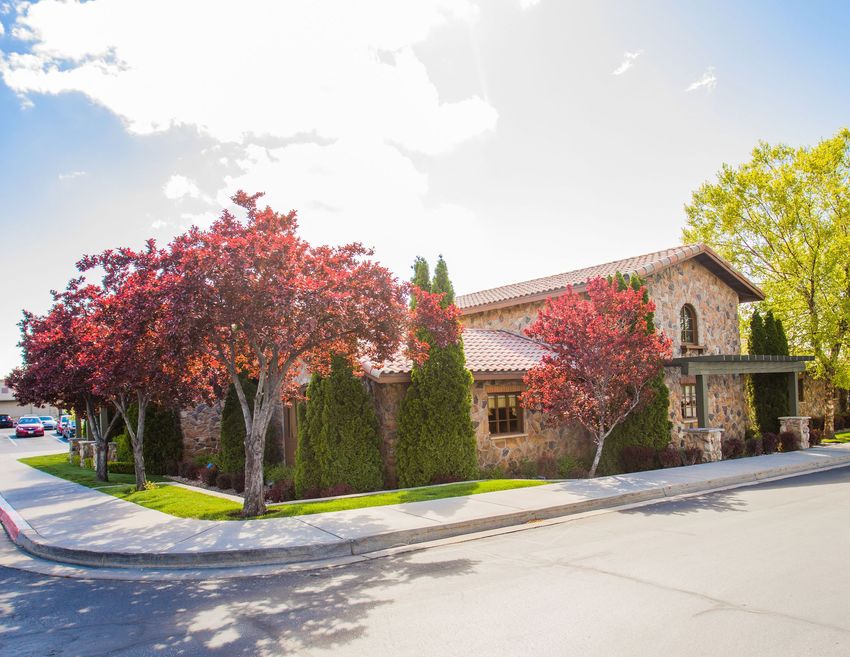
OLIVE GARDEN

AREA OVERVIEW

UTAH
WEBER STATE UNIVERSITY                                  PROXIMITY TO HILL AIR FORCE BASE                               OGDEN HINKLEY AIRPORT
The subject property is located within 2.4 miles        Hill Air Force Base is the 6th largest employer                Ogden-Hinckley Airport (OGD) is a municipal airport
of Weber State University, with an enrollment of        in Utah, excluding the state government and                    with commercial flights, general aviation service, and
26,681 students and 820 administrative staff. Weber     higher education employers. There are 27,365                   affordable, high-quality space for other aviation and
State University offers more than 250 certificate and   total personnel within Hill Air Force Base, includ-            aerospace uses. Ogden-Hinckley Airport hosts oper-
degree programs in the performing arts, visual arts,    ing 5,636 military, 5,591 military dependents and              ations for several aerospace and defense companies,
humanities, science, a pplied science and technol-      16,138 civilians. Hill Air Force Base has an annual            including Northrop Grumman, Williams International,
ogy, business and economics, education, social and      federal payroll of $1.34 billion, and annual expen-            and Boresight. Ogden is home to a growing aerospace
behavioral sciences, and the health professions.        ditures of $710 million. Annually, Hill Air Force              and advanced manufacturing cluster, and our airport
Master’s degrees are offered in accounting, athletic    Base creates approximately $1.29 billion in jobs               shares airspace with nearby Hill Air Force Base. Existing
training, business administration (MBA), profession-    created with a total of $3.34 billion in total annual          hangars and build-to-suit options at the Kemp Ogden
al communication, computer engineering, criminal        economic impact.                                               Gateway Center make Ogden-Hinckley Airport an ideal
justice, education, English, radiologic sciences,                                                                      location for aviation and aerospace companies.
health administration, nursing, and taxation.

NEAR MAJOR SKI RESORT
Riverdale is 24-miles away from the famous Snow-
basin Resort. The resort opened back in 1939 as
part of an effort by the city of Ogden to restore the
Wheeler Creek watershed and is one of the old-
est continually operating ski resorts in the United
States. During the 2002 Winter Olympics, Snowba-
sin hosted the downhill, combined (downhill and
slalom), and super-G events.

                                                                                               312 East South Temple l Salt Lake City, UT 84111 l Office 801.456.8800 l www.mtnwest.com   5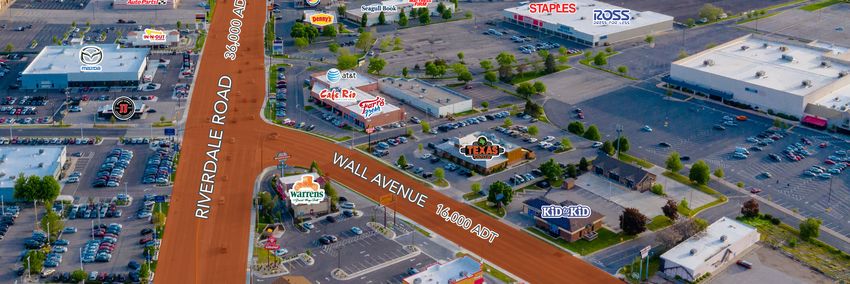
PROPERTY FEATURES &
LAND OVERVIEW
                                                                                                                                                                   PROPERTY DESCRIPTION

                                                                                                                                                                  Location:                             Frontage & Access:
                                                                                                                                                                  4079 Riverdale Road                   The subject property has
                                                                                                                                                                  Ogden, Utah 84405                     approximately 150 feet of frontage
                                                                                                                                                                  Site:                                 along Riverdale Road. The shared
                                                                                                                                                                  Located on the northwest side         access points to the subject property
                                                                                                                                                                  of Riverdale Road, north of the       are three (3) along Riverdale Road
                                                                                                                                                                  intersection of Riverdale Road and    and one (1) along 300 West.
                                                                                                                                                                  300 West.                             Traffic Counts 2016:
                                                                                                                                                                  Land Area:                            Riverdale Road - 36,000 AADT
                                                                                                                                                                  Consists of 0.57 Acres or 25,000 SF   Year Built:
                                                                                                                                                                  of land area.                         2002
                                                                                                                                                                  Building Area:                        Zoning:
                                                                                                                                                                  The subject property consists         CP-3
                                                                             RD                                                                                   of 1 retail building totaling
                                                                                                                                                                  approximately 7,500 SF of gross
                                           Approx
                                                                              E

                                                                                                                                                                  leasable area.
                                                                            AL

                                           0.89 AC
                                                                        RD
                                                                       VE
                                                                       RI

                                                                                                                                                                   LAND OVERVIEW

                         30                                                                                                                                       APN #           ADDRESS                    ACRES           SF
                            0
                                W
                                                                                                                                                                   060310025            4079 Riverdale Rd    0.57 Acres      25,000
                                          T
                                        AD
                                      00
                                      ,0
                                    36

                                                16
                                                   ,0
                                                      0   0
                                                              AD
                                                                   T

                                                                                    F:\Projects\SL\Brown\Riverdale\OliveGardenPkg\Parcel.mxd - 7/19/2019 lplant

     OLIVE GARDEN
 6   312 East South Temple l Salt Lake City, UT 84111 l Office 801.456.8800 l www.mtnwest.com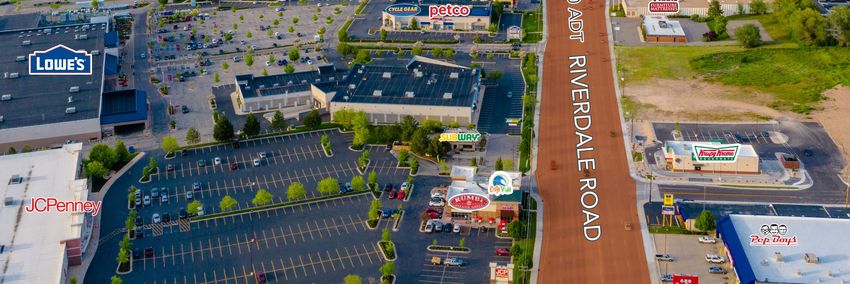
OLIVE GARDEN

SITE PLAN

            Riverdale Road   36,000 ADT

                                312 East South Temple l Salt Lake City, UT 84111 l Office 801.456.8800 l www.mtnwest.com   7
FACING NORTH
FACING SOUTHWEST

TT MAP
2 5S
REEVES A
31
T
AD
11,0
00
ST
HEALY
T
AD
9,000
T
AD
00
26,0
S
3175
KIESEL AVE
EB
31ST S T 65 S
32ND ST
D AV E
4,100 ADT
31ST ST 32
OGDEN AVE
RO A
PINGREE AVE
STEPHENS AVE
CHILDS AVE
RAIL
DR
KER GODDARD ST
P AR
28,000 ADT
ODYSSEY SCHOOL
571 STUDENTS
33RD ST
35,000 ADT
2,400 ADT
GRANT AVE
WALL AVE
34TH ST
LINCOLN AVE 1,700 ADT
FRANKLIN ST
WASH INGTON BLVD 26,000 ADT
RD
35TH ST
E
AL
RD
LINCOLN PLACE
VE
40,000 SF
(
HARRIS ST
RI
LINCOLN PLACE
T
AD
20,000 SF
(
770 ADT
00
,0
10
36TH ST 11,000 ADT 36TH ST 18,000 ADT
16,000 ADT
PACIFIC AVE
+
,
89
OGDEN AVE
16,000 ADT
37TH ST
250 W
KIESEL AVE
TT MAP
VI E W CIR
11,000 A VILLA SOUTH
State D APARTMENTS
Liquore 120 UNITS
T
Store
ES
38TH ST
IM
T
AD
CH
R
IA D
00
,0
LV
13
SY
CHILDS AVE
ADAMS AVE
RD
40 39TH ST
TH CH
IM
E
ST
AL
ES
RD
VI
EW
VE
DR
RI
26,000 ADT 19,000 ADT
G RE N
29,000 ADT
SITE
HI L
O
W
PALMER DR
OD
COUNTRY CLUB DR
C IR
LCR
ST
E
CI
R
WASH INGTON BLVD
YALE DR
16
,0
0 0
AD
T
GIBBS CIR
0 S
GREENHILL AT 415
RIVERDALE
2,600 ADT
30 0 W
104 UNITS
50
0
W
42ND ST
55
0
W
T
D
A
0 0
S
0S 0
,0
0 435
36
250
43
OA K DR
TENANT AERIAL
D Y
E
375 E
R CHERR DR
DT
225
LE 00 A
325 E
A 6, 1
S
E
D 440
0
ER
175
V 4425 S
RI
300 E
150
0W
24,274 SF
100
E
125
200
W
(
E
60
250
5
27
W
W
W
DD R 4450 S
HIGHL AN
W2020 UTAH OUTLOOK “The Utah economy continues to prosper. Like the nation, the state’s decade- long economic expansion became the longest on record in 2019. Every major industrial sector expanded over the last year, adding 45,600 new jobs to the economy. The annual employment growth rate of 3.0 percent in 2019 was at the state’s long-term average and among the strongest in the nation. Fueled by record-level residential and near-record commercial activity, Utah’s construction sector added 4,500 jobs and posted the state’s fastest pace of job growth in 2019, 4.3 percent. The boom in the multifamily sector, primarily apartment construction, drove a 10.9 percent increase in the value of all permit-authorized residential construction to $5.7 billion. The value of permitauthorized nonresidential construction grew 6.2 percent in 2019 to $2.3 billion, the highest posting since 2016’s $2.7 billion. Low unemployment and rising wages for Utahns, along with an increase in travel and tourism activity, supported strong job growth of 4.1 percent in the state’s leisure and hospitality sector over the past year. Above-average snowfall and an extended 2018-2019 ski season led to a record $1.4 billion in skier spending. With increased marketing emphasis on places to visit in addition to the Mighty 5® national parks, Utah’s state parks hosted a record number of visitors in 2019. Utah’s population grew by 53,600 to reach 3.2 million in 2019. About 47 percent of this growth came from net in-migration as people moved to the state to take advantage of economic opportunity. Natural increase continued to generate the majority of growth, 53 percent, despite births dropping to the lowest level since 2000. The consensus forecast predicts increasing uncertainty and moderation, but still healthy growth for the Utah economy. Internal risks in 2020 and beyond include a tight labor market, increasing costs, housing affordability, declining fertility rates, and air quality. Externally, a late U.S. business cycle, trade tensions, and geopolitical instability add risk to the forecast. State tax cuts and infrastructure spending present an upside risk for the 2020 Utah economy. Favorable demographics, a supportive business climate, and economic diversity will continue to advantage the economy. As long as major risks to the national expansion are not realized, Utah’s economy will once again be one of the top performing economies in the nation in 2020.” Source: 2020 Economic Report to the Governor by the Utah Economic Council UTAH ECONOMIC OUTLOOK
$4,000
$4,000
44
$2,000
$2,000
HACHMAN INDEX OF ECONOMIC DIVERSITY 22
$- $-
00
2000
2000
2001
2001
2002
2002
2003
2003
2004
2004
2005
2005
2006
2006
2007
2007
2008
2008
2009
2009
2010
2010
2011
2011
2012
2012
2013
2013
2014
2014
2015
2015
2016
2016
2017
2017
2018
2018
2019
2019
According to the Hachman Index, a measure of economic 2009 diversity,
2009 2010
2010 2011 Utah
2011 2012 and
2013 Missouri
2012 2013 2014
2014 2015 led2016
2015 the 2017
2016 nation
2017 2018in economic
2018 2019*
2019* diversity
in 2018 with scores of 97.1 and 96.8, respectively,*2019
based on gross domestic product by industry. A higher score,
skier days will be released in June 2020. Skier days include season that begins with
closer to
100, indicates more economic diversity. A timely year
example of the advantage of
shown (e.g. 2018 = 2018-2019 ski season).diversity is the impact of globalization and
tariffs on state economies. Those states with employment concentrations in auto, textiles, or steel production experienced
severe job losses. In contrast, Utah’s economic diversity provided added protection from the negative impacts of tariffs.
Hachman Index of Economic
Source: Diversity
2020 Economic Report
WA
to the Governor by 85.1
According to the Hachman Index, a
the Utah Economic Council MT OR
ME
ND 91.0
measure of economic diversity, Utah OR
OR
83.2 49.0 MN
MN
94.0
VT
V T 89.4
94.0
NH 94.5
94.5
and Missouri led the nation in economic 93.4
93.4 ID WI
82.3 WI NY MA89.4
MA 89.4
SD 91.5
diversity in 2018 with scores of 97.1 and WY 60.7 91.5
MI
MI
91.2
79.1 89.1
RI 89.1
32.0
96.8, respectively, based on gross domestic NE
IA
91.2 PA
PA CT
C T 91.0
91.0
75.8 95.7
95.7 NJ 93.8
product by industry. A higher score, closer NV
67.5 UT
UT
73.0 IL
IL IN
OH
OH
93.6
93.6
97.1 95.5
95.5 76.5 MD88.3
MD 88.3
to 100, indicates more economic diversity. 97.1 COCO
93.2 KS
WV
64.1 VA DE
DE56.0
56.0
CA
CA 93.2 KS MO
MO KY
A timely example of the advantage of 92.8
92.8
92.4
92.4 96.8
96.8 89.6
89.1 DC 48.9
NCNC
diversity is the impact of globalization AZ
AZ
TN 93.5
93.5
96.0 OK 92.1
92.1 SC
and tariffs on state economies. Those 96.0
NM 47.7 AR
88.1
SC
91.0
60.1 91.0
states with employment concentrations MS AL GA
GA
95.9
Hachman IndexScore
Hachman Index Score
86.3 90.6
AL 95.9 95.0
95.0 ++(Most
(MostDiverse)
Diverse)
in auto, textiles, or steel production TX 90.6 90.0-94.9
90.0 - 94.9
LA
73.6
experienced severe job losses. In contrast, 83.9 FL 85.0-89.9
85.0 - 89.9
AK 92.0
Utah’s economic diversity provided added 33.8 FL 75.0-84.9
75.0 - 84.9
92.0 < 75.0
75.0(Least
(Least Diverse)
Diverse)
protection from the negative impacts of
HI
HI
tariffs. 72.2
Note: All 2019 data is estimated.
UTAH RANKINGS
Sources: Kem C. Gardner Policy Institute; U.S. Bureau of Labor Statistics; U.S. Bureau of Economic Analysis; U.S. National Park Service; Ski Utah; Utah Economic Council; U.S. Census Bureau;
and Utah Population Committee.
Demographic State Rank3 Value Year Economic State Rank3 Value Period
Population Growth Rate 3rd 1.9% 2018 Employment Change1,2,4 2nd 2.7% Highlights
August -19 Annual
Total Fertility Rate 2nd 2.12 2017 Unemployment Rate1,2 8th 2.8% August -19
Life Expectancy 10th 80.2 2010 Median Household Income 7th $77,067 2018
Median Age 1st 31.0 2018 Per Capita Personal Income 41st $45,340 2018
Household Size 1st 3.13 2017 Total Personal Income (% Change) 14th 4.4% Q1-19 Annual
Social Indicators Notes:
1. Rankings are based on the most recent data available for all states; may
Poverty Rate 6th 9.7% 2017 differ from other data.
Educational Attainment 2. Job growth and unemployment rates are based on seasonally adjusted data
from the Bureau of Labor Statistics and may differ from estimates published
Persons 25+ w/high school degree 10th 92.1% 2017 by other sources.
Persons 25+ w/high school degree 12th 34.6% 2017 3. Rank is most favorable to least favorable.
4. Employment change based on nonfarm employment totals.
Source: 2019 September Economic Summary by the Kem C. Gardner Policy Institute at the University of Utah
312 East South Temple l Salt Lake City, UT 84111 l Office 801.456.8800 l www.mtnwest.com 13drove a 10.9 percent increase in the value of all permit-authorized
residential construction to $5.7 billion. The value of permit-
authorized nonresidential construction grew 6.2 percent in 2019 to
2019
$2.3 billion, JOB GROWTH
the highest posting since 2016’s $2.7 billion.
Low unemployment and rising wages for Utahns, along with an
increase
“Utah’s in travel
economy and tourism
continued activity,
to grow in supported
2019. While strong
national gains job
were growth
modest, Utah remained among
of 4.1 percent in the state’s leisure and hospitality sector over the double the national
the fastest-growing states. The state posted yearover-year job growth at 3.0%, near
increase of 1.6%. This corresponds to more than 45,600 jobs added to Utah’s economy. In 2019 the
past year. Above-average snowfall and an extended 2018-2019 ski
Economic Development Corporation of Utah and the Utah Governor’s Office of Economic Development
Nevada
Nevada 3.3%
3.3%
season
worked led to atorecord
together support$1.4 billion intoskier
42 companies spending.
relocate or expandWith increased
in Utah, adding over 9,500 jobs to the
marketing
state’s Utah emphasis
economy
Utah on places
and retaining to visit
over 3,500 in addition
additional to the
jobs. These Mighty
companies
3.0%
3.0% 5® capital investments in
made
Utah totaling more than $500 million.”
Arizona
Arizona
Nevada 2.6%
2.6% 3.3%
Source: 2020 Economic Report to the Governor by the Utah Economic Council
Florida
Florida
States with Strongest Job Growth, 2018–2019
Utah 2.5%
STATES WITH THE STRONGEST JOB GROWTH 2018-2019
2.5% 3.0%
Washington
Washington
Arizona 2.5%
2.5%
2.6%
Nevada 3.3%
Idaho
Idaho
Florida 2.4%
2.4%
2.5%
Utah 3.0%
Texas
Texas
Washington 2.5%
2.5%
2.5%
Arizona 2.6%
South
South
Dakota
Dakota
Idaho 2.1%
2.1% 2.4%
Florida 2.5%
U.S.
U.S.
Texas 1.6%
1.6% 2.5%
Washington 2.5%
South Dakota 2.1%
Idaho 2.4%
U.S. 1.6%
Texas 2.5%
South Dakota 2.1%
U.S. 1.6%
Government,
Government,16.2%
16.2% Mining,
Mining,0.6%
0.6%
Total Share
Services,
2.7% of Utah Jobs by Sector, 2019
2019 BUSINESS CLIMATE
Other
Other
Services, 2.7% Construction,
Construction,
7.0%
7.0%
Leisure
Leisure
&& Manufacturing,
Manufacturing,8.8%
8.8%
Government,
Hospitality,
Hospitality, 16.2%
9.9%
9.9% Mining, 0.6%
“Utah’s young,2.7%
Other Services, 2019
2019
educated workforce total
totalto grow, state Construction,
continues and local governments
7.0% remain fiscally
responsible and stable, and the cost of doing business remains lower than the national average.
Utah continues
job
jobcount:
count:
Leisureto& receive recognition as a leading global business destination,
Manufacturing, 8.8% enjoying accolades
Education
Education& Health
& Health
from national16.2%
Government,
Hospitality, 1.56
sources like Forbes,
9.9% 1.56 million
million
which Trade,
has ranked Utah theTrade,
#1 Trans.,
Trans.,
Best
Mining, State for Business in six of
0.6%
the
Services,
Services,
past
13.4%
13.4%
nine years 2019 total Utilities,
Utilities,
18.7%
18.7%
Other Services, 2.7% and second in 2018. In November, Forbes also named
Construction, Utah the Best State for
7.0%
Entrepreneurs in 2020. Utah also ranked job count:
fourth on CNBC’s “America’s Top States for Business 2019.”
Factors that
Education contribute
Leisure
& Health
Professional
Professional & to this ranking include the economy, Manufacturing,
high quality
Trans., of8.8%
life, business friendliness,
andHospitality,
quality
Services,infrastructure.”
9.9%
13.4%
& Business
& Business
1.56 million Trade,
Information,
Information, 2.5%
2.5%
Utilities, 18.7%
Services,
Services,
14.4%
14.4% 2019 total Financial
Financial
Activity,
Activity,
5.8%
5.8%
Source: 2020 Economic Report to the Governor by the Utah Economic Council
job count:
UTAH Professional
ECONOMIC
Education & Health OUTLOOK
& Business
Services, 13.4%
1.56 million Trade, Trans.,2.5%
Information, 14
Utilities, 18.7%
Services, 14.4% Financial Activity, 5.8%2019 TRENDS
Utah’s strategic industry clusters employed over 258,000 Utahns in 2019, up from 247,000
in 2018, demonstrating 4.2% growth. Utah’s industry clusters include aerospace and
defense, energy and natural resources, financial services, life sciences, outdoor products,
and software development and information technology. Utah-based companies raised
$998 million in venture capital in 2018. Strong investment activity continued in 2019, with
companies raising over $1.2 billion as of November 19th. Utah also saw nearly $9.3 billion
worth of mergers and acquisitions by November 19, 2019.
*Source: 2020 Economic Report to the Governor by the Utah Economic Council
UTAH EMPLOYMENT GROWTH, LEVEL AND
PERCENT 2018–2019
+45,600 jobs
Mining 200 (2.1%)
Construction 4,500 (4.3%)
Manufacturing 4.500 (3.4%)
Trade, Trans., Utilities 6,200 (2.2%)
Information 1,400 (3.6%)
Financial Activity 2,400 (2.8%)
Professional & Business Services 8,200 (3.8%)
Education & Health Services 6,100 (3%)
Leisure & Hospitality 6,100 (4.1%)
Other Services 1,100 (2.7%)
Government 4,900 (2%)
*Source: 2020 Economic Report to the Governor by the Utah Economic Council
312 East South Temple l Salt Lake City, UT 84111 l Office 801.456.8800 l www.mtnwest.com 15TENANT PROFILE
Olive Garden was founded in 1982 in Orlando, FL. Since then they have grown to 850+ locations,
96,000+ team members, and $4.1 billion in annual sales. They are part of Darden Restaurants, Inc.
family of restaurants, which includes Longhorn Steakhouse, Cheddar’s Scratch Kitchen, Yard House, The
Capital Grille, Seasons 52, Bahama Breeze, and Eddie V’s. Olive Garden cares about the communities
they are in and take action in times of need. They have donated 45 million pounds of surplus food
through their Harvest program, 30 million meals have been provided through the Feeding America
network of food banks, and 100% of their restaurants donate food on a weekly basis. This particular
Olive Garden Restaurant in Riverdale received a #3 rating out of 20 restaurants in Riverdale, UT on
TripAdvisor.
WEBSITE: EMPLOYEES:
www.olivegarden.com 850+
OWNERSHIP: HEADQUARTERS:
Pubic (NYSE: DRI) orlando, fl
Darden is a restaurant company featuring a portfolio of differentiated brands that include Olive
Garden, LongHorn Steakhouse, Cheddar’s Scratch Kitchen, Yard House, The Capital Grille, Seasons
52, Bahama Breeze and Eddie V’s. Our people equal our success, and we are proud to employ 165,000
team members in more than 1,600 restaurants. Together, we create memorable experiences for 380
million guests each year in communities across North America.
OLIVE GARDEN
16 312 East South Temple l Salt Lake City, UT 84111 l Office 801.456.8800 l www.mtnwest.comOLIVE GARDEN
DEMOGRAPHICS
POPULATION BUFFERS - 1, 3, 5 MILES
Farr West
Harrisville
1 MILE 3 MILES 5 MILES
11,246 87,020 171,965 Marriott-Slaterville
2018 EST. 2018 EST. 2018 EST.
POPULATION POPULATION POPULATION
5 Miles
1 MILE 3 MILES 5 MILES
11,720 91,742 182,054
2023 EST. 2023 EST. 2023 EST.
POPULATION POPULATION POPULATION
West Haven
Ogden 3 Miles
&
'
%
15
FRONTRUNN ER
1 Mile
+
,
89
HOUSEHOLDS & MEDIAN INCOME
1 MILE 3 MILES 5 MILES
^
^
Riverdale
3,822 31,393 59,611 Roy
2018 EST. 2018 EST. 2018 EST. Washington
Terrace
HOUSEHOLDS HOUSEHOLDS HOUSEHOLDS
South Ogden
Hooper
1 MILE 3 MILES 5 MILES &
'
%
84
$49,656 $52,108 $56,231 Uintah
Clinton Sunset
2018 EST. 2018 EST. 2018 EST.
South Weber
INCOME INCOME INCOME
West Point
Clearfield
Syracuse Layton
F:\Projects\SL\Brown\Riverdale\OliveGardenPkg\DemoRings.mxd - 5/15/2019 lplant
312 East South Temple l Salt Lake City, UT 84111 l Office 801.456.8800 l www.mtnwest.com 17PREPARED BY BEN BROWN bbrown@mtnwest.com direct 801.456.8802 View Profile BRANDON GOODMAN bgoodman@mtnwest.com direct 801.746.4708 View Profile JOE COOLEY jcooley@mtnwest.com direct 801.456.8803 View Profile 312 East South Temple l Salt Lake City, UT 84111 l Office 801.456.8800 l Fax 801.578.5500 l www.mtnwest.com
You can also read