OGS PROTOTYPE CODE DRIFTER EQUIPPED WITH CURRENT METER AND CURRENT PROFILER: REALIZATION AND TESTS
←
→
Page content transcription
If your browser does not render page correctly, please read the page content below
ISTITUTO NAZIONALE di Oceanografia e di Geofisica Sperimentale Trieste

Borgo Grotta Gigante, 14/11/11          Rel. OGS 2011/109 OGA 34 SIRE                            Page 1 of 65

OGS PROTOTYPE CODE DRIFTER EQUIPPED WITH CURRENT
METER AND CURRENT PROFILER: REALIZATION AND TESTS

                                  R. GERIN and P.-M. POULAIN

                                 Approved by: ……………………………
                                               Dr. Alessandro Crise

                                                                              Programme cofinanced by European
www.tosca-med.eu                                                              Regional Development Fund (ERDF)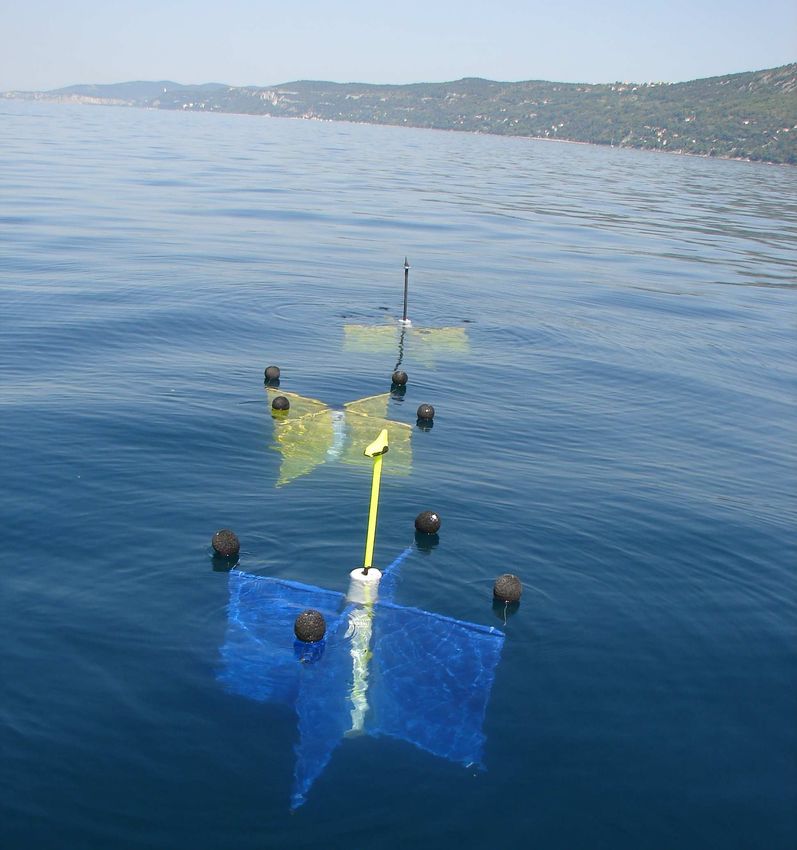
ISTITUTO NAZIONALE di Oceanografia e di Geofisica Sperimentale Trieste

Borgo Grotta Gigante, 14/11/11                         Rel. OGS 2011/109 OGA 34 SIRE                                                   Page 2 of 65

                                                                   INDICE:

                                                                                                                                                pag.
1.     Introduction..................................................................................................................................3
2.     Prototype drifter characteristics and realization...........................................................................3
3.     First test at sea..............................................................................................................................9
4.     Second test at sea .......................................................................................................................13
5.     Third test at sea ..........................................................................................................................19
Acknowledgments..............................................................................................................................23
Appendix A – first test plots ..............................................................................................................24
Appendix B – second test plots..........................................................................................................38
Appendix C – third test plots .............................................................................................................54
References ..........................................................................................................................................64

                                                                                                                 Programme cofinanced by European
www.tosca-med.eu                                                                                                  Regional Development Fund (ERDF)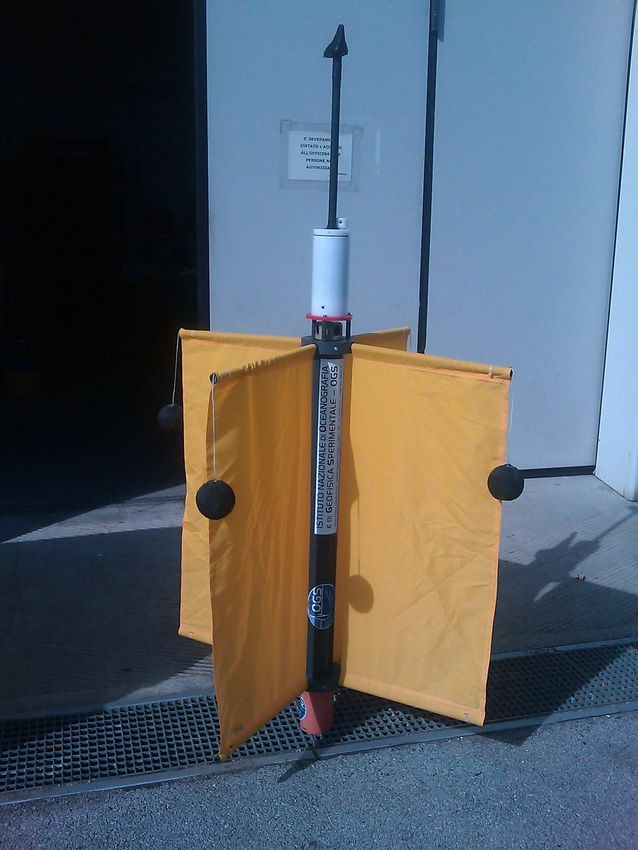
ISTITUTO NAZIONALE di Oceanografia e di Geofisica Sperimentale Trieste

Borgo Grotta Gigante, 14/11/11          Rel. OGS 2011/109 OGA 34 SIRE                            Page 3 of 65

1. Introduction

      Nowadays, drifters are universally used by all the scientific community to study the
surface currents. The SVP drifters (Sybrandy and Niiler, 1991; Lumpkin and Pazos, 2007)
and the CODE drifters (Davis, 1985) have become a standard for the measurement of the
near surface (about 15 meters or deeper) and the top meter currents, respectively.

      The behaviour of these instruments with respect to the wind, waves and surface
current was intensively considered. Various authors gave an estimate of the drifter-inferred
velocities as a function of wind, waves and relative surrounding water flow through direct
slippage measurements (Kirwan et al. 1975; Geyer 1989; Niiler et al. 1995), through
complex or linear regression models (Poulain et al. 1996; Pazan and Niiler 2001; Poulain
et al., 2009), by comparing real drifter observations with synthetic drifter derived by models
(Edwards et al., 2006) or from tank tests and dye patch comparisons (Niiler et al., 1997).
Despite these efforts, the water-following characteristics of drifters, and especially of the
CODE designs, with respect to the vertical current shear are still poorly known.

      With this purpose and following a previous experiment (Poulain et al., 2002), a
prototype drifter similar to the CODE drifter and equipped with a current meter and a
current profiler was realized at the National Institute of Oceanography and Experimental
Geophysics (OGS). This technical report illustrates the production steps and the
mechanical solutions adopted to construct the drifter (chapter 2) and describes the early
stage experiments carried out in the Gulf of Trieste to set-up the system (chapters 3, 4 and
5).

2. Prototype drifter characteristics and realization

      The OGS prototype CODE drifter has nearly the same structure of the CODE drifter
(compare the two images of Fig. 1).

                                                                              Programme cofinanced by European
www.tosca-med.eu                                                              Regional Development Fund (ERDF)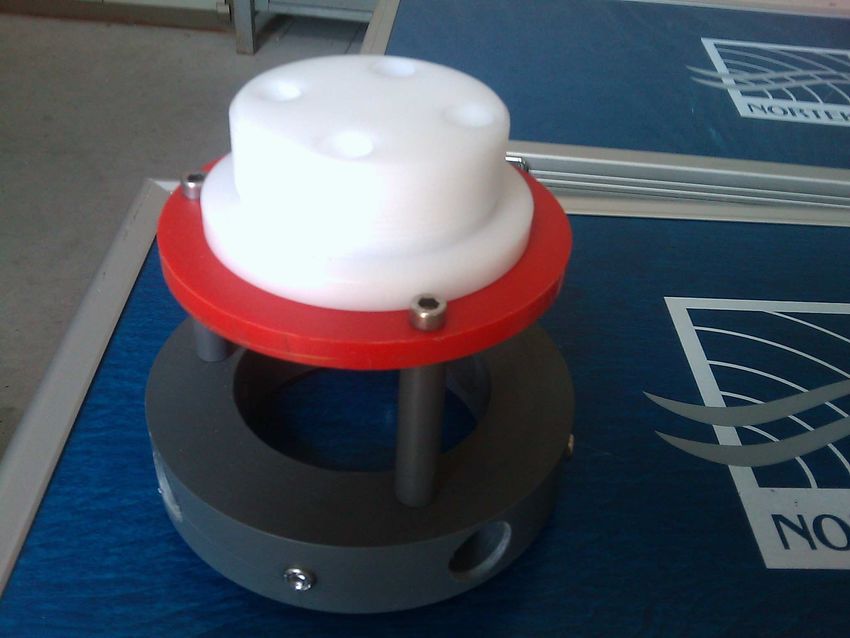
ISTITUTO NAZIONALE di Oceanografia e di Geofisica Sperimentale Trieste

Borgo Grotta Gigante, 14/11/11            Rel. OGS 2011/109 OGA 34 SIRE                                  Page 4 of 65

                    Fig. 1. CODE drifter (left) and the prototype drifter realized at OGS (right).

      The vertical tube does not contain the electronic and the battery, but holds a current
meter and a current profiler and can be flooded. The GPS position is provided by an
independent module that is attached on the upper part of the drifter (Fig. 2). This module
was developed by the OGS TECDEV group and is appropriate for coastal uses (Brunetti
and Zuppelli, 2011). The transmission of the positions and all the other recorded
parameters (temperature, battery level, …) occurs through SMS messages using land-
based cellular phone network (GSM/GPRS).

The current meter of the prototype is a Nortek Aquadopp current meter and was already
used for analogous applications. It is mounted on the upper part of the prototype tube (Fig.
2 and Fig. 11) so as to measure the current of the layer immediately below the surface. In
the past, it was used without the original case, but, to guarantee a perfect watertight, we
preferred to have the electronic inside the original case. Additionally, a 1 MHz Nortek
Aquadopp current profiler is mounted upside-down with the sensor head at the bottom of
the drifter (Fig. 3).

                                                                                      Programme cofinanced by European
www.tosca-med.eu                                                                       Regional Development Fund (ERDF)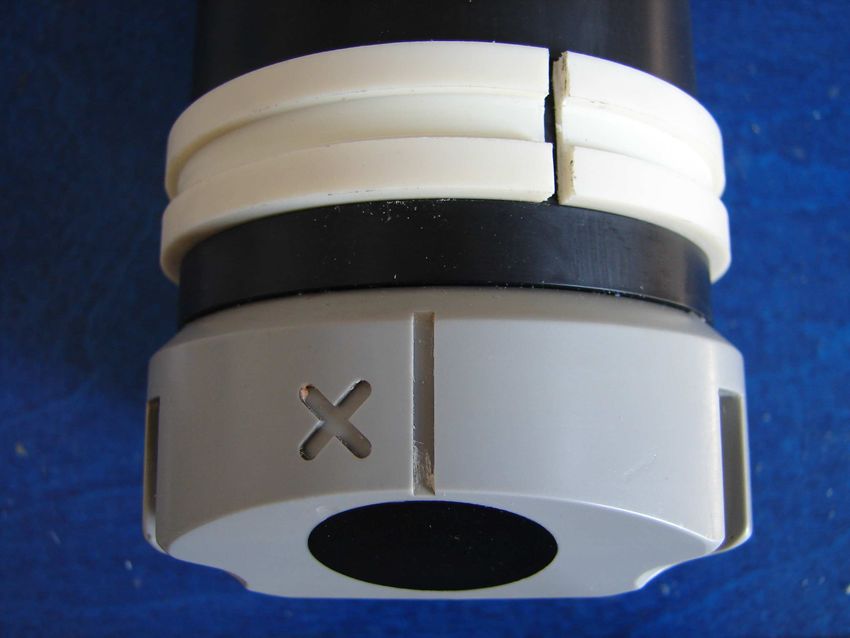
ISTITUTO NAZIONALE di Oceanografia e di Geofisica Sperimentale Trieste

Borgo Grotta Gigante, 14/11/11             Rel. OGS 2011/109 OGA 34 SIRE                             Page 5 of 65

  Fig. 2. The      GPS/GSM       position/transmission      Fig. 3. The Aquadopp current profiler at the
          module and the Aquadopp current meter                     bottom of the prototype drifter.
          head visible below the red PVC plate.

      The nominal maximum profiling range of this ADCP is 20 m with cell size between 30
cm and 4 m and minimum blanking of about 20 cm. These characteristics make this
instrument particularly suitable for the current studies in the Gulf of Trieste (maximum
depth: 23 m). Both the Aquadopps have the old version end bell (Fig. 4) that better fits into
the prototype structure and requires less room (Fig. 5).

            Fig. 4. The old version and current version of the end bell (from the Aquadopp manual).

                                                                                  Programme cofinanced by European
www.tosca-med.eu                                                                  Regional Development Fund (ERDF)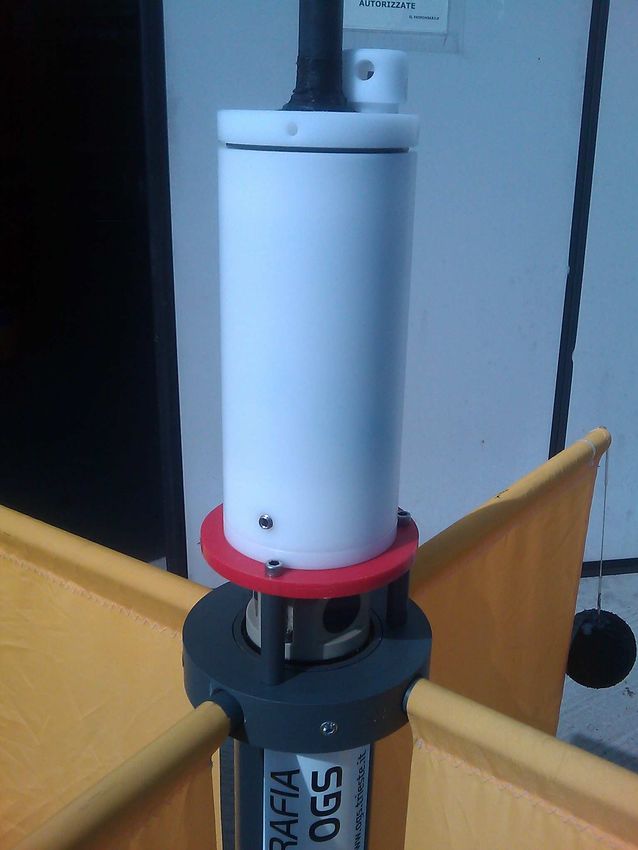
ISTITUTO NAZIONALE di Oceanografia e di Geofisica Sperimentale Trieste
Borgo Grotta Gigante, 14/11/11 Rel. OGS 2011/109 OGA 34 SIRE Page 6 of 65
Fig. 5. The two end bells of the two Aquadopps Fig. 6. The operator while fixing one of the drifter
mounted on the drifter. arms.
The prototype was built in the OGS machine shop. It is entirely fabricated with PVC
material assembled with stainless steel bolts.
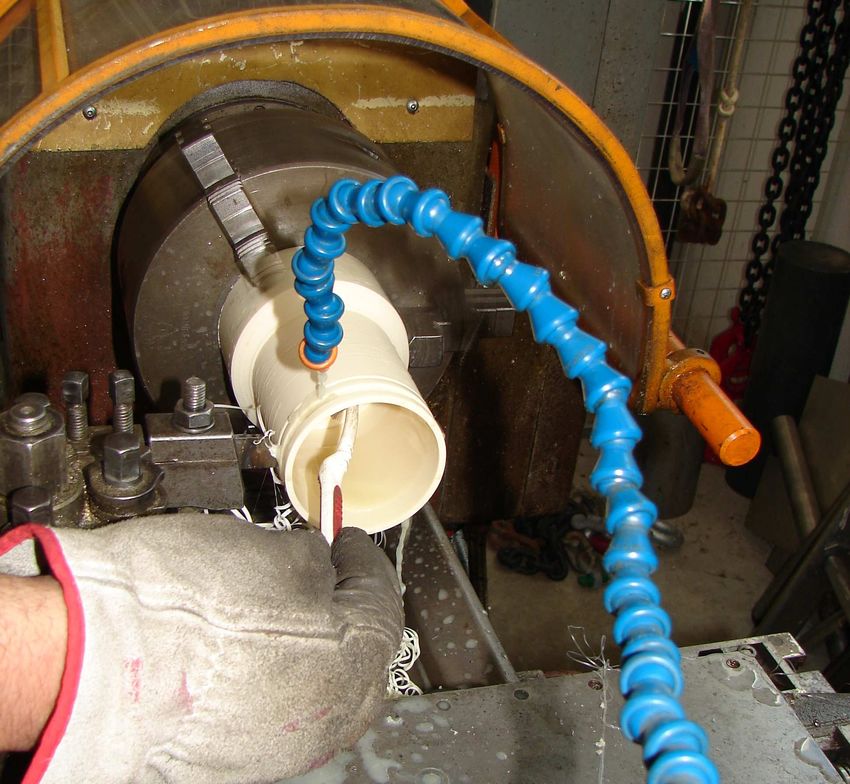
In particular we attached two PVC collars (obtained on a lathe from a PVC bar;
external diameter: 150 mm; height: 31 mm) by means of four M6 Allen head bolts to a
PVC tube (internal diameter: 80 mm; external diameter: 90 mm). Each collar has four
holes (diameter: 21 mm) that house the arms of the X-shape sails of the original CODE
design (Fig. 2 and Fig. 3). It was impossible to maintain these arms in position with the
rubber band like in the CODE drifter because of the presence of the Aquadopp current
meter/profiler inside the tube, therefore the arms were attached to the collars by using M4
Allen button head bolts (Fig. 6).
As said, the two Aquadopp instruments were located inside the tube. Ad-hoc collars
(obtained on a lathe from a solid tube; Fig. 7) were built to fill the gap between the tube
and the instrument in correspondence of the minimum diameter (i.e. indentation) of the
instrument case (Fig. 8). The collars were first positioned on the instrument case (in
correspondence of the indentation, see Fig. 9) and, after inserting the instrument inside the
Programme cofinanced by European
www.tosca-med.eu Regional Development Fund (ERDF)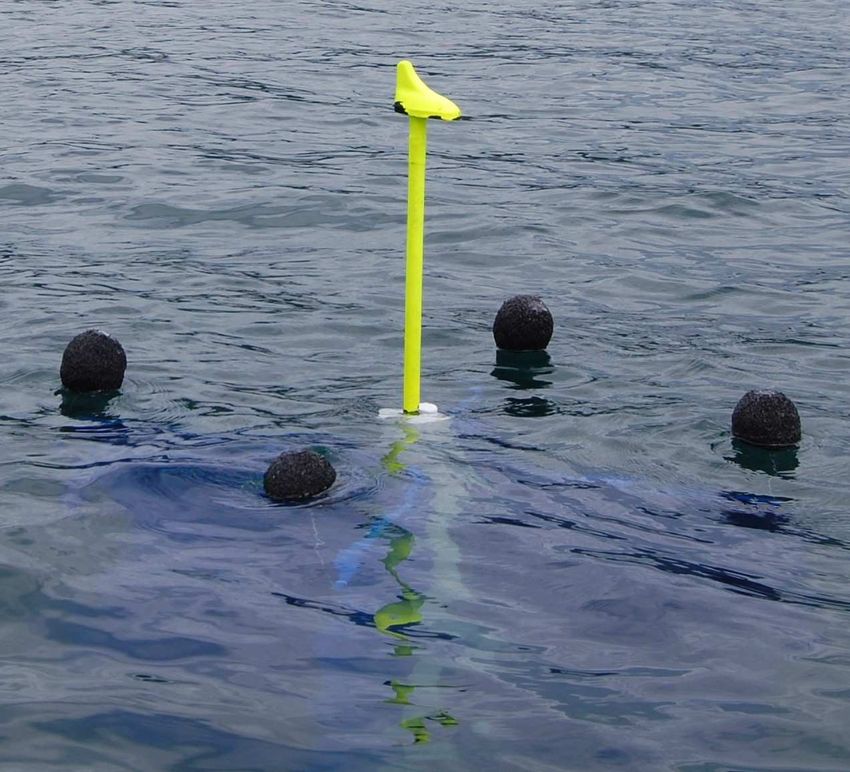
ISTITUTO NAZIONALE di Oceanografia e di Geofisica Sperimentale Trieste

Borgo Grotta Gigante, 14/11/11          Rel. OGS 2011/109 OGA 34 SIRE                            Page 7 of 65

tube, the collars were fixed to the tube by means of four M4 Allen headless bolts so as to
avoid any vertical slide or rotation of the instrument (four of these bolts can be seen in Fig.
5).

  Fig. 7. Realization of the collar on the lathe.          Fig. 8. A schema of the Aquadopp profiler
          The piece was obtained from a PVC                       showing the two indentations on the
          solid tube.                                             instrument case.

  Fig. 9. The collar mounted on the Aquadopp profiler in correspondence of the indentation (see also Fig.
          8).

                                                                              Programme cofinanced by European
www.tosca-med.eu                                                               Regional Development Fund (ERDF)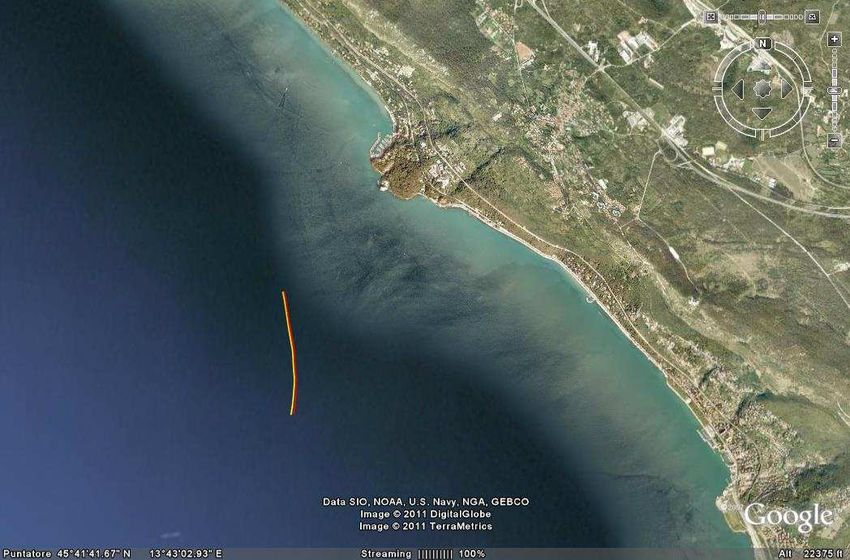
ISTITUTO NAZIONALE di Oceanografia e di Geofisica Sperimentale Trieste

Borgo Grotta Gigante, 14/11/11           Rel. OGS 2011/109 OGA 34 SIRE                             Page 8 of 65

      A PVC plate (diameter: 140 mm; thickness: 9 mm) was attached to the upper collar at
a distance of 57 mm from the upper face of the collar by means of three PVC cylinders
and three M6 Allen head bolts (Fig. 2 and Fig. 10). This structure allows the current meter
to work properly and provides a base where to place the GPS/GSM position/telemetry
module. No modifications were done on the structure of this module.

      The prototype was tested for buoyancy and stability in the OGS water tank. The four
small spherical surface floats of the modified CODE drifter did not provide the requested
buoyancy and an additional floating ring was placed around the prototype (Fig. 11).

 Fig. 10. The structure on the upper part of the
          prototype with the coupling element for
                                                           Fig. 11. The floating ring added around the tube
          the      GPS/GSM    module   (white   PVC
                                                                   below the top current meter to correct
          piece).
                                                                   buoyancy.

                                                                                Programme cofinanced by European
www.tosca-med.eu                                                                Regional Development Fund (ERDF)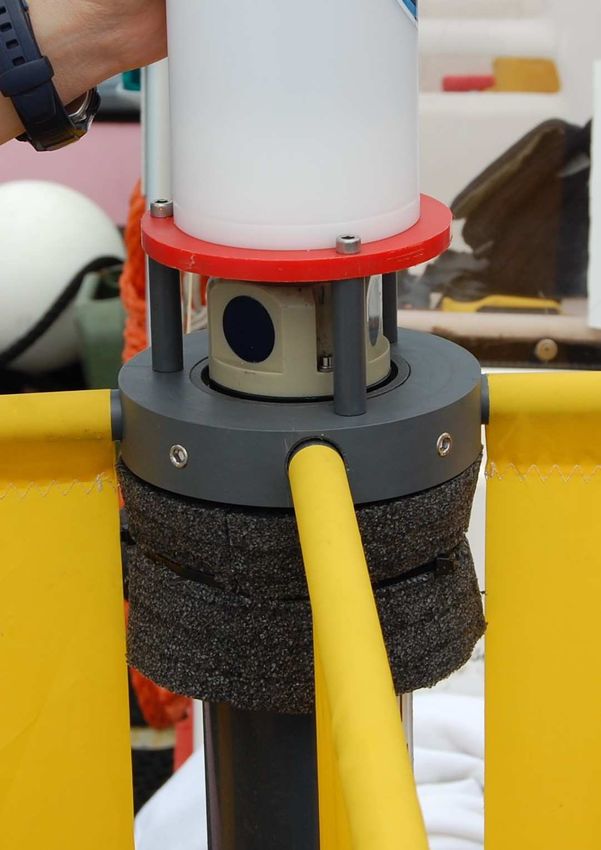
ISTITUTO NAZIONALE di Oceanografia e di Geofisica Sperimentale Trieste

Borgo Grotta Gigante, 14/11/11            Rel. OGS 2011/109 OGA 34 SIRE                                    Page 9 of 65

3. First test at sea

      On the 28th of July 2011, a first test was carried out in the Gulf of Trieste. The
prototype drifter was deployed together with a CODE drifter equipped with the GPS/GSM
position/transmission module just offshore the Natural Marine Reserve area of Miramare.
The drifters moved coherently for 1.5 hours (0).

                                                                                                  D

                                                                                                      2

                                                                                                       R

  Fig. 12. Prototype drifter (red) and drifter (yellow) trajectories during the first test off Miramare (left) with a
              zoom on the right (D: deployment position; 2: position after 5 minutes; R: recovery position).

      The prototype drifter resulted a bit heavy, but the previous days the measured salinity
was very low. All the prototype structure was submerged except the temperature sensor
(anyway, there are two other temperature sensors in the two current meter/profiler sensor
heads) and the antenna (Fig. 13). In this configuration, the current meter and the current
profiler sensor heads are located at about 18 cm and 1.67 m below the surface,

                                                                                        Programme cofinanced by European
www.tosca-med.eu                                                                         Regional Development Fund (ERDF)
ISTITUTO NAZIONALE di Oceanografia e di Geofisica Sperimentale Trieste

Borgo Grotta Gigante, 14/11/11             Rel. OGS 2011/109 OGA 34 SIRE                                Page 10 of 65

respectively. On the contrary, the CODE drifter with the GPS/GSM module was noticeably
light with the temperature sensor outside the water too (Fig. 14). This suggest the need of
adding another floating ring to the prototype or changing the existing one with another
material with higher buoyancy.

 Fig. 13. The prototype drifter. The temperature            Fig. 14. The CODE drifter with the GPS/GSM
           sensor     is   not    submerged.     The                 position/transmission module. Also for
           instrument is a bit heavy in water.                       this drifter the temperature sensor is not
                                                                     submerged. The instrument is noticeably
                                                                     light in water.

      The current meter and the current profiler were set so as to record the average of 1
minute measurements every 5 minutes (see Table 1 and Table 2).

Measurement interval             (s) : 300                Profile interval                     (s) : 300
Average interval                 (s) : 60                 Number of cells                            : 60
Blanking distance                (m) : 0.37               Cell size                            (m) : 0.25
Diagnostics interval(min) : 720                           Blanking distance                    (m) : 0.41
Power level                          : LOW+               Average interval                     (s) : 60
Compass upd. rate                (s) : 2                  Power level                                : HIGH
Coordinate System                    : ENU                Compass upd. rate                    (s) : 1
                                                          Coordinate System                          : ENU

Table 1.           Current meter parameters               Table 2.          Current profiler parameters

                                                                                       Programme cofinanced by European
www.tosca-med.eu                                                                       Regional Development Fund (ERDF)
ISTITUTO NAZIONALE di Oceanografia e di Geofisica Sperimentale Trieste
Borgo Grotta Gigante, 14/11/11 Rel. OGS 2011/109 OGA 34 SIRE Page 11 of 65
The technical data, recorded during the 1.5 h test, demonstrate that the pitch, roll and
heading of the two Aquadopps are coherent (Fig. 15, Fig. 16 and Fig. 17). The weather
conditions were good during the experiment and the instrument remained nearly always
vertical (i.e. no large pitch and roll); additionally, the prototype drifter did not display barrel-
roll (i.e. there is no large variation of heading). Fig. 17 displays also that the two sensor
heads were mounted properly. Indeed, there is no angle difference between them. The
gap between the two lines is not constant, rather it changes with time and the lines can
overlap and cross. Concerning the temperature (Fig. 18), the sensors need about 1 hour to
respond and show a difference of about 0.5°C betwee n the two heads.
Fig. 15. Pitch (degree) measured by the Fig. 16. Roll (degree) measured by the
currentmeter (blue line) and by the currentmeter (blue line) and by the
profiler (red line). X-axis: time (h). profiler (red line). X-axis: time (h).
Programme cofinanced by European
www.tosca-med.eu Regional Development Fund (ERDF)ISTITUTO NAZIONALE di Oceanografia e di Geofisica Sperimentale Trieste
Borgo Grotta Gigante, 14/11/11 Rel. OGS 2011/109 OGA 34 SIRE Page 12 of 65
Fig. 17. Heading (degree) measured by the Fig. 18. Temperature (°C) measured by the
currentmeter (blue line) and by the currentmeter (blue line) and by the
profiler (red line). X-axis: time (h). profiler (red line). X-axis: time (h).
The GPS data were used to compute the prototype velocity (by finite differencing the
xi +1 − xi −1
location sampled every 5 minutes: u i = , with u zonal velocity, t time and i an
t i +1 − t i −1
arbitrary index). This velocity was added to the current measured by the Aquadopp
instruments (added because of the “head toward” rule for the current). These data are a bit
confused and display large horizontal and vertical variations, mainly in direction (see
examples in Fig. 19 and Fig. 20; all the plots can be found in Appendix A). It is to remark
that the data were collected every 5 minutes and represent the average of 1 minute
measurements. Anyway, not a zig-zag but a smoother curve was expected. Therefore, a
second test was programmed with the instruments recording continuously (every second)
without any automatic average.
Programme cofinanced by European
www.tosca-med.eu Regional Development Fund (ERDF)ISTITUTO NAZIONALE di Oceanografia e di Geofisica Sperimentale Trieste
Borgo Grotta Gigante, 14/11/11 Rel. OGS 2011/109 OGA 34 SIRE Page 13 of 65
Fig. 19. Speed (blue line) and angle (red line) at Fig. 20. Speed (blue line) and angle (red line) at
a layer of about 4.3 m. X-axis: positions, position 2 (see 0 for the geographical
y-axis: speed (cm/s) and angle (degree). reference). X-axis: speed (cm/s) and
angle (degree), y-axis: depth (m).
4. Second test at sea
After about one month (on the 25th of August 2011), a second test was achieved in
the Gulf of Trieste. We deployed three drifters in line separated about 2.5 meters one to
the other (Fig. 21). In particular, the prototype drifter was deployed at first (in Fig. 21, the
drifter with the yellow sails and the antenna), then we released a CODE drifter without the
antenna (in Fig. 21, the drifter with the yellow sails without the antenna) and finally a
CODE with the GPS/GSM module (in Fig. 21, the drifter with the blue sails).
No changes on the floating ring was made in order to check the buoyancy of the
instrument with higher salinity with respect to the first test, but again the salinity was very
low (around 35 psu). Consequently, the prototype resulted again a bit heavy in water.
This time, the current meter and the current profiler were set so as to store data each
second with no average and with a cell size double with respect to the first experiment
Programme cofinanced by European
www.tosca-med.eu Regional Development Fund (ERDF)ISTITUTO NAZIONALE di Oceanografia e di Geofisica Sperimentale Trieste
Borgo Grotta Gigante, 14/11/11 Rel. OGS 2011/109 OGA 34 SIRE Page 14 of 65
(see Table 3 and Table 4). Additionally, the Power level (amount of acoustic energy
emitted in water) of the currentmeter was increased from “LOW+” to “HIGH” in order to
guarantee of the backscatter.
Fig. 21. Deployment of the three drifters during the second test off Miramare.
Measurement interval (s) : 1 Profile interval (s) : 1
Average interval (s) : 1 Number of cells : 30
Blanking distance (m) : 0.35 Cell size (m) : 0.5
Diagnostics interval(min) : N/A Blanking distance (m) : 0.43
Power level : HIGH Average interval (s) : 1
Compass upd. rate (s) : 1 Power level : HIGH
Coordinate System : ENU Compass upd. rate (s) : 1
Coordinate System : ENU
Table 3. Current meter parameters Table 4. Current profiler parameters
Programme cofinanced by European
www.tosca-med.eu Regional Development Fund (ERDF)ISTITUTO NAZIONALE di Oceanografia e di Geofisica Sperimentale Trieste
Borgo Grotta Gigante, 14/11/11 Rel. OGS 2011/109 OGA 34 SIRE Page 15 of 65
The test lasted 1 hour and the drifters moved coherently southward (Fig. 22). The
distance between the prototype and the original CODE drifter did not change so much,
while the CODE drifter equipped with the GPS/GSM module lagged a bit behind doubling
the gap from the prototype (from 4.6 m to 8.9 m; compare Fig. 21 with Fig. 23 and Fig. 24).
D
R
Fig. 22. Prototype drifter (red) and CODE drifter (yellow) trajectories during the second test off Miramare
(left) with a zoom on the right (D: deployment position; R: recovery position).
Programme cofinanced by European
www.tosca-med.eu Regional Development Fund (ERDF)ISTITUTO NAZIONALE di Oceanografia e di Geofisica Sperimentale Trieste
Borgo Grotta Gigante, 14/11/11 Rel. OGS 2011/109 OGA 34 SIRE Page 16 of 65
Fig. 23. The three drifters 17 minutes after the Fig. 24. The three drifters about 1 hour after the
deployment (Fig. 21). deployment (Fig. 21).
The technical data confirm what was already noticed in the previous test. The
temperature (Fig. 25) seems to have a response time of about 1 hour. Pitch, roll and
heading (Fig. 26, Fig. 27 and Fig. 28) are noisy, but do not vary so much with calm sea
conditions. It is important to note that the pressure sensor of the currentmeter failed and
gives always zero values (Fig. 29). Finally, the battery display a consumption of about 0.2-
0.3 V per 1-hour experiment (Fig. 30).
Fig. 25. Temperature (°C) measured by the Fig. 26. Pitch (degree) measured by the
currentmeter (blue line) and by the currentmeter (blue line) and by the
profiler (red line). X-axis: time (h). profiler (red line). X-axis: time (h).
Programme cofinanced by European
www.tosca-med.eu Regional Development Fund (ERDF)ISTITUTO NAZIONALE di Oceanografia e di Geofisica Sperimentale Trieste
Borgo Grotta Gigante, 14/11/11 Rel. OGS 2011/109 OGA 34 SIRE Page 17 of 65
Fig. 27. Roll (degree) measured by the Fig. 28. Heading (degree) measured by the
currentmeter (blue line) and by the currentmeter (blue line) and by the
profiler (red line). X-axis: time (h). profiler (red line). X-axis: time (h).
Fig. 29. Pressure (m) measured by the Fig. 30. Battery voltage (V) measured by the
currentmeter (blue line) and by the currentmeter (blue line) and by the
profiler (red line). X-axis: time (h). profiler (red line). X-axis: time (h).
The 1-second data recorded are noisy because they include the signal induced by
the waves (blue plot in Fig. 31). An average of some minutes can help to eliminate this
high frequency variability.
Programme cofinanced by European
www.tosca-med.eu Regional Development Fund (ERDF)ISTITUTO NAZIONALE di Oceanografia e di Geofisica Sperimentale Trieste
Borgo Grotta Gigante, 14/11/11 Rel. OGS 2011/109 OGA 34 SIRE Page 18 of 65
Fig. 31. Speed (m/s) recorded by the profiler at the first cell (blue: 1-s measurements; green: 2-minute
average of the speed; red: speed obtained from the 2- minutes average of the components).
X-axis: Time after deployment (s).
To this aim, a 2-minute velocity running average was performed each minute.
Resulting speeds (red line in Fig. 31) are lower than the simple 1-D average of the speed
(green line in Fig. 31) because it derive from the average of the zonal and meridional
components (2-D). Considering the average of the velocity, the plots of the speed and the
direction are smoother with respect to the figures obtained with the data of the first test
(example are given in Fig. 32 and Fig. 33, all the plots can be found in Appendix B). In
particular, there is less variability in the first layers, but also at mid depths and less
variability along the water column in each position. The speed of the surface layer is
markedly larger than the speeds recorded in the water column (about 35-40 cm/s
compared to less than 10 cm/s). The speed and direction plots rarely show a layer
structure and display a preferential direction toward the south - southeast all along the
water column (see plots in Appendix B).
Programme cofinanced by European
www.tosca-med.eu Regional Development Fund (ERDF)ISTITUTO NAZIONALE di Oceanografia e di Geofisica Sperimentale Trieste
Borgo Grotta Gigante, 14/11/11 Rel. OGS 2011/109 OGA 34 SIRE Page 19 of 65
Fig. 32. Speed (blue line) and angle (red line) at Fig. 33. Speed (blue line) and angle (red line) at
a layer of about 4.2 m. X-axis: time (h), halfway. X-axis: speed (cm/s) and angle
y-axis: speed (cm/s) and angle (degree). (degree), y-axis: depth (m)
Surely, having doubled the cell size parameter of the profiler helped to decrease the
data noise. Additionally, an overlapped average can partially smooth the plots, However,
one additional test is required. Indeed, it is very important to compare the average values
given by the Aquadopp with the raw data. To do this, we need to use the prototype first
acquiring each second and then, for example, recording the average of 5 minutes
measurements every 15 minutes.
5. Third test at sea
The third test was carried out on the 26th of September 2011. The prototype drifter
was deployed three times acquiring data every second for 10 minutes, then recording a 5-
minutes average every 15 minutes for one hour and finally again recording every second
for 10 minutes. The current meter and current profiler configurations were the same as the
second test (Tables 3 and 4), except for the timing. Again, no change on the floating ring
was made.
Programme cofinanced by European
www.tosca-med.eu Regional Development Fund (ERDF)ISTITUTO NAZIONALE di Oceanografia e di Geofisica Sperimentale Trieste
Borgo Grotta Gigante, 14/11/11 Rel. OGS 2011/109 OGA 34 SIRE Page 20 of 65
The salinity was higher than the previous two tests and the prototype disclosed a
better buoyancy in water.
The prototype drifter initially moved north-westward (green line) and then northward
during the second and third phase of the test (yellow and red lines, respectively). The
trajectories of the three phases reveal that the prototype speed increased during the test.
Indeed, the path done by the drifter during the first 10-minutes mission (green line in Fig.
34) is noticeably shorter than the one of the third phase (red line in Fig. 34).
R3
D3
R2
D2
R1
D1
Fig. 34. Prototype drifter missions during the third test. First 10-minutes mission (green), long mission with
5-minutes average acquisition every 15 minutes (yellow) and second 10-minutes mission (red).
Zoomed area an the right (D: deployment position; R: recovery position).
Wind speed also increased a bit during the experiments and, during the second and
third missions, the prototype remained clearly entrapped into a foam trail (Fig. 35). The
drifter seems to respond immediately to the wind changes. Unfortunately, the current
meter did not work during this test. Without these data, it is impossible to determine the
Programme cofinanced by European
www.tosca-med.eu Regional Development Fund (ERDF)ISTITUTO NAZIONALE di Oceanografia e di Geofisica Sperimentale Trieste
Borgo Grotta Gigante, 14/11/11 Rel. OGS 2011/109 OGA 34 SIRE Page 21 of 65
behaviour of the water current at the surface layer and to make any comparison with the
drifter motion. Anyway, it is possible to note a rising tendency in the current speed plot
during the first and third phases of the test, at least in the first 5-meters and from 10 to 15
meters (see Fig. 40 and Appendix C).
The main technical data (from Fig. 36 to Fig. 39) display that the parameters
recorded during the three phase of the test are coherent. In particular, the pitch and roll
information match quite well, while the heading data seem a bit too noisy with an
anomalous value around 13:00; anyway a decreasing tendency with the time can be
recognized.
Fig. 35. The prototype drifter into a foam trail formed during the second phase of the test.
Programme cofinanced by European
www.tosca-med.eu Regional Development Fund (ERDF)ISTITUTO NAZIONALE di Oceanografia e di Geofisica Sperimentale Trieste
Borgo Grotta Gigante, 14/11/11 Rel. OGS 2011/109 OGA 34 SIRE Page 22 of 65
Fig. 36. Temperature (°C) recorded by the Fig. 37. Pitch (degree) measured by the current
current profiler. X-axis: time (h). profiler. X-axis: time (h).
Fig. 38. Roll (degree) measured by the current Fig. 39. Heading (degree) measured by the
profiler. X-axis: time (h). current profiler. X-axis: time (h).
Programme cofinanced by European
www.tosca-med.eu Regional Development Fund (ERDF)ISTITUTO NAZIONALE di Oceanografia e di Geofisica Sperimentale Trieste
Borgo Grotta Gigante, 14/11/11 Rel. OGS 2011/109 OGA 34 SIRE Page 23 of 65
Fig. 40. Speed (blue line) and angle (red line) at a layer of about 2.7 m. X-axis: time (h), y-axis: speed
(cm/s) and angle (degree)..
Comparing the 5-minutes averages (second phase of the test) with the values of the
first and third phases, it seems that the current values recorded during the second phase
are quite consistent with the other values recorded immediately before and after.
The 5-minutes average maybe excessively smooth the data (see plots in Appendix
C). Therefore, considering also the good results obtained by 2-minutes averaging the data
(second test and first and third mission of the third test), a 2-minutes automatic average
interval seems to be more appropriate and can be used without introducing any additional
noise. Moreover, diminishing the value of this parameter allows reducing power
consumption and extends the operative life of the instrument.
Acknowledgments
The authors would like to thanks Mr. Belletti for the precious help during all the phase
of the prototype realization, Dr. Brunetti for the support with the GPS/GSM module, Dr.
Vinzi, Dr. Ciriaco and Mr. Pipino for their help during the tests at sea.
Programme cofinanced by European
www.tosca-med.eu Regional Development Fund (ERDF)ISTITUTO NAZIONALE di Oceanografia e di Geofisica Sperimentale Trieste
Borgo Grotta Gigante, 14/11/11 Rel. OGS 2011/109 OGA 34 SIRE Page 24 of 65
Appendix A – first test plots
Here below we report the speed and direction plots recorded during the first test
along the water column at the different position (i.e. while moving). X-axis: speed (cm/s)
and angle (degree), y-axis: depth (m).
Programme cofinanced by European
www.tosca-med.eu Regional Development Fund (ERDF)ISTITUTO NAZIONALE di Oceanografia e di Geofisica Sperimentale Trieste
Borgo Grotta Gigante, 14/11/11 Rel. OGS 2011/109 OGA 34 SIRE Page 25 of 65
Programme cofinanced by European
www.tosca-med.eu Regional Development Fund (ERDF)ISTITUTO NAZIONALE di Oceanografia e di Geofisica Sperimentale Trieste
Borgo Grotta Gigante, 14/11/11 Rel. OGS 2011/109 OGA 34 SIRE Page 26 of 65
Programme cofinanced by European
www.tosca-med.eu Regional Development Fund (ERDF)ISTITUTO NAZIONALE di Oceanografia e di Geofisica Sperimentale Trieste
Borgo Grotta Gigante, 14/11/11 Rel. OGS 2011/109 OGA 34 SIRE Page 27 of 65
Here below we report the speed and direction plots recorded during the first test
along the path at different layer of depth. X-axis: positions, y-axis: speed (cm/s) and angle
(degree).
Programme cofinanced by European
www.tosca-med.eu Regional Development Fund (ERDF)ISTITUTO NAZIONALE di Oceanografia e di Geofisica Sperimentale Trieste
Borgo Grotta Gigante, 14/11/11 Rel. OGS 2011/109 OGA 34 SIRE Page 28 of 65
Programme cofinanced by European
www.tosca-med.eu Regional Development Fund (ERDF)ISTITUTO NAZIONALE di Oceanografia e di Geofisica Sperimentale Trieste
Borgo Grotta Gigante, 14/11/11 Rel. OGS 2011/109 OGA 34 SIRE Page 29 of 65
Programme cofinanced by European
www.tosca-med.eu Regional Development Fund (ERDF)ISTITUTO NAZIONALE di Oceanografia e di Geofisica Sperimentale Trieste
Borgo Grotta Gigante, 14/11/11 Rel. OGS 2011/109 OGA 34 SIRE Page 30 of 65
Programme cofinanced by European
www.tosca-med.eu Regional Development Fund (ERDF)ISTITUTO NAZIONALE di Oceanografia e di Geofisica Sperimentale Trieste
Borgo Grotta Gigante, 14/11/11 Rel. OGS 2011/109 OGA 34 SIRE Page 31 of 65
Programme cofinanced by European
www.tosca-med.eu Regional Development Fund (ERDF)ISTITUTO NAZIONALE di Oceanografia e di Geofisica Sperimentale Trieste
Borgo Grotta Gigante, 14/11/11 Rel. OGS 2011/109 OGA 34 SIRE Page 32 of 65
Programme cofinanced by European
www.tosca-med.eu Regional Development Fund (ERDF)ISTITUTO NAZIONALE di Oceanografia e di Geofisica Sperimentale Trieste
Borgo Grotta Gigante, 14/11/11 Rel. OGS 2011/109 OGA 34 SIRE Page 33 of 65
Programme cofinanced by European
www.tosca-med.eu Regional Development Fund (ERDF)ISTITUTO NAZIONALE di Oceanografia e di Geofisica Sperimentale Trieste
Borgo Grotta Gigante, 14/11/11 Rel. OGS 2011/109 OGA 34 SIRE Page 34 of 65
Programme cofinanced by European
www.tosca-med.eu Regional Development Fund (ERDF)ISTITUTO NAZIONALE di Oceanografia e di Geofisica Sperimentale Trieste
Borgo Grotta Gigante, 14/11/11 Rel. OGS 2011/109 OGA 34 SIRE Page 35 of 65
Programme cofinanced by European
www.tosca-med.eu Regional Development Fund (ERDF)ISTITUTO NAZIONALE di Oceanografia e di Geofisica Sperimentale Trieste
Borgo Grotta Gigante, 14/11/11 Rel. OGS 2011/109 OGA 34 SIRE Page 36 of 65
Programme cofinanced by European
www.tosca-med.eu Regional Development Fund (ERDF)ISTITUTO NAZIONALE di Oceanografia e di Geofisica Sperimentale Trieste
Borgo Grotta Gigante, 14/11/11 Rel. OGS 2011/109 OGA 34 SIRE Page 37 of 65
Programme cofinanced by European
www.tosca-med.eu Regional Development Fund (ERDF)ISTITUTO NAZIONALE di Oceanografia e di Geofisica Sperimentale Trieste
Borgo Grotta Gigante, 14/11/11 Rel. OGS 2011/109 OGA 34 SIRE Page 38 of 65
Appendix B – second test plots
Here below we report the speed and direction plots recorded during the second test
along the water column at the different position (i.e. while moving). X-axis: speed (cm/s)
and angle (degree), y-axis: depth (m).
Programme cofinanced by European
www.tosca-med.eu Regional Development Fund (ERDF)ISTITUTO NAZIONALE di Oceanografia e di Geofisica Sperimentale Trieste
Borgo Grotta Gigante, 14/11/11 Rel. OGS 2011/109 OGA 34 SIRE Page 39 of 65
Programme cofinanced by European
www.tosca-med.eu Regional Development Fund (ERDF)ISTITUTO NAZIONALE di Oceanografia e di Geofisica Sperimentale Trieste
Borgo Grotta Gigante, 14/11/11 Rel. OGS 2011/109 OGA 34 SIRE Page 40 of 65
Programme cofinanced by European
www.tosca-med.eu Regional Development Fund (ERDF)ISTITUTO NAZIONALE di Oceanografia e di Geofisica Sperimentale Trieste
Borgo Grotta Gigante, 14/11/11 Rel. OGS 2011/109 OGA 34 SIRE Page 41 of 65
Programme cofinanced by European
www.tosca-med.eu Regional Development Fund (ERDF)ISTITUTO NAZIONALE di Oceanografia e di Geofisica Sperimentale Trieste
Borgo Grotta Gigante, 14/11/11 Rel. OGS 2011/109 OGA 34 SIRE Page 42 of 65
Programme cofinanced by European
www.tosca-med.eu Regional Development Fund (ERDF)ISTITUTO NAZIONALE di Oceanografia e di Geofisica Sperimentale Trieste
Borgo Grotta Gigante, 14/11/11 Rel. OGS 2011/109 OGA 34 SIRE Page 43 of 65
Programme cofinanced by European
www.tosca-med.eu Regional Development Fund (ERDF)ISTITUTO NAZIONALE di Oceanografia e di Geofisica Sperimentale Trieste
Borgo Grotta Gigante, 14/11/11 Rel. OGS 2011/109 OGA 34 SIRE Page 44 of 65
Programme cofinanced by European
www.tosca-med.eu Regional Development Fund (ERDF)ISTITUTO NAZIONALE di Oceanografia e di Geofisica Sperimentale Trieste
Borgo Grotta Gigante, 14/11/11 Rel. OGS 2011/109 OGA 34 SIRE Page 45 of 65
Programme cofinanced by European
www.tosca-med.eu Regional Development Fund (ERDF)ISTITUTO NAZIONALE di Oceanografia e di Geofisica Sperimentale Trieste
Borgo Grotta Gigante, 14/11/11 Rel. OGS 2011/109 OGA 34 SIRE Page 46 of 65
Programme cofinanced by European
www.tosca-med.eu Regional Development Fund (ERDF)ISTITUTO NAZIONALE di Oceanografia e di Geofisica Sperimentale Trieste
Borgo Grotta Gigante, 14/11/11 Rel. OGS 2011/109 OGA 34 SIRE Page 47 of 65
Programme cofinanced by European
www.tosca-med.eu Regional Development Fund (ERDF)ISTITUTO NAZIONALE di Oceanografia e di Geofisica Sperimentale Trieste
Borgo Grotta Gigante, 14/11/11 Rel. OGS 2011/109 OGA 34 SIRE Page 48 of 65
Here below we report the speed and direction plots recorded during the second test
along the path at different layer of depth. X-axis: time (s), y-axis: speed (cm/s) and angle
(degree).
Programme cofinanced by European
www.tosca-med.eu Regional Development Fund (ERDF)ISTITUTO NAZIONALE di Oceanografia e di Geofisica Sperimentale Trieste
Borgo Grotta Gigante, 14/11/11 Rel. OGS 2011/109 OGA 34 SIRE Page 49 of 65
Programme cofinanced by European
www.tosca-med.eu Regional Development Fund (ERDF)ISTITUTO NAZIONALE di Oceanografia e di Geofisica Sperimentale Trieste
Borgo Grotta Gigante, 14/11/11 Rel. OGS 2011/109 OGA 34 SIRE Page 50 of 65
Programme cofinanced by European
www.tosca-med.eu Regional Development Fund (ERDF)ISTITUTO NAZIONALE di Oceanografia e di Geofisica Sperimentale Trieste
Borgo Grotta Gigante, 14/11/11 Rel. OGS 2011/109 OGA 34 SIRE Page 51 of 65
Programme cofinanced by European
www.tosca-med.eu Regional Development Fund (ERDF)ISTITUTO NAZIONALE di Oceanografia e di Geofisica Sperimentale Trieste
Borgo Grotta Gigante, 14/11/11 Rel. OGS 2011/109 OGA 34 SIRE Page 52 of 65
Programme cofinanced by European
www.tosca-med.eu Regional Development Fund (ERDF)ISTITUTO NAZIONALE di Oceanografia e di Geofisica Sperimentale Trieste
Borgo Grotta Gigante, 14/11/11 Rel. OGS 2011/109 OGA 34 SIRE Page 53 of 65
Programme cofinanced by European
www.tosca-med.eu Regional Development Fund (ERDF)ISTITUTO NAZIONALE di Oceanografia e di Geofisica Sperimentale Trieste
Borgo Grotta Gigante, 14/11/11 Rel. OGS 2011/109 OGA 34 SIRE Page 54 of 65
Appendix C – third test plots
Here below we report the speed and direction plots recorded during the third test
along the water column at the different position (i.e. while moving). Positions 12 and 14 are
referred to the second phase of the test (5-minutes average every 15 minutes). X-axis:
speed (cm/s) and angle (degree), y-axis: depth (m).
Programme cofinanced by European
www.tosca-med.eu Regional Development Fund (ERDF)ISTITUTO NAZIONALE di Oceanografia e di Geofisica Sperimentale Trieste
Borgo Grotta Gigante, 14/11/11 Rel. OGS 2011/109 OGA 34 SIRE Page 55 of 65
Programme cofinanced by European
www.tosca-med.eu Regional Development Fund (ERDF)ISTITUTO NAZIONALE di Oceanografia e di Geofisica Sperimentale Trieste
Borgo Grotta Gigante, 14/11/11 Rel. OGS 2011/109 OGA 34 SIRE Page 56 of 65
Programme cofinanced by European
www.tosca-med.eu Regional Development Fund (ERDF)ISTITUTO NAZIONALE di Oceanografia e di Geofisica Sperimentale Trieste
Borgo Grotta Gigante, 14/11/11 Rel. OGS 2011/109 OGA 34 SIRE Page 57 of 65
Programme cofinanced by European
www.tosca-med.eu Regional Development Fund (ERDF)ISTITUTO NAZIONALE di Oceanografia e di Geofisica Sperimentale Trieste
Borgo Grotta Gigante, 14/11/11 Rel. OGS 2011/109 OGA 34 SIRE Page 58 of 65
Here below we report the speed and direction plots recorded during the third test
along the path at different layer of depth. X-axis: time (s), y-axis: speed (cm/s) and angle
(degree).
Programme cofinanced by European
www.tosca-med.eu Regional Development Fund (ERDF)ISTITUTO NAZIONALE di Oceanografia e di Geofisica Sperimentale Trieste
Borgo Grotta Gigante, 14/11/11 Rel. OGS 2011/109 OGA 34 SIRE Page 59 of 65
Programme cofinanced by European
www.tosca-med.eu Regional Development Fund (ERDF)ISTITUTO NAZIONALE di Oceanografia e di Geofisica Sperimentale Trieste
Borgo Grotta Gigante, 14/11/11 Rel. OGS 2011/109 OGA 34 SIRE Page 60 of 65
Programme cofinanced by European
www.tosca-med.eu Regional Development Fund (ERDF)ISTITUTO NAZIONALE di Oceanografia e di Geofisica Sperimentale Trieste
Borgo Grotta Gigante, 14/11/11 Rel. OGS 2011/109 OGA 34 SIRE Page 61 of 65
Programme cofinanced by European
www.tosca-med.eu Regional Development Fund (ERDF)ISTITUTO NAZIONALE di Oceanografia e di Geofisica Sperimentale Trieste
Borgo Grotta Gigante, 14/11/11 Rel. OGS 2011/109 OGA 34 SIRE Page 62 of 65
Programme cofinanced by European
www.tosca-med.eu Regional Development Fund (ERDF)ISTITUTO NAZIONALE di Oceanografia e di Geofisica Sperimentale Trieste
Borgo Grotta Gigante, 14/11/11 Rel. OGS 2011/109 OGA 34 SIRE Page 63 of 65
Programme cofinanced by European
www.tosca-med.eu Regional Development Fund (ERDF)ISTITUTO NAZIONALE di Oceanografia e di Geofisica Sperimentale Trieste
Borgo Grotta Gigante, 14/11/11 Rel. OGS 2011/109 OGA 34 SIRE Page 64 of 65
References
Brunetti F. and Zuppelli P., 2011. Drifter costiero con telemetria GSM – Progetto esecutivo
– ver. 1.0. REL. OGS 2011/110 OGA 35 TECDEV, Trieste, Italy.
Davis R.E., 1985. Drifter observation of coastal currents during CODE. The method and
descriptive view. J. Geophys. Res., 90, 4741–4755.
Edwards K.P., Werner F.E. and Blanton B.O., 2006. Comparison of Observed and
Modeled Drifter Trajectories in Coastal Regions: An Improvement through
Adjustments for Observed Drifter Slip and Errors in Wind Fields. J. Atmos. Oceanic
Technol., 23, 1614–1620. doi: 10.1175/JTECH1933.1
Geyer W.R., 1989. Field calibration of mixed-layer drifters. J. Atmos. Oceanic Technol., 6,
333–342.
Kirwan A. D., McNally G., Chang M.-S. and Molinari R., 1975. The effect of wind and
surface currents on drifters. J. Phys. Oceanogr., 5, 361–368.
Lumpkin R. and Pazos M., 2007. Measuring surface currents with Surface Velocity
Program drifters: the instrument, its data, and some recent results, Chapter two of
Lagrangian Analysis and Prediction of Coastal and Ocean Dynamics (LAPCOD),
edited by: Griffa A., Kirwan A. D., Mariano A. J., Ozgokmen T. and Rossby T.,
Cambridge University Press, 39–67.
Niiler P.P. and Paduan J.D., 1995. Wind-driven motions in the northeast Pacific as
measured by Lagrangian drifters. J. Phys. Oceanogr., 25, 2819–2830.
Niiler P.P., Johnson W.R. and Baturin N., 1997. Surface Current and Lagrangian-drift
Program, Technical Report, U.S. Dept. of the Interior, Minerals Management Service,
10 pp.
Pazan S.E. and Niiler P.P., 2001. Recovery of near-surface velocity from undrogued
drifters. J. Atmos. Oceanic Technol., 18, 476–489.
Programme cofinanced by European
www.tosca-med.eu Regional Development Fund (ERDF)ISTITUTO NAZIONALE di Oceanografia e di Geofisica Sperimentale Trieste
Borgo Grotta Gigante, 14/11/11 Rel. OGS 2011/109 OGA 34 SIRE Page 65 of 65
Poulain P-M, Warn-Varnas A. and Niiler P.P., 1996. Near-surface circulation of the Nordic
seas as measured by Lagrangian drifters. J. Geophys. Res., 101 (C8), 18 237–18
258.
Poulain P-M, Ursella L. and Brunetti F., 2002. Direct measurements of water-following
characteristics of CODE surface drifters. Extended Abstracts, 2002 LAPCOD
Meeting, Key Largo, FL, Office of Naval Research. [Available online at
http://www.rsmas.miami.edu/LAPCOD/2002-KeyLargo/abstracts/absC302.html.]
Poulain P-M, Gerin R., Mauri E. and Pennel R., 2009. Wind Effects on Drogued and
Undrogued Drifters in the Eastern Mediterranean. J. Atmos. Oceanic Technol., 26,
1144–1156. doi: 10.1175/2008JTECHO618.1
Stravisi F., Pieri G. and Berger P., 1981. Golfo di Trieste: risultati delle misure
correntometriche 1951-1954. Bollettino della Società Adriatica di Scienze, LXV, 23-
35.
Sybrandy A. L. and Niiler P. P., 1991. WOCE/TOGA Lagrangian drifter construction
manual, Scripps Institution of Oceanography, San Diego, California, SIO REF 91/6,
WOCE Report 63.
Programme cofinanced by European
www.tosca-med.eu Regional Development Fund (ERDF)You can also read