Observed Zonal Variations of the Relationship between ITCZ Position and Meridional Temperature Contrast
←
→
Page content transcription
If your browser does not render page correctly, please read the page content below

climate
Article
Observed Zonal Variations of the Relationship between ITCZ
Position and Meridional Temperature Contrast
Eric Mischell *            and Jung-Eun Lee

                                          Department of Earth, Environmental and Planetary Sciences, Brown University, Providence, RI 02912, USA;
                                          jung-eun_lee@brown.edu
                                          * Correspondence: eric.mischell@rsmas.miami.edu

                                          Abstract: While the zonal-mean position of the intertropical convergence zone (ITCZ) is well ex-
                                          plained using the zonal-mean energetic framework, the regional variations of the ITCZ have been
                                          more difficult to characterize. We show a simple metric, the interhemispheric tropical sea surface
                                          temperature (SST) contrast, is useful for estimating the local ITCZ position over seasonal and inter-
                                          annual timescales in modern observations. We demonstrate a linear correspondence between the
                                          SST contrast and ITCZ position across oceanic sectors. Though consistently linear, the sensitivity
                                          of the ITCZ position to the SST contrast varies from ~1◦ /K to ~7◦ /K depending on location. We
                                          also find that the location of the Western Pacific interannual ITCZ is negatively correlated with the
                                          temperature of the North Atlantic Ocean. This result may help put constraints on past and future
                                          regional migrations of the ITCZ.

                                          Keywords: tropical climate; ocean-atmosphere interactions; climate dynamics; regional climate
                                          variability and change; AMO and Pacific precipitation


                                          1. Introduction
Citation: Mischell, E.; Lee, J.-E.
Observed Zonal Variations of the               A central feature of the tropical climate is the intertropical convergence zone (ITCZ), a
Relationship between ITCZ Position        band of intense convection arising from the convergence of the trade winds [1]. The ITCZ
and Meridional Temperature                coincides with the ascending branch of the Hadley circulation, a thermally direct cell that
Contrast. Climate 2022, 10, 30.           transports energy from the tropics towards the poles [2]. At low levels, moisture converges
https://doi.org/10.3390/cli10030030       at the ITCZ; while in the upper troposphere, energy diverges out of the tropics [3]. Over
Academic Editor: Steven McNulty
                                          the seasonal cycle, the rainband associated with the ITCZ is observed to migrate into the
                                          warmer hemisphere, and the ITCZ is thought to migrate in response to radiative forcing
Received: 11 January 2022                 over long timescales [4,5].
Accepted: 21 February 2022                     It has long been recognized that tropical rainfall is connected to the local distribution
Published: 23 February 2022               of sea surface temperature (SST; see [6] and references therein). The SST is closely related
Publisher’s Note: MDPI stays neutral      to the near-surface moist static energy, and consequently to variations of gross moist
with regard to jurisdictional claims in   stability [7–9]. Moreover, the spatial pattern of SST can induce pressure gradients and
published maps and institutional affil-   drive low-level convergence [10,11]. Yet, the ITCZ does not simply follow the local SST
iations.                                  maximum [12], and the ITCZ is increasingly thought to be influenced by nonlocal processes.
                                          A large volume of studies over the past two decades supports the idea of extratropical
                                          influence on ITCZ position [13], particularly by means of a change in the atmospheric
                                          energy transport [2,14–20]. This energetic framework relates the energy flux between the
Copyright: © 2022 by the authors.         northern and southern hemispheres to the off-equatorial position of the Hadley cell, which
Licensee MDPI, Basel, Switzerland.        is primarily responsible for moving energy across the equator [3,18,21]. Thus, an ITCZ
This article is an open access article
                                          north of the equator implies a southward atmospheric energy transport and an ITCZ south
distributed under the terms and
                                          of the equator, a northward atmospheric energy transport. While the energetic framework
conditions of the Creative Commons
                                          holds in the zonal mean, it is less clear how the ITCZ in a given region will respond to a
Attribution (CC BY) license (https://
                                          change in the atmospheric energy transport. When applied to the regional variations of the
creativecommons.org/licenses/by/
                                          ITCZ, the energetic framework has had mixed success [22,23], which implies the need to
4.0/).

Climate 2022, 10, 30. https://doi.org/10.3390/cli10030030                                                    https://www.mdpi.com/journal/climate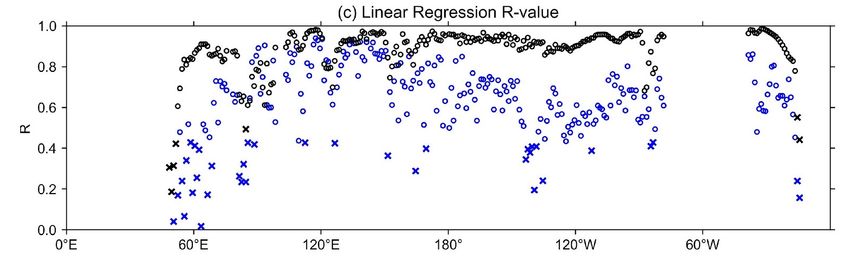
Climate 2022, 10, 30                                                                                              2 of 12

                       account for both meridional and zonal energy fluxes [24], as well as the vertical structure
                       of convection [25].
                            Understanding the regional migrations of the ITCZ, and their relation to the zonal-
                       mean energetic framework, is of considerable importance in paleoclimate [26]. There is a
                       seeming inconsistency of models, which simulate that the zonal-mean ITCZ shifted
Climate 2022, 10, 30 3 of 12
spatial distribution of precipitation, and use it without alteration in our basin-wide analysis
(Section 3.1). However, in our longitudinal analysis (Section 3.2), which is more subject to
variability because it involves fewer data points, we exclude the centroid that falls outside
of the neighborhood of the precipitation maximum, specifically when |PC − PM | > 3◦ , as a
case when the ITCZ position is ambiguous.
We calculate the local interhemispheric SST contrast (∆SST) as the difference between
the area-weighted mean northern hemisphere SST (from 0◦ to 20◦ N) and mean southern
hemisphere SST (from 20◦ S to 0◦ ) at each longitude. Only those longitudes are included
where 95% of grid boxes from 20◦ S to 20◦ N are oceanic. We follow previous studies in
performing a linear regression analysis of the precipitation centroid and interhemispheric
SST contrast [27,31,40]. In Section 3.1, we show the average relationship in ocean basins and
sectors of the Pacific; and in Section 3.2, we show the relationship at individual longitudes.
The regions of interest are borrowed from Waliser and Gautier [1]. They include global,
Indian (60◦ E–100◦ E), Pacific (110◦ E–100◦ W), Atlantic (10◦ W–40◦ W), Western Pacific
(110◦ E–150◦ E), Central Pacific (160◦ E–160◦ W), and Eastern Pacific (100◦ W–140◦ W).
3. Results
3.1. Basin-Wide Variations
We show a strong correlation between ITCZ position (PC ) and regional interhemi-
spheric SST contrast (∆SST) over the annual cycle in ocean basins (Figure 1) and sectors
of the Pacific (Figure 2). In the global case (Figure 1a), we find a strong correlation coeffi-
cient (R2 = 0.99) and slope of the linear regression (2.96◦ /K), which agree with previous
work [31]. The correlation coefficient is found to be higher than that of Donohoe et al. [31],
likely because we included only those portions of the ITCZ that migrate over the ocean.
Next, we apply this analysis to individual ocean basins and sectors of the Pacific. We find
that a strong linear relationship is present in all regions, and that each basin and sector is
characterized by a unique regression slope (Figures 1b–d and 2), which has not previously
been shown.
We refer to the regression slope of the precipitation centroid and SST contrast as the
‘sensitivity’ of the ITCZ position to the local meridional SST contrast. We observe substantial
differences in the sensitivity of the ITCZ position to the SST contrast between regions. The
lowest sensitivity is found in the Atlantic (Figure 1d; 1.76◦ /K). In boreal summer and fall,
upwelling leads to a strong SST gradient in the Atlantic (the Atlantic cold tongue); yet in
boreal winter and spring, when the SST gradient is reduced, the ITCZ remains mostly in the
northern hemisphere. The Eastern Pacific (Figure 2d) is also characterized by a strong SST
gradient, but the sensitivity of the ITCZ is markedly higher (2.75◦ /K). It is notable that a
single month, March, appears to exert a strong influence on the correlation and slope; with
March excluded, the correlation coefficient is raised from 0.90 to 0.93, and the sensitivity
is lowered to 2.43◦ /K. This is likely the imprint of the double ITCZ which often forms in
March in the Eastern Pacific (for discussion of the effect of El Niño on the double ITCZ in
boreal spring, see [41]). The highest sensitivity is observed in the Indian (Figure 1b; 3.9◦ /K),
where the monsoon circulation draws the ITCZ abruptly northward in June. In this case,
the land-ocean heating contrast is likely more important than the SST gradient in boreal
summer, which would account for the relatively weak correlation (R2 = 0.79). The Central
Pacific (Figure 2c) displays a high sensitivity (3.89◦ /K) and strong correlation (R2 = 0.95).
As the Central Pacific contains a double ITCZ [1], the high sensitivity likely results from
the seasonal waxing and waning of its two rainbands, which could cause the precipitation
centroid to move across hemispheres with a small change in the SST contrast [42]. We
discuss the implications of these regional differences in sensitivity in Section 4.Climate 2022, 10, x FOR PEER REVIEW 5 of 12
Climate 2022, 10, 30 4 of 12
Figure 1.
Figure Observed seasonal
1. Observed seasonal cycle
cycle of
of the
the ITCZ
ITCZ position
position and
and interhemispheric
interhemispheric SST SST contrast
contrast within
within
each ocean
each ocean basin.
basin. The
The12 12crosses
crossesrepresent
represent the
the 21-year
21-year mean
mean precipitation
precipitation centroid
centroid andand SST
SST contrast
contrast
for
for each
each month
month ofof the
the year.
year. The
The length
length ofof each
each cross
cross equals
equals 11 standard
standard deviation
deviation from
from the mean.
mean. The
The
star
star is
is the
the annual
annual average.
average. Note
Note the
the strong
strong correlation
correlation in
in each
each basin,
basin, as
as well
well as
as the
the differences
differences in
in the
the
sensitivity of the ITCZ position to the local SST contrast.
sensitivity of the ITCZ position to the local SST contrast.Climate 2022, 10, x FOR PEER REVIEW 6 of 12
Climate 2022, 10, 30 5 of 12
Figure 2.
Figure Observed seasonal
2. Observed seasonalcycle
cycleofofthe
theITCZ
ITCZ position and
position interhemispheric
and interhemisphericSSTSST
contrast within
contrast each
within
sectorsector
each of theofPacific. The 12The
the Pacific. crosses represent
12 crosses the 21-year
represent mean precipitation
the 21-year centroidcentroid
mean precipitation and SSTandcontrast
SST
contrast
for each for eachofmonth
month of the
the year, the year,
lengththeof length of each
each cross cross
equals equals 1deviation
1 standard standard from
deviation from and
the mean, the
mean,
the starand star is the
is the annual annualasaverage,
average, in Figure as 1.
in Again,
Figure 1. Again,
note note the
the strong strong correlation
correlation and dif-
and difference in
ference in sensitivity in each sector. Figure 1c is identical to Figure 2a but is reproduced
sensitivity in each sector. Figure 1c is identical to (a) but is reproduced for ease of comparison. for ease of
comparison.
A noticeable feature of the Western Pacific (Figure 2b) is the elliptical shape of the
3.2. Longitudinal
relationship Variations
between the ITCZ position and SST contrast [31,43]. Though more subtle, this
feature
Weisshow
also for
observed to a certain
each ocean extent
basin and in the
sector Central
of the Pacific,
Pacific Indian,
a linear and Atlantic.
relationship between In
the ITCZ
the Western Pacific,
position as the
and localITCZ migrates fromSST
interhemispheric the contrast,
southernwhichhemisphere to the northern
is characterized by a
hemisphere
unique (February
regression slope.toHere,
August), the SSTthe
we examine contrast changes
longitudinal before the
variations ITCZ.
of this Likewise,
correspond-
as the ITCZ returns from the northern hemisphere to the southern hemisphere
ence. Figure 3 shows the seasonal and interannual relationships of the local ITCZ position (August
to February), the ITCZ lags the change in the SST contrast. This is also
and underlying SST contrast at each longitude. The seasonal relationship is the linear the case in the
re-
Central Pacific (from May to November) and Indian (from December to
gression at each longitude of the 21-year mean precipitation centroid and SST contrast for April). On the
contrary,
each theofelliptical
month the year,shape in the
and the Atlantic (June
interannual to December)
relationship implies
is the linear that the at
regression shift of
eachClimate 2022, 10, 30 6 of 12
the ITCZ precedes the change in the SST contrast. Based on this result, we conjecture
that the seasonal migration of the ITCZ in the Western Pacific, Central Pacific, and Indian
is facilitated by the SST contrast, but a different mechanism is involved in the Atlantic,
possibly related to processes over land, where the seasonal temperature response to solar
forcing is faster than that of the ocean.
Lastly, we depict the 21-year interannual variability in Figures 1 and 2 by the length
of each cross, which represents 1 standard deviation from the mean of each month. In all
of the 21 years, the seasonal correlation between the ITCZ position and SST contrast is
significant in each basin and sector (see Supplementary Materials Table S1). However, the
sensitivity of the ITCZ position to the SST contrast can vary between years. In the Atlantic,
the variability is minimal (the standard deviation is 0.18◦ /K, or ~10%), while in the Central
Pacific, the variability is more substantial (1.1◦ /K, or ~28%; Table S1). In addition, we find
a significant correlation between the annual-mean ITCZ position and SST contrast over the
21-year period in all regions except the Indian region (Table S2), for which we presume the
monsoon circulation dominates the interannual variability instead of the SST contrast. The
correlation of the annual-mean ITCZ position and SST contrast is weaker than that of the
seasonal relationship but is comparable to the interannual correlation of the zonal-mean
ITCZ position and atmospheric heat transport found in a prior study [32]. We also find
that the sensitivity of the annual-mean ITCZ position to the SST contrast is offset from that
of the seasonal relationship (Table S2), but the basins with a higher seasonal slope tend
to have a higher interannual slope. It should be noted that the interannual spread of the
annual-mean ITCZ position and SST contrast is small compared to the seasonal amplitude,
and we conclude that the correlation is stronger when the SST contrast is sufficiently large;
or equivalently, when the points are clustered, the linear relationship is less apparent.
3.2. Longitudinal Variations
We show for each ocean basin and sector of the Pacific a linear relationship between the
ITCZ position and local interhemispheric SST contrast, which is characterized by a unique
regression slope. Here, we examine the longitudinal variations of this correspondence.
Figure 3 shows the seasonal and interannual relationships of the local ITCZ position
and underlying SST contrast at each longitude. The seasonal relationship is the linear
regression at each longitude of the 21-year mean precipitation centroid and SST contrast
for each month of the year, and the interannual relationship is the linear regression at each
longitude of the annual-mean precipitation centroid and SST contrast over 21 years. The
regression slope is shown in Figure 3a, the intercept in Figure 3b, and correlation coefficient
in Figure 3c. Unlike the analysis in Section 3, we impose the condition |PC − PM | < 3◦
(see Section 2). If the precipitation centroid differs from the precipitation maximum by
more than 3◦ , we consider the rainband too diffuse and without a single discernable ITCZ
position; otherwise, we use the precipitation centroid as our index for ITCZ position, as in
Section 3.1. We find this condition reduces some of the noise in the interannual variability.
Lastly, the discontinuities in Figure 3 represent the land surface, since these regions are
masked in our analysis (Section 2).Climate 2022, 10, x FOR PEER REVIEW 8 of 12
Climate 2022, 10, 30 7 of 12
Figure
Figure 3.3. Observed
Observed relationship
relationship between
between the
the local
local ITCZ
ITCZ position
position and
and interhemispheric
interhemispheric SST SST contrast
contrast
at each longitude, over seasonal (black) and interannual (blue) timescales. The
at each longitude, over seasonal (black) and interannual (blue) timescales. The slope (a) and slope (a) and intercept
inter-
(b)
ceptof(b)
theofbest-fit line, line,
the best-fit and the
andR-value (c) of(c)
the R-value theoflinear regression,
the linear are shown.
regression, are shown.In (c)
Inopen circles
(c) open are
circles
statistically significant;
are statistically crosses
significant; areare
crosses not. The
not. Theinterannual
interannualcorrelation
correlationofofthe
theITCZ
ITCZposition
position and
and SST
contrast is generally weaker than the seasonal correlation but is still overwhelmingly significant. significant.
Note the zonal variations of the slope and intercept. In (a) the seasonal and interannual
Note the zonal variations of the slope and intercept. In (a) the seasonal and interannual signals signals are
are
visually coherent, though there is a high degree of noise in the interannual signal. In
visually coherent, though there is a high degree of noise in the interannual signal. In (b) the seasonal (b) the seasonal
and interannual intercepts appear highly coherent. Discontinuities indicate the presence of conti-
and interannual intercepts appear highly coherent. Discontinuities indicate the presence of continent.
nent.
The seasonal ITCZ position and local SST contrast are correlated (R > 0.8) at nearly
4. Discussion
every longitude (Figure 3c). For the annual-mean ITCZ position and SST contrast (inter-
There
annual is a significant
variations), seasonal and
the correlations areinterannual
weaker butcorrelation between
nonetheless mainlythe ITCZ position
significant. We
and local
note that weinterhemispheric SST contrast
excluded the centroid in the
outside ocean basins, sectors
maximum of the Pacific,
precipitation and indi-
neighborhood to
vidualan
avoid longitudes.
ambiguous This relationship
ITCZ is characterized
position. The by a linearofsensitivity
interannual variability of the ITCZ
the annual-mean SST
contrast
position is
to smaller
the SST than the seasonal
contrast, amplitude,
and the slope so we regression
of the linear expect a weaker
betweencorrelation. We
the precipita-
observe substantial
tion centroid and SSTzonal variations
contrast variesof the ~1°/K
from sensitivity of the
to ~7°/K by ITCZ position
location. to the
We find thelocal SST
seasonalClimate 2022, 10, 30 8 of 12
contrast (Figure 3a). In the Indian basin (60◦ E–100◦ E), we find steep changes in sensi-
tivity associated with the Indian subcontinent (~80◦ E) and western Maritime Continent
(~100◦ E). The sensitivity in the Western Pacific (110◦ E–150◦ E) is low, but rises in the
Central Pacific (160◦ E–160◦ W), reaching a maximum of ~7◦ /K. This maximum occurs
near the boundary of the Central and Eastern Pacific (~160◦ W), where the South Pacific
Convergence Zone (SPCZ) is largely present in boreal winter and spring, but largely absent
in boreal summer and fall. We conclude that a small change in the SST contrast coincides
with the large-scale transition between an SPCZ-dominant and ITCZ-dominant regime.
The Eastern Pacific (100◦ W–140◦ W) generally restores to a lower sensitivity, except near
100◦ W, where the higher sensitivity likely reflects the monsoon circulation in Central
America. Lastly, the sensitivity in the Atlantic (10◦ W–40◦ W) declines from west to east.
In the eastern sector of the basin, the Atlantic cold tongue may restrict the migration of
the ITCZ to the northern hemisphere, reducing its seasonal range and sensitivity. We note
that the interannual regression slope appears to be reasonably coherent with the seasonal
regression slope, though there is a high degree of noise in the interannual signal. In the plot
of the regression intercept (Figure 3b), these signals appear quite coherent. We conclude
that the local ITCZ position is closely connected to the local SST contrast over seasonal and
interannual timescales, and this connection is characterized by a local sensitivity, which
varies from ~1◦ /K to ~7◦ /K depending on location. Yet, a physical explanation for the
zonal variations of the sensitivity is not entirely clear and may involve nonlocal processes.
We discuss this further in Section 4.
4. Discussion
There is a significant seasonal and interannual correlation between the ITCZ position
and local interhemispheric SST contrast in ocean basins, sectors of the Pacific, and indi-
vidual longitudes. This relationship is characterized by a linear sensitivity of the ITCZ
position to the SST contrast, and the slope of the linear regression between the precipitation
centroid and SST contrast varies from ~1◦ /K to ~7◦ /K by location. We find the seasonal
and interannual sensitivities are coherent, which indicates that a common mechanism
underlies both relationships. On average, the Atlantic has the lowest sensitivity, the Indian
and Central Pacific, the highest. In the Pacific, there is a local maximum of the sensitivity
(~7◦ /K) at the eastern boundary of the Central Pacific (~160◦ W). We attribute this maxi-
mum to the transition between an SPCZ-dominant and ITCZ-dominant regime. A core of
cold equatorial waters extends from the Eastern Pacific to the Central Pacific, suppressing
convection and forcing the rainband to oscillate between these modes. Since the transi-
tion occurs alongside a small change in the SST contrast (the slope is high), we speculate
that warming in the southeastern Pacific could cause a pronounced southward shift of
the rainband. In the Eastern Pacific and Atlantic, the ITCZ is confined to the northern
hemisphere, and the Western Pacific lacks the cold equatorial core of the Central Pacific,
both of which narrow the seasonal range of the ITCZ and reduce its sensitivity and slope.
The relationship between the ITCZ and SST contrast in the Indian is obscured by the effect
of the monsoon circulation.
To find how large-scale teleconnections such as the El Niño Southern Oscillation
(ENSO), Atlantic Multidecadal Oscillation (AMO), Indian Ocean Dipole (IOD), or Pacific
Decadal Oscillation (PDO) play a role in this relationship, we calculated the correlation
between climate indices and precipitation centroid (Tables S3–S6). The relationship is
significant over the Central Pacific for Niño3, IOD, and PDO indices because those indices
are most sensitive to the SST of the Central Pacific. The relationship between the AMO index
and precipitation is significant over the Atlantic Ocean (R = 0.44, p < 0.05), and surprisingly
over the Western Pacific with a negative slope (R = −0.70, pClimate 2022, 10, 30 9 of 12
Pacific may have been caused by abnormal warming in the North Atlantic. Our results
differ from previous research because they suggest that the Western Pacific ITCZ moves
southward during the warm phase of AMO. The importance of teleconnections in ocean
basins is discussed in several recent studies [46–49].
The high sensitivity of the Indian ITCZ suggests that future warming of the tropical
Indian Ocean [50] might have a significant effect on its position. A slowdown of the Atlantic
Meridional Overturning Circulation [46] could lead to a significant change in the location
of tropical convection.
While we have shown the zonal variations of the relationship between the ITCZ
position and local SST contrast, it remains an outstanding challenge to relate these ob-
servations to the global energetic framework. The energetic framework theorizes a rela-
tionship between the zonal-mean ITCZ position and cross-equatorial atmospheric energy
transport [16,31]. However, energy fluxes are not zonally uniform; there are substantial
variations of gross moist stability [51], as well as cross-equatorial mass and moist static
energy fluxes [52]. We hypothesize that the spatial distribution of SST plays a role in
partitioning the cross-equatorial atmospheric energy transport by longitude. Moreover,
the coupling of the ocean and atmosphere through wind-driven, oceanic cross-equatorial
cells has been examined in recent studies of the damped ITCZ migrations in coupled mod-
els [53–55] and may help explain the observed relationship between the ITCZ position and
local SST contrast found in the present study. In general, theories of the ITCZ position have
been framed in the literature as constituting either an ‘SST perspective’ [33,56,57] or an
‘energetic perspective’ [14,15,58]; yet there is considerable overlap between them [16,43,59].
We suggest that the ITCZ may be locally coupled with the SST but still fit into the larger
energetic framework.
Since the interhemispheric SST contrast is a useful indicator of ITCZ position, at least
in modern observations, we note a possible application to the paleoclimate. Using the
sensitivity of the ITCZ position to the SST contrast in an ocean basin or sector, one could
verify or controvert an inferred, past regional ITCZ shift with SST proxies. For example, if
the sensitivity of the Atlantic is similar to its present-day value (1.76◦ /K), then for a ~5◦ shift
of the ITCZ in a past climate, one would expect to see a ~3 K change in the SST contrast.
This method is analogous to that of McGee et al. [27] but applied to the regional (instead of
global) ITCZ position. Ultimately, this method may be useful for addressing the seeming
inconsistency of models and proxies in their representations of past ITCZ shifts. However,
determining the past sensitivities of the ITCZ position to the local SST contrast is not entirely
straightforward, since models do not always simulate realistic precipitation and SST in
the equatorial Eastern Pacific and Atlantic (the double-ITCZ bias) [30,60]. Nevertheless,
the connection between the ITCZ position and local SST contrast may prove useful for
constraining the regional movements of the ITCZ in past and future climates.
Supplementary Materials: The following supporting information can be downloaded at: https://
www.mdpi.com/article/10.3390/cli10030030/s1, Table S1: Seasonal Regression Outputs, Tables S2–S6:
Interannual Regression Outputs.
Author Contributions: Conceptualization, E.M. and J.-E.L.; methodology, E.M. and J.-E.L.; software,
E.M. and J.-E.L.; validation, E.M. and J.-E.L.; formal analysis, E.M. and J.-E.L.; investigation, E.M. and
J.-E.L.; resources, E.M. and J.-E.L.; data curation, E.M. and J.-E.L.; writing—original draft preparation,
E.M. and J.-E.L.; writing—review and editing, E.M. and J.-E.L.; visualization, E.M. and J.-E.L.;
supervision, E.M. and J.-E.L.; project administration, E.M. and J.-E.L.; funding acquisition, E.M. and
J.-E.L. All authors have read and agreed to the published version of the manuscript.
Funding: This research was funded by Brown University through the Karen T. Romer Undergraduate
Teaching and Research Award and NSF AGS-1944545.
Institutional Review Board Statement: Not applicable.
Informed Consent Statement: Not applicable.Climate 2022, 10, 30 10 of 12
Data Availability Statement: The TRMM and GPM precipitation data is provided by the NASA God-
dard Earth Services Data and Information Services Center (https://gpm.nasa.gov/data/directory,
accessed on 10 February 2022) the HadISST data by the Met Office Hadley Centre (https://www.
metoffice.gov.uk/hadobs/hadisst/, accessed on 10 February 2022) and climate indices by NOAA
Physical Science Laboratory website (https://psl.noaa.gov/gcos_wgsp/Timeseries/, accessed on 10
February 2022).
Acknowledgments: We thank Jacobel, A., Wu, M., Xu, R. and Kowalczyk, J. who lent their support
in many ways.
Conflicts of Interest: The authors declare no conflict of interest.
References
1. Waliser, D.E.; Gautier, C. A Satellite-Derived Climatology of the ITCZ. J. Clim. 1993, 6, 2162–2174. [CrossRef]
2. Schneider, T.; Bischoff, T.; Haug, G.H. Migrations and Dynamics of the Intertropical Convergence Zone. Nature 2014, 513, 45–53.
[CrossRef] [PubMed]
3. Frierson, D.M.W.; Hwang, Y.-T.; Fučkar, N.S.; Seager, R.; Kang, S.M.; Donohoe, A.; Maroon, E.A.; Liu, X.; Battisti, D.S. Contribution
of Ocean Overturning Circulation to Tropical Rainfall Peak in the Northern Hemisphere. Nat. Geosci. 2013, 6, 940–944. [CrossRef]
4. Haug, G.H.; Hughen, K.A.; Sigman, D.M.; Peterson, L.C.; Röhl, U. Southward Migration of the Intertropical Convergence Zone
Through the Holocene. Science 2001, 293, 1304–1308. [CrossRef]
5. Koutavas, A.; Lynch-Stieglitz, J. Variability of the Marine ITCZ over the Eastern Pacific during the Past 30,000 Years. In The
Hadley Circulation: Present, Past and Future; Diaz, H.F., Bradley, R.S., Eds.; Advances in Global Change Research; Springer: Berlin,
Germany, 2004; pp. 347–369, ISBN 978-1-4020-2944-8.
6. He, J.; Johnson, N.C.; Vecchi, G.A.; Kirtman, B.; Wittenberg, A.T.; Sturm, S. Precipitation Sensitivity to Local Variations in Tropical
Sea Surface Temperature. J. Clim. 2018, 31, 9225–9238. [CrossRef]
7. Neelin, J.D.; Held, I.M. Modeling Tropical Convergence Based on the Moist Static Energy Budget. Mon. Weather. Rev. 1987, 115,
3–12. [CrossRef]
8. Held, I.M. The Partitioning of the Poleward Energy Transport between the Tropical Ocean and Atmosphere. J. Atmos. Sci. 2001,
58, 943–948. [CrossRef]
9. Hill, S.A.; Ming, Y.; Held, I.M. Mechanisms of Forced Tropical Meridional Energy Flux Change. J. Clim. 2015, 28, 1725–1742.
[CrossRef]
10. Lindzen, R.S.; Nigam, S. On the Role of Sea Surface Temperature Gradients in Forcing Low-Level Winds and Convergence in the
Tropics. J. Atmos. Sci. 1987, 44, 2418–2436. [CrossRef]
11. Back, L.E.; Bretherton, C.S. On the Relationship between SST Gradients, Boundary Layer Winds, and Convergence over the
Tropical Oceans. J. Clim. 2009, 22, 4182–4196. [CrossRef]
12. Waliser, D.E.; Somerville, R.C.J. Preferred Latitudes of the Intertropical Convergence Zone. J. Atmos. Sci. 1994, 51, 1619–1639.
[CrossRef]
13. Chiang, J.C.H.; Bitz, C.M. Influence of High Latitude Ice Cover on the Marine Intertropical Convergence Zone. Clim. Dyn. 2005,
25, 477–496. [CrossRef]
14. Kang, S.M.; Held, I.M.; Frierson, D.M.W.; Zhao, M. The Response of the ITCZ to Extratropical Thermal Forcing: Idealized
Slab-Ocean Experiments with a GCM. J. Clim. 2008, 21, 3521–3532. [CrossRef]
15. Kang, S.M.; Frierson, D.M.W.; Held, I.M. The Tropical Response to Extratropical Thermal Forcing in an Idealized GCM: The
Importance of Radiative Feedbacks and Convective Parameterization. J. Atmos. Sci. 2009, 66, 2812–2827. [CrossRef]
16. Bischoff, T.; Schneider, T. Energetic Constraints on the Position of the Intertropical Convergence Zone. J. Clim. 2014, 27, 4937–4951.
[CrossRef]
17. Bischoff, T.; Schneider, T. The Equatorial Energy Balance, ITCZ Position, and Double-ITCZ Bifurcations. J. Clim. 2016, 29,
2997–3013. [CrossRef]
18. Adam, O.; Bischoff, T.; Schneider, T. Seasonal and Interannual Variations of the Energy Flux Equator and ITCZ. Part I: Zonally
Averaged ITCZ Position. J. Clim. 2016, 29, 3219–3230. [CrossRef]
19. Kang, S.M.; Shin, Y.; Xie, S.-P. Extratropical Forcing and Tropical Rainfall Distribution: Energetics Framework and Ocean Ekman
Advection. NPJ Clim. Atmos. Sci. 2018, 1, 20172. [CrossRef]
20. Byrne, M.P.; Pendergrass, A.G.; Rapp, A.D.; Wodzicki, K.R. Response of the Intertropical Convergence Zone to Climate Change:
Location, Width, and Strength. Curr. Clim. Chang. Rep. 2018, 4, 355–370. [CrossRef]
21. Marshall, J.; Donohoe, A.; Ferreira, D.; McGee, D. The Ocean’s Role in Setting the Mean Position of the Inter-Tropical Convergence
Zone. Clim. Dyn. 2014, 42, 1967–1979. [CrossRef]
22. Adam, O.; Bischoff, T.; Schneider, T. Seasonal and Interannual Variations of the Energy Flux Equator and ITCZ. Part II: Zonally
Varying Shifts of the ITCZ. J. Clim. 2016, 29, 7281–7293. [CrossRef]
23. Keshtgar, B.; Alizadeh-Choobari, O.; Irannejad, P. Seasonal and Interannual Variations of the Intertropical Convergence Zone
over the Indian Ocean Based on an Energetic Perspective. Clim. Dyn. 2020, 54, 3627–3639. [CrossRef]Climate 2022, 10, 30 11 of 12
24. Boos, W.R.; Korty, R.L. Regional Energy Budget Control of the Intertropical Convergence Zone and Application to Mid-Holocene
Rainfall. Nat. Geosci. 2016, 9, 892–897. [CrossRef]
25. Biasutti, M.; Voigt, A.; Boos, W.R.; Braconnot, P.; Hargreaves, J.C.; Harrison, S.P.; Kang, S.M.; Mapes, B.E.; Scheff, J.; Schumacher,
C.; et al. Global Energetics and Local Physics as Drivers of Past, Present and Future Monsoons. Nat. Geosci. 2018, 11, 392–400.
[CrossRef]
26. Roberts, W.H.G.; Valdes, P.J.; Singarayer, J.S. Can Energy Fluxes Be Used to Interpret Glacial/Interglacial Precipitation Changes in
the Tropics? Geophys. Res. Lett. 2017, 44, 6373–6382. [CrossRef]
27. McGee, D.; Donohoe, A.; Marshall, J.; Ferreira, D. Changes in ITCZ Location and Cross-Equatorial Heat Transport at the Last
Glacial Maximum, Heinrich Stadial 1, and the Mid-Holocene. Earth Planet. Sci. Lett. 2014, 390, 69–79. [CrossRef]
28. Sachs, J.P.; Sachse, D.; Smittenberg, R.H.; Zhang, Z.; Battisti, D.S.; Golubic, S. Southward Movement of the Pacific Intertropical
Convergence Zone AD 1400–1850. Nat. Geosci. 2009, 2, 519–525. [CrossRef]
29. Arbuszewski, J.A.; de Menocal, P.B.; Cléroux, C.; Bradtmiller, L.; Mix, A. Meridional Shifts of the Atlantic Intertropical Conver-
gence Zone since the Last Glacial Maximum. Nat. Geosci. 2013, 6, 959–962. [CrossRef]
30. Atwood, A.R.; Donohoe, A.; Battisti, D.S.; Liu, X.; Pausata, F.S.R. Robust Longitudinally Variable Responses of the ITCZ to a
Myriad of Climate Forcings. Geophys. Res. Lett. 2020, 47, e2020GL088833. [CrossRef]
31. Donohoe, A.; Marshall, J.; Ferreira, D.; Mcgee, D. The Relationship between ITCZ Location and Cross-Equatorial Atmospheric
Heat Transport: From the Seasonal Cycle to the Last Glacial Maximum. J. Clim. 2012, 26, 3597–3618. [CrossRef]
32. Donohoe, A.; Marshall, J.; Ferreira, D.; Armour, K.; McGee, D. The Interannual Variability of Tropical Precipitation and
Interhemispheric Energy Transport. J. Clim. 2014, 27, 3377–3392. [CrossRef]
33. Chiang, J.C.H.; Kushnir, Y.; Giannini, A. Deconstructing Atlantic Intertropical Convergence Zone Variability: Influence of the
Local Cross-Equatorial Sea Surface Temperature Gradient and Remote Forcing from the Eastern Equatorial Pacific. J. Geophys. Res.
Atmos. 2002, 107, ACL-3. [CrossRef]
34. Xie, S.-P.; Carton, J.A. Tropical Atlantic Variability: Patterns, Mechanisms, and Impacts. In Earth’s Climate; American Geophysical
Union (AGU): Washington, DC, USA, 2004; pp. 121–142. ISBN 978-1-118-66594-7.
35. Weller, E.; Cai, W.; Min, S.-K.; Wu, L.; Ashok, K.; Yamagata, T. More-Frequent Extreme Northward Shifts of Eastern Indian Ocean
Tropical Convergence under Greenhouse Warming. Sci. Rep. 2014, 4, 6087. [CrossRef]
36. Biasutti, M.; Voigt, A. Seasonal and CO2-Induced Shifts of the ITCZ: Testing Energetic Controls in Idealized Simulations with
Comprehensive Models. J. Clim. 2020, 33, 2853–2870. [CrossRef]
37. Hou, A.Y.; Kakar, R.K.; Neeck, S.; Azarbarzin, A.A.; Kummerow, C.D.; Kojima, M.; Oki, R.; Nakamura, K.; Iguchi, T. The Global
Precipitation Measurement Mission. Bull. Am. Meteorol. Soc. 2014, 95, 701–722. [CrossRef]
38. Rayner, N.A.; Parker, D.E.; Horton, E.B.; Folland, C.K.; Alexander, L.V.; Rowell, D.P.; Kent, E.C.; Kaplan, A. Global Analyses of
Sea Surface Temperature, Sea Ice, and Night Marine Air Temperature since the Late Nineteenth Century. J. Geophys. Res. Atmos.
2003, 108. [CrossRef]
39. Frierson, D.M.W.; Hwang, Y.-T. Extratropical Influence on ITCZ Shifts in Slab Ocean Simulations of Global Warming. J. Clim.
2011, 25, 720–733. [CrossRef]
40. Yoshimori, M.; Broccoli, A.J. Equilibrium Response of an Atmosphere–Mixed Layer Ocean Model to Different Radiative Forcing
Agents: Global and Zonal Mean Response. J. Clim. 2008, 21, 4399–4423. [CrossRef]
41. Xie, S.-P.; Peng, Q.; Kamae, Y.; Zheng, X.-T.; Tokinaga, H.; Wang, D. Eastern Pacific ITCZ Dipole and ENSO Diversity. J. Clim.
2018, 31, 4449–4462. [CrossRef]
42. Zhao, B.; Fedorov, A. The Seesaw Response of the Intertropical and South Pacific Convergence Zones to Hemispherically
Asymmetric Thermal Forcing. Clim. Dyn. 2020, 54, 1639–1653. [CrossRef]
43. Wei, H.-H.; Bordoni, S. Energetic Constraints on the ITCZ Position in Idealized Simulations with a Seasonal Cycle. J. Adv. Model.
Earth Syst. 2018, 10, 1708–1725. [CrossRef]
44. Wu, C.R.; Lin, Y.F.; Wang, Y.L.; Keenlyside, N.; Yu, J.Y. An Atlantic-driven rapid circulation change in the North Pacific Ocean
during the late 1990s. Sci. Rep. 2019, 9, 14411. [CrossRef] [PubMed]
45. Ruprich-Robert, Y.; Moreno-Chamarro, E.; Levine, X.; Bellucci, A.; Cassou, C.; Castruccio, F.; Davini, P.; Eade, R.; Gastineau, G.;
Hermanson, L.; et al. Impacts of Atlantic multidecadal variability on the tropical Pacific: A multi-model study. NPJ Clim. Atmos.
Sci. 2021, 4, 33. [CrossRef]
46. Hu, S.; Fedorov, A.V. Indian Ocean Warming Can Strengthen the Atlantic Meridional Overturning Circulation. Nat. Clim. Chang.
2019, 9, 747–751. [CrossRef]
47. Ferster, B.S.; Fedorov, A.V.; Mignot, J.; Guilyardi, E. Sensitivity of the Atlantic meridional overturning circulation and climate to
tropical Indian Ocean warming. Clim. Dyn. 2021, 57, 2433–2451. [CrossRef]
48. Wang, C. Three-ocean interactions and climate variability: A review and perspective. Clim. Dyn. 2019, 53, 5119–5136. [CrossRef]
49. Kang, S.M.; Hawcroft, M.; Xiang, B.; Hwang, Y.-T.; Cazes, G.; Codron, F.; Crueger, T.; Deser, C.; Hodnebrog, Ø.; Kim, H.; et al.
Extratropical-Tropical Interaction Model Intercomparison Project—Protocol and Initial Results. Bull. Am. Meteorol. Soc. 2019, 100,
2589–2606.
50. Roxy, M.K.; Ritika, K.; Terray, P.; Masson, S. The Curious Case of Indian Ocean Warming. J. Clim. 2014, 27, 8501–8509. [CrossRef]
51. Back, L.E.; Bretherton, C.S. Geographic Variability in the Export of Moist Static Energy and Vertical Motion Profiles in the Tropical
Pacific. Geophys. Res. Lett. 2006, 33. [CrossRef]Climate 2022, 10, 30 12 of 12
52. Heaviside, C.; Czaja, A. Deconstructing the Hadley Cell Heat Transport. Q. J. R. Meteorol. Soc. 2013, 139, 2181–2189. [CrossRef]
53. Green, B.; Marshall, J.; Campin, J.-M. The ‘Sticky’ ITCZ: Ocean-Moderated ITCZ Shifts. Clim. Dyn. 2019, 53, 1–19. [CrossRef]
54. Green, B.; Marshall, J. Coupling of Trade Winds with Ocean Circulation Damps ITCZ Shifts. J. Clim. 2017, 30, 4395–4411.
[CrossRef]
55. Schneider, T. Feedback of Atmosphere-Ocean Coupling on Shifts of the Intertropical Convergence Zone. Geophys. Res. Lett. 2017,
44, 11–644. [CrossRef]
56. Xie, S.-P.; Philander, S.G.H. A Coupled Ocean-Atmosphere Model of Relevance to the ITCZ in the Eastern Pacific. Tellus A Dyn.
Meteorol. Oceanogr. 1994, 46, 340–350. [CrossRef]
57. Philander, S.G.H.; Gu, D.; Lambert, G.; Li, T.; Halpern, D.; Lau, N.-C.; Pacanowski, R.C. Why the ITCZ Is Mostly North of the
Equator. J. Clim. 1996, 9, 2958–2972. [CrossRef]
58. Kang, S.M.; Held, I.M. Tropical Precipitation, SSTs and the Surface Energy Budget: A Zonally Symmetric Perspective. Clim. Dyn.
2012, 38, 1917–1924. [CrossRef]
59. Cvijanovic, I.; Chiang, J.C.H. Global Energy Budget Changes to High Latitude North Atlantic Cooling and the Tropical ITCZ
Response. Clim. Dyn. 2013, 40, 1435–1452. [CrossRef]
60. Adam, O.; Schneider, T.; Brient, F. Regional and Seasonal Variations of the Double-ITCZ Bias in CMIP5 Models. Clim. Dyn. 2018,
51, 101–117. [CrossRef]You can also read