NORTHERN CAPE SOCIO-ECONOMIC REVIEW AND OUTLOOK 2021 - Northern Cape Provincial Government
←
→
Page content transcription
If your browser does not render page correctly, please read the page content below
Northern Cape Provincial Government

  NORTHERN CAPE
  SOCIO-ECONOMIC
REVIEW AND OUTLOOK
        2021

   We serve with passion. We deliver on time.
Northern Cape Socio-Economic Review and Outlook 2021

           NORTHERN CAPE
   PROVINCIAL GOVERNMENT

  Northern Cape
 Socio-Economic
Review and Outlook
       2021

      10 March 2021
                            i
Northern Cape Socio-Economic Review and Outlook 2021

PR63/2021
ISBN: 978-0-621-49242-2

The Northern Cape Socio-Economic Review and Outlook 2021 is compiled using the latest
available information from departmental and other sources. Some of this information is unaudited
or subject to revision.

For further information and to obtain additional copies of this document, please contact:
Northern Cape Provincial Treasury
Private Bag X5054
Kimberley, 8300
Telephone: 053 830 8358

                                                  ii
Northern Cape Socio-Economic Review and Outlook 2021

Foreword
The global pandemic (Covid-19) had a negative impact on the economy, employment and lives
across the world. The International Monetary Fund (IMF) estimated that the world output contracted
by 3.5 per cent in 2020. Advanced Economies are estimated to have contracted by 4.9 per cent,
whereas Emerging Market and Developing Economies are estimated to have contracted by 2.4 per
cent. Positive growth is projected for 2021 and 2022.

In the 2020 Medium Term Budget Policy Statement (MTBPS), National Treasury estimated that the
economy of the country would grow negatively at -7.8 per cent in 2020, however the figure has been
revised to -7.2 per cent in the 2021 budget statement. The country’s output is projected to grow
by 3.3 per cent this year, 2.2 per cent in 2022 and 1.6 per cent in 2023. The roll-out of vaccines
is expected to play a very important role in saving lives as well as setting the country on a path of
economic recovery.

Although the provincial unemployment rate for the fourth quarter of 2020 was lower than the national
rate, it was still an alarming 28.7 per cent. From quarter 3 of 2020, the unemployment rate increased
by 5.6 percentage points, with the number of employed people increasing by 21 000 and the unem-
ployed increasing by 38 000.

The negative impact of the health crisis on the economy and the job market had many individuals
and companies facing difficult challenges in this period. It is under these constraining conditions that
departments are urged to continuously find new ways to reprioritise and use the limited resources
effectively and efficiently.

AB Vosloo, MPL

MEC for Finance, Economic Development and Tourism

                                                   iii
Northern Cape Socio-Economic Review and Outlook 2021

Table of Contents
List of Figures................................................................................................................................................ v
List of Tables..............................................................................................................................................vi
List of Abbreviations..................................................................................................................................vii
Executive Summary ..................................................................................................................................viii
Chapter 1: Demography .............................................................................................................................1
1.1 Introduction ..............................................................................................................................................................1
1.2 Population Profile .....................................................................................................................................................1
1.2.1 Population .............................................................................................................................................................1
1.2.2 Fertility ...................................................................................................................................................................6
1.2.3 Migration ................................................................................................................................................................7
1.2.4 Population Density .................................................................................................................................................8
1.3 Life Expectancy ........................................................................................................................................................8
1.4 Conclusion ................................................................................................................................................................9
Chapter 2: Economy ...................................................................................................................................10
2.1 Introduction ..............................................................................................................................................................10
2.2 Global Economic Outlook ........................................................................................................................................10
2.3 National Economy ...................................................................................................................................................11
2.3.1 National Industry Growth Trends ..........................................................................................................................12
2.3.2 Inflation ................................................................................................................................................................13
2.4 Provincial Economy ................................................................................................................................................13
2.4.1 Sector Contributions ............................................................................................................................................16
2.5 Conclusion ..............................................................................................................................................................18
Chapter 3: Labour .......................................................................................................................................19
3.1 Introduction ..............................................................................................................................................................19
3.2 National Labour Characteristics ..............................................................................................................................19
3.2.1 Labour Status .......................................................................................................................................................19
3.2.2 Unemployment .....................................................................................................................................................21
3.2.3 Employment ..........................................................................................................................................................21
3.3 Provincial Labour Characteristics ............................................................................................................................22
3.3.1 Labour Status .......................................................................................................................................................22
3.3.2 Unemployment .....................................................................................................................................................23
3.3.3 Employment .........................................................................................................................................................24
3.3.3.1 Informal Employment .........................................................................................................................................26
3.4 Conclusion ...............................................................................................................................................................27
Chapter 4: Human Development ..............................................................................................................28
4.1 Introduction ..............................................................................................................................................................28
4.2 Poverty .....................................................................................................................................................................28
4.3 Development Indicators ...........................................................................................................................................29
4.3.1 Human Development Index ..................................................................................................................................29
4.3.2 Income Distribution ...............................................................................................................................................30
4.4 Access to Services ...................................................................................................................................................32
4.4.1 Education ..............................................................................................................................................................32
4.4.2 Housing .................................................................................................................................................................33
4.5 Social Security .........................................................................................................................................................34
4.6 Access to Basic Services .........................................................................................................................................34
4.7 Conclusion ...............................................................................................................................................................36

                                                                                        iv
Northern Cape Socio-Economic Review and Outlook 2021

List of Figures
Chapter 1: Demography
Figure 1.1: Mid-Year Population Estimates by Province, 2019 and 2020
Figure 1.2: Number of Households in Northern Cape and South Africa (‘000), 2002-2019
Figure 1.3: Population Pyramid for Northern Cape, 2019
Figure 1.4: Population Pyramid for Namakwa District Municipality, 2019
Figure 1.5: Population Pyramid for Pixley ka Seme District Municipality, 2019
Figure 1.6: Population Pyramid for ZF Mgcawu District Municipality, 2019
Figure 1.7: Population Pyramid for Frances Baard District Municipality, 2019
Figure 1.8: Population Pyramid for John Taolo Gaetsewe District Municipality, 2019
Figure 1.9: Average Total Fertility Rate by Province, 2001-2006, 2006-2011, 2011-2016 and 2016-2021
Figure 1.10: Net Migration by Province, 2006-2011, 2011-2016 and 2016-2021
Figure 1.11: Population Density for Northern Cape and South Africa, 2010-2019
Figure 1.12: Average Life Expectancy for Northern Cape, 2001-2006, 2006-2011, 2011-2016 and 2016-
2021

Chapter 2: Economy
Figure 2.1: South African Inflation, January 2020-January 2021
Figure 2.2: GDP Growth Rates of South Africa and Northern Cape, 2009-2023
Figure 2.3: Provincial Contributions to South Africa’s GDP, 2009 and 2018
Figure 2.4: Contributions by District Municipalities to Provincial GDP, 2019
Figure 2.5: Industry Contributions to Total Industries per District, 2019

Chapter 3: Labour
Figure 3.1: Unemployment Rate by Province, 2019 Q4, 2020 Q3 and 2020 Q4
Figure 3.2: Unemployment Rate for South Africa and Northern Cape, 2011 Q4-2020 Q4
Figure 3.3: Employment by Industry for Northern Cape, 2020 Q4
Figure 3.4: Employment by Industry per District, 2019

Chapter 4: Human Development
Figure 4.1: Human Development Index per Province, 2010 and 2019
Figure 4.2: Human Development Index per District, 2010 and 2019
Figure 4.3: Gini-Coefficient per Province, 2010 and 2019
Figure 4.4: Annual Income Distribution for Northern Cape, 2019
Figure 4.5: Households by Source of Income for Northern Cape and South Africa, 2019
Figure 4.6: Adult Literacy Rate per Province, 2010 and 2019
Figure 4.7: Households by Housing Type for Northern Cape and South Africa, 2019
Figure 4.8: Social Security Services per Province, 2019
Figure 4.9: Household Access to Basic Services in Northern Cape and South Africa, 2017 and 2019

                                                       v
Northern Cape Socio-Economic Review and Outlook 2021

List of Tables
Chapter 1: Demography
Table 1.1: Total Population by District in Northern Cape, 2019
Table 1.2: Population by Race and Gender for Northern Cape and South Africa, 2019

Chapter 2: Economy
Table 2.1: Overview of World Economic Outlook Projections, 2019-2022
Table 2.2: Real Gross Domestic Expenditure, 2019 and 2020
Table 2.3: Quarterly Growth in National GDP per Industry, 2018 Q4-2020 Q3
Table 2.4: Provincial Sectoral Growth and Contributions to GDP, 2017 and 2018

Chapter 3: Labour
Table 3.1: Labour Market Status for South Africa, 2019 Q4, 2020 Q3 and 2020 Q4
Table 3.2: Discouraged Work-Seekers, Absorption Rate and Labour Force Participation Rate per Province,
2020 Q4
Table 3.3: Employment by Industry for South Africa, 2019 Q4, 2020 Q3 and 2020 Q4
Table 3.4: Labour Market Status for Northern Cape, 2019 Q4, 2020 Q3 and 2020 Q4
Table 3.5: Number Employed, Unemployed and Unemployment Rate per District, 2019
Table 3.6: Unemployment Rate by Race and Gender for Northern Cape, 2010 and 2019
Table 3.7: Employment by Industry for Northern Cape, 2019 Q4, 2020 Q3 and 2020 Q4
Table 3.8: Informal Employment by Industry for Northern Cape, 2010 and 2019

Chapter 4: Human Development
Table 4.1: Poverty Indicators by Province, 2010 and 2019
Table 4.2: Poverty Indicators by District, 2010 and 2019
Table 4.3: Education Attainment for Individuals Aged 20 Years and Older, 2019
Table 4.4: Education Attainment per District, 2010 and 2019
Table 4.5: Access to Sanitation by Toilet Type, 2019

                                                       vi
Northern Cape Socio-Economic Review and Outlook 2021

List of Abbreviations
EC         Eastern Cape
FS         Free State
GDP        Gross Domestic Product
GHS        General Household Survey
GP         Gauteng
HDI        Human Development Index
IMF        International Monetary Fund
KZN        KwaZulu-Natal
LP         Limpopo
MP         Mpumalanga
NC         Northern Cape
NSC        National Senior Certificate
NW         North West
Q1         Quarter 1
Q2         Quarter 2
Q3         Quarter 3
Q4         Quarter 4
QLFS       Quarterly Labour Force Survey
SA         South Africa
SARB       South African Reserve Bank
Stats SA   Statistics South Africa
WC         Western Cape

                                                  vii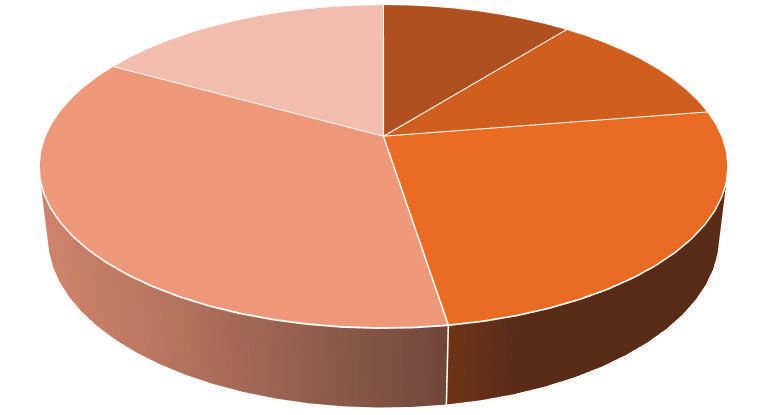
Northern Cape Socio-Economic Review and Outlook 2021

Executive Summary
Northern Cape, like most provinces, experienced an increase in its population size between 2019 and
2020. The province however remains the one with the smallest share of the national total population,
accounting for only 2 per cent. The Frances Baard district had the largest share (32.6 per cent) of the
province’s total population in 2019, followed by ZF Mgcawu (21.1 per cent). As the province’s population
had been increasing from one year to the other, so did the number of households. The Black African
population group represented the largest share of South Africa’s and Northern Cape’s total population.
Regarding age groups, children aged 0 to 4 years represented the largest age cohort in the province,
while those between 70 and 74 years represented the smallest share. The province’s population density
was very low but has been rising every year from 2010 to 2019. Looking at life expectancy, females had
a longer life expectancy in the province in comparison to males.

World output is projected to grow by 5.5 per cent in 2021, following the estimated contraction of 3.5 per
cent in 2020 due to the economic crisis brought about by the global Covid-19 pandemic. According to
National Treasury, the national economy is estimated to have contracted by a significant 7.2 per cent
in 2020, but is expected to show some recovery in 2021 with the economy projected to grow by 3.3 per
cent. Before the start of the pandemic, South Africa was already in a recession. Gauteng made the largest
contribution to the national economy in 2018, while the Northern Cape made the smallest. The provincial
economy recorded low economic growth of 0.5 per cent in 2018 after growing at a higher rate in 2017 at
2.8 per cent. Provincially, Mining and quarrying remained the largest contributor to the provincial GDP. The
district that made the largest contribution to the economy of the province, was Frances Baard. The largest
industry in Frances Baard and Pixley ka Seme was Community services in 2019, while in Namakwa, ZF
Mgcawu and John Taolo Gaetsewe, Mining was the largest.

The national unemployment rate was a concerning 32.5 per cent in the fourth quarter of 2020, which was
higher than the provincial unemployment rate of 28.7 per cent. On a national level, the number of unem-
ployed people increased by 701 000 from the previous quarter while it increased by 38 000 provincially.
The industry that employed the largest share of the workers was Community and social services both
nationally and provincially. In 2019, females recorded a higher unemployment rate than males, while the
Coloured population group recorded the highest unemployment rate among the population groups in the
province. Frances Baard followed by ZF Mgcawu contributed the largest respective shares to total em-
ployment in the province. The district that recorded the highest unemployment rate in the province in 2019
was Frances Baard.

The number and percentage of people living in poverty increased in South Africa between 2010 and 2019.
HDI in the province showed an improvement, while income inequality measured by the Gini Coefficient
increased slightly. The adult literacy rate was above 90 percent in all provinces in South Africa in 2019,
with the Northern Cape improving its literacy rate from 83.6 per cent in 2010 to 91.6 per cent in 2019. The
province had 33.5 per cent of people and 55.9 per cent of households accessing social security services
in 2019. In the Northern Cape, the percentage of people with access to water, electricity and sanitation
respectively decreased from 2017 to 2019.

                                                    viii
Northern Cape Socio-Economic Review and Outlook 2021

Chapter 1: Demography
1.1 Introduction

This chapter of the Northern Cape Socio-Economic Review and Outlook of 2021 provides the
demographic profile of the Northern Cape Province. In some cases, a comparison is made with the
country (South Africa) and other provinces. The analysis for the demographic indicators is imperative
in that it provides guidance and assists government and other stakeholders with planning in terms of
resource allocation and the delivery of basic services.

1.2 Population Profile

1.2.1 Population

The South African population increased from one year to the other, which is the same for most of
the provinces, including the Northern Cape. Some of the factors that can contribute to an increase
in the population size are increased fertility, migration and a decline in mortality. The graph below
depicts the mid-year population estimates for the nine provinces in the country for 2019 and 2020.

Figure 1.1: Mid-Year Population Estimates by Province, 2019 and 2020
                      Mid-Year Population Estimates by Province, 2019 and 2020

     LP
    MP
    GP
    NW
   KZN
     FS
    NC
    EC
    WC
          0                    5 000 000               10 000 000                   15 000 000               20 000 000
             WC            EC          NC          FS          KZN              NW           GP          MP          LP
  2020    7 005 741     6 734 001   1 292 786   2 928 903   11 531 628       4 108 816   15 488 137   4 679 786   5 852 553
  2019    6 844 272     6 712 276   1 263 875   2 887 465   11 289 086       4 027 160   15 176 115   4 592 187   5 982 584

Source: Stats SA, Mid-Year Population Estimates 2019 & 2020

Gauteng remains the largest in terms of the population size in South Africa. In 2020, the province’s
population increased to 15.488 million which represented about 26 per cent of the national population.
KwaZulu-Natal had the second largest population, followed by Western Cape and Eastern Cape.
Northern Cape remains the province with the smallest population size, estimated at 1.293 million
(2 per cent of the country’s population). Eight provinces experienced an increase in their population
sizes between 2019 and 2020, with Gauteng having the largest (312 022) while Eastern Cape had
the smallest (21 725). Limpopo was the only province which had a decrease in its population size.

                                                                         1
Northern Cape Socio-Economic Review and Outlook 2021
It is also of great importance to have knowledge of how the province’s population is distributed
across its districts. In Table 1.1, the number of people in each district as well as its share of the
population of the province is presented for 2019.
Table 1.1: Total Population by District in Northern Cape, 2019
Number Share (%)
Namakwa 139 381 10.4
Pixley ka Seme 220 842 16.4
ZF Mgcawu 284 391 21.1
Frances Baard 438 901 32.6
John Taolo Gaetsewe 261 363 19.4
Source: IHS Markit, 2021 [Regional eXplorer, Version 2070 (2.6p)] and own calculations
Frances Baard district had the largest population size of the five districts in the province. In 2019,
the district represented 32.6 per cent of the total population provincially. ZF Mgcawu district followed
at 21.1 per cent. The district with the smallest population size is Namakwa accounting for only 10.4
per cent.
On the graph below, the number of household are shown for the Northern Cape and South Africa for
the period from 2002 to 2019.
Figure 1.2: Number of Households in Northern Cape and South Africa (‘000), 2002-2019
Number of Households in Northern Cape and South Africa ('000), 2002-2019
18 000
16 000
14 000
12 000
10 000
('000)
8 000
6 000
4 000
2 000
0
2002 2003 2004 2005 2006 2007 2008 2009 2010 2011 2012 2013 2014 2015 2016 2017 2018 2019
SA 11 194 11 459 11 718 11 977 12 243 12 522 12 819 13 128 13 456 13 797 14 152 14 521 14 904 15 307 15 744 16 199 16 671 17 163
NC 247 252 257 261 266 272 277 282 287 293 299 305 311 318 325 333 342 350
Source: Stats SA, GHS 2019
South Africa and Northern Cape’s population has been increasing from one year to the other for
the period under study, with the number of households also increasing annually. Provincially, the
number of households increased from 247 000 in 2002 to 350 000 in 2019, which is an increase
of 103 000. On a national level, the number of households increased by 5.969 million from 11.194
million in 2002 to 17.163 million in 2019.
2Northern Cape Socio-Economic Review and Outlook 2021
Table 1.2 below presents the population characteristics by race and gender for the Northern Cape
and South Africa for 2019.
Table 1.2: Population by Race and Gender for Northern Cape and South Africa, 2019
Northern Cape South Africa
Male Female Total Male Female Total
('000) ('000) ('000) ('000) ('000) ('000)
Black African 328 324 653 23 215 24 239 47 454
Coloured 242 254 496 2 462 2 619 5 080
Indian/Asian * * * 745 706 1 451
White 46 51 97 2 161 2 283 4 444
Total 616 630 1 246 28 582 29 847 58 429
Source: Stats SA, GHS 2019
Values based on 3 or less unweighted cases are considered too small to provide accurate estimates, and
therefore are replaced by asterisks
The province had more females than males in 2019, which was the same for the country. Regarding
the population groups, the Black African group represented the largest share of the country’s
population, whereas Indians/Asians were the smallest. This was the same for the Northern Cape.
The population characteristics of the province as well as the district municipalities are visually
represented by the pyramids below for 2019.
Figure 1.3: Population Pyramid for Northern Cape, 2019
Population Pyramid for Northern Cape, 2019
Male Female
75+
70-74
65-69
60-64
55-59
50-54
45-49
40-44
35-39
30-34
25-29
20-24
15-19
10-14
05-09
00-04
80 000 60 000 40 000 20 000 0 20 000 40 000 60 000 80 000
Source: IHS Markit, 2021 [Regional eXplorer Version 2070 (2.6p)]
The province’s population pyramid is expansive, as it displays a young and growing population.
Children between 0 and 4 years represented the largest cohort (132 020) in the province in 2019,
while those aged 70 to 74 constituted the smallest (27 035). Those aged 5 to 9 years had the second
largest population size (128 668). The large number of young people (children) suggest that the
province has a high fertility rate.
3Northern Cape Socio-Economic Review and Outlook 2021
Figure 1.4: Population Pyramid for Namakwa District Municipality, 2019
Population Pyramid for Namakwa District Municipality, 2019
Male Female
75+
70-74
65-69
60-64
55-59
50-54
45-49
40-44
35-39
30-34
25-29
20-24
15-19
10-14
05-09
00-04
6 000 4 000 2 000 0 2 000 4 000 6 000
Source: IHS Markit, 2021 [Regional eXplorer Version 2070 (2.6p)]
Namakwa has a constrictive population pyramid, indicating an elderly and shrinking population. The
district had more females than males, shown by a slight skewness of the pyramid to the right. Youth
aged 25 to 29 years represented the district’s largest age group, whereas old people between 70
and 74 years represented the smallest.
Figure 1.5: Population Pyramid for Pixley ka Seme District Municipality, 2019
Population Pyramid for Pixley ka Seme District Municipality, 2019
Male Female
75+
70-74
65-69
60-64
55-59
50-54
45-49
40-44
35-39
30-34
25-29
20-24
15-19
10-14
05-09
00-04
15 000 10 000 5 000 0 5 000 10 000 15 000
Source: IHS Markit, 2021 [Regional eXplorer Version 2070 (2.6p)]
Pixley ka Seme’s pyramid is slightly skewed to the right as females were more than males in this
district in 2019, also with a broad base. Children aged 5 to 9 constituted the district’s largest cohort,
followed by those between 0 and 4 years, while those aged 70 to 74 years represented the smallest
cohort.
4Northern Cape Socio-Economic Review and Outlook 2021
Figure 1.6: Population Pyramid for ZF Mgcawu District Municipality, 2019
Population Pyramid for ZF Mgcawu District Municipality, 2019
Male Female
75+
70-74
65-69
60-64
55-59
50-54
45-49
40-44
35-39
30-34
25-29
20-24
15-19
10-14
05-09
00-04
20 000 15 000 10 000 5 000 0 5 000 10 000 15 000
Source: IHS Markit, 2021 [Regional eXplorer Version 2070 (2.6p)]
ZF Mgcawu has a stationary, or near stationary, population pyramid indicating little or no population
growth. Unlike other districts, ZF Mgcawu had a different pattern whereby males were more than
females. This is shown by the skewness of the pyramid to the left. Youth between 30 and 34 years
represented the district’s largest age cohort in 2019, while people aged 70 to 74 years represented
the smallest.
Figure 1.7: Population Pyramid for Frances Baard District Municipality, 2019
Population Pyramid for Frances Baard District Municipality, 2019
Male Female
75+
70-74
65-69
60-64
55-59
50-54
45-49
40-44
35-39
30-34
25-29
20-24
15-19
10-14
05-09
00-04
30 000 20 000 10 000 0 10 000 20 000 30 000
Source: IHS Markit, 2021 [Regional eXplorer Version 2070 (2.6p)]
For Frances Baard, children aged 0 to 4 years constituted the age group with the largest number of
people, followed by those between 5 and 9 years. Those aged 70 to 74 years was again the smallest
group like in other districts. Females were more than their male counterparts.
5Northern Cape Socio-Economic Review and Outlook 2021
Figure 1.8: Population Pyramid for John Taolo Gaetsewe District Municipality, 2019
Population Pyramid for John Taolo Gaetsewe District Municipality, 2019
Male Female
75+
70-74
65-69
60-64
55-59
50-54
45-49
40-44
35-39
30-34
25-29
20-24
15-19
10-14
05-09
00-04
20 000 15 000 10 000 5 000 0 5 000 10 000 15 000 20 000
Source: IHS Markit, 2021 [Regional eXplorer Version 2070 (2.6p)]
Children aged 0 to 4 years represented the largest age cohort in John Taolo Gaetsewe, followed by
those aged 5 to 9 years, while the 70 to 74 years age cohort represented the smallest. The district
had more females than males.
1.2.2 Fertility
Figure 1.9 illustrates the average total fertility rate for all the provinces from 2001 to 2021.
Figure 1.9: Average Total Fertility Rate by Province, 2001-2006, 2006-2011, 2011-2016 and
2016-2021
Average Total Fertility Rate by Province, 2001-2006, 2006-2011,
2011-2016, 2016-2021
LP
MP
GP
NW
KZN
FS
NC
EC
WC
0.00 0.50 1.00 1.50 2.00 2.50 3.00 3.50
WC EC NC FS KZN NW GP MP LP
2016-2021 2.01 2.85 2.61 2.34 2.78 2.68 1.90 2.44 2.90
2011-2016 2.14 2.98 2.74 2.48 2.82 2.77 2.10 2.53 3.13
2006-2011 2.45 3.26 3.12 2.85 3.01 3.23 2.24 2.95 3.39
2001-2006 2.28 3.13 3.06 2.69 2.94 3.00 2.18 2.85 3.20
Source: Stats SA, Mid-Year Population Estimates 2020
6Northern Cape Socio-Economic Review and Outlook 2021
All the provinces experienced an increase in the average total fertility rate between the 2001 to 2006
and 2006 to 2011 periods, followed by a decrease to the 2011 to 2016 period. A further decline is
expected to the 2016 to 2021 period. Limpopo province had the highest average total fertility rates
while Gauteng had the lowest rates.
1.2.3 Migration
The net migration for the nine provinces is shown in Figure 1.10 below.
Figure 1.10: Net Migration by Province, 2006-2011, 2011-2016 and 2016-2021
Net Migration by Province, 2006-2011, 2011-2016 and 2016-2021
LP
MP
GP
NW
KZN
FS
NC
EC
WC
-500 000 0 500 000 1 000 000 1 500 000
WC EC NC FS KZN NW GP MP LP
2016-2021 290 555 -322 957 11 554 -29 929 -88 163 112 881 980 398 61 034 -189 112
2011-2016 297 601 -326 841 10 628 -31 295 -70 880 117 813 1 026 451 67 736 -174 868
2006-2011 276 434 -342 000 8 163 -41 302 -76 296 102 778 974 765 56 049 -206 374
Source: Stats SA, Mid-Year Population Estimates 2020
Only five provinces recorded positive net migration during the periods under review. These are
Mpumalanga, Gauteng, North-West, Northern Cape as well as Western Cape. This indicates that
the number of in-migrants (that is people who were moving into these provinces) was more than
the out-migrants (people moving out of the province). Limpopo, KwaZulu-Natal, Free State and
Eastern Cape had negative net migration, implying that they had a larger number of out-migrants in
comparison to in-migrants. Gauteng had the largest number of people migrating into the province.
7Northern Cape Socio-Economic Review and Outlook 2021
1.2.4 Population Density
The following graph portrays the population density for the Northern Cape and South Africa from
2010 to 2019.
Figure 1.11: Population Density for Northern Cape and South Africa, 2010-2019
Population Density for Northern Cape and South Africa, 2010-2019
50.00
45.00
40.00
35.00
30.00
25.00
20.00
15.00
10.00
5.00
0.00
2010 2011 2012 2013 2014 2015 2016 2017 2018 2019
NC 3.02 3.08 3.15 3.22 3.28 3.35 3.41 3.48 3.54 3.61
SA 41.84 42.57 43.29 44.00 44.72 45.44 46.15 46.88 47.59 48.30
Source: IHS Markit, 2021 [Regional eXplorer Version 2070 (2.6p)]
The Northern Cape’s population density has been steadily increasing, albeit slightly, from one year
to the next over the period under review. This is due to the increase in the population size over this
period. The province’s population density is low as it has the smallest population size and the largest
land size in the country. The continuously increasing population density can also be observed for
South Africa over the entire review period.
1.3 Life Expectancy
In Figure 1.12 the average life expectancy at birth by gender is depicted for the Northern Cape
Province.
Figure 1.12: Average Life Expectancy for Northern Cape, 2001-2006, 2006-2011, 2011-2016
and 2016-2021
Average Life Expectancy for Northern Cape, 2001-2006, 2006-
2011, 2011-2016 and 2016-2021
70.0
60.0
50.0
40.0
30.0
20.0
10.0
0.0
2001-2006 2006-2011 2011-2016 2016-2021
Males 51.9 52.7 56.2 58.6
Females 56.9 57.0 62.0 64.8
Source: Stats SA, Mid-Year Population Estimates 2020
8Northern Cape Socio-Economic Review and Outlook 2021
The Northern Cape’s average life expectancy has been increasing for both males and females from
the 2001 to 2006 to 2016 to 2021 periods. Males have a shorter life expectancy in comparison to
females for the period under review.
1.4 Conclusion
Northern Cape, like most provinces, experienced an increase in its population size between 2019
and 2020. The province however remains the one with the smallest share of the national total
population, accounting for only 2 per cent. The Frances Baard district had the largest share (32.6
per cent) of the province’s total population in 2019, followed by ZF Mgcawu (21.1 per cent). As
the province’s population had been increasing from one year to the other, so did the number of
households. The Black African population group represented the largest share of South Africa’s and
Northern Cape’s total population. Regarding age groups, children aged 0 to 4 years represented the
largest age cohort in the province, while those between 70 and 74 years represented the smallest
share. The province’s population density was very low but has been rising every year from 2010 to
2019. Looking at life expectancy, females had a longer life expectancy in the province in comparison
to males.
9Northern Cape Socio-Economic Review and Outlook 2021
Chapter 2: Economy
2.1 Introduction
With the outbreak of the global Coronavirus disease 2019 (Covid-19) pandemic, the entire global
economy has been struggling. Many countries have been implementing lockdowns in an attempt
to minimise the impact of the pandemic on their populations and healthcare systems. This has
been accompanied by very bad economic performance across many countries. The South African
economy was not spared, and 2020 recorded very low levels of economic performance. Even
before the pandemic hit, the South African economy was already struggling. This chapter provides
an analysis of global, national and provincial economic conditions which could assist policy and
decision makers to address the challenges that the economy is facing.
2.2 Global Economic Outlook
A summary of the world economic outlook forecasts for selected nations from 2019 to 2022 is given
in Table 2.1.
Table 2.1: Overview of World Economic Outlook Projections, 2019-2022
Estimates Projections
Region/Country
2019 2020 2021 2022
World Output 2.8 -3.5 5.5 4.2
Advanced Economies 1.6 -4.9 4.3 3.1
United States 2.2 -3.4 5.1 2.5
Euro Area 1.3 -7.2 4.2 3.6
Japan 0.3 -5.1 3.1 2.4
United Kingdom 1.4 -10.0 4.5 5.0
Emerging Market and Developing Economies 3.6 -2.4 6.3 5.0
Emerging and Developing Asia 5.4 -1.1 8.3 5.9
China 6.0 2.3 8.1 5.6
India 4.2 -8.0 11.5 6.8
Emerging and Developing Europe 2.2 -2.8 4.0 3.9
Russia 1.3 -3.6 3.0 3.9
Latin America and the Carribean 0.2 -7.4 4.1 2.9
Brazil 1.4 -4.5 3.6 2.6
Sub-Saharan Africa 3.2 -2.6 3.2 3.9
Nigeria 2.2 -3.2 1.5 2.5
South Africa 0.2 -7.5 2.8 1.4
Per cent change
Source: IMF World Economic Outlook Update, January 2021
The International Monetary Fund (IMF) estimates that in 2020 world output contracted by 3.5 per
cent and they project that world output will grow by 5.5 per cent in 2021 and 4.2 per cent in 2022.
10Northern Cape Socio-Economic Review and Outlook 2021
Advanced economies are estimated to have contracted by 4.9 per cent in 2020 with projected growth
of 4.3 per cent in 2021 and 3.1 per cent in 2022. Emerging markets and developing economies saw
a 2.4 per cent contraction in output in 2020 with a projection of 6.3 per cent growth in 2021 and 5.0
per cent growth in 2022. The IMF estimates that Sub-Saharan Africa’s output contracted by 2.6 per
cent in 2020 and is projected to grow by 3.2 per cent in 2021 and 3.9 per cent in 2022. According to
the IMF, South Africa saw a contraction of 7.5 per cent in output in 2020 and is projected to grow by
2.8 per cent in 2021 and 1.4 per cent in 2022. Of the countries reviewed in the table above, China
is the only one that is estimated to record positive growth in 2020.
According to the IMF, access to medical interventions, effectiveness of policy support, exposure
to cross-country spill-overs as well as structural characteristics entering the crisis is expected to
play a role in the strength of recovery of countries. They also indicate that renewed waves and new
variants of the virus pose concerns for the outlook even though recent vaccine approvals improved
hopes of a turnaround in the pandemic later in the year.
2.3 National Economy
Table 2.2 shows the real gross domestic expenditure from the first quarter of 2019 to the third
quarter of 2020.
Table 2.2: Real Gross Domestic Expenditure, 2019 and 2020
2019 2020
Components
Q1 Q2 Q3 Q4 Q1 Q2 Q3
Final household consumption expenditure -0.9 2.5 0.3 1.4 0.2 -52.4 69.5
Final general government consumption expenditure 2.2 2.7 1.4 -0.2 1.8 -2.1 0.7
Gross fixed capital formation -4.1 5.8 4.1 -10.0 -18.6 -59.8 26.5
Gross domestic expenditure 4.7 9.1 -4.5 -4.6 -6.0 -42.9 23.7
Quarter-to-quarter percentage change at seasonally adjusted annualised rates
Source: SARB Quarterly Bulletin, December 2020
Final household consumption expenditure contracted in the first quarter of 2019 by 0.9 per cent and
experienced positive growth for the last three quarters of 2019, recording 1.4 per cent growth in the
fourth quarter. In 2020, it grew by 0.2 per cent in the first quarter, but contracted by a significant
52.4 per cent in the second quarter. During this quarter, very strict lockdown regulations relating to
Covid-19 were enforced. Accompanying the easing of some restrictions placed on the economy,
Final household consumption expenditure grew significantly by 69.5 per cent in the third quarter
of 2020. Final general government consumption expenditure recorded positive growth for the first
three quarters of 2019 before contracting by 0.2 per cent in the fourth quarter. The year 2020 saw
growth of 1.8 per cent in the first quarter and then a contraction in the second quarter of -2.1 per cent
before growing by 0.7 per cent in the third quarter of 2020.
Gross fixed capital formation started 2019 with a contraction of -4.1 per cent in the first quarter,
growing positively in the second and third quarters before contracting by 10.0 per cent in the fourth
11Northern Cape Socio-Economic Review and Outlook 2021
quarter. In 2020, Gross fixed capital formation contracted by 18.6 per cent in the first quarter followed
by an even more significant contraction of -59.8 per cent in the second quarter. In the third quarter
of 2020 it grew by 26.5 per cent. Gross domestic expenditure recorded positive growth in the first
and second quarters of 2019 before contracting in the third and fourth quarters. In 2020, it recorded
negative growth of -6.0 per cent in the first quarter and -42.9 per cent in the second quarter before
experiencing positive growth of 23.7 per cent in the third quarter.
2.3.1 National Industry Growth Trends
Table 2.3 shows the industry growth figures per quarter from the fourth quarter of 2018 up to and
including the third quarter of 2020 on a national level.
Table 2.3: Quarterly Growth in National GDP per Industry, 2018 Q4-2020 Q3
2018 2019 2020
Industry
Q4 Q1 Q2 Q3 Q4 Q1 Q2 Q3
Agriculture, forestry and fishing 7.9 -16.8 -4.9 -4.5 -7.6 35.9 19.6 18.5
Mining and quarrying -3.8 -10.8 17.4 -6.1 1.8 -21.5 -72.0 288.3
Manufacturing 4.5 -8.8 2.1 -4.4 -1.8 -8.5 -74.9 210.2
Electricity, gas and water 0.2 -7.4 3.2 -4.9 -4.0 -5.6 -36.4 58.0
Construction -0.7 -5.3 -2.4 -6.9 -5.9 -4.7 -76.5 71.1
Trade, catering and accommodation -0.7 -3.6 3.4 2.6 -3.8 -0.7 -67.6 137.0
Transport, storage and communication 7.7 -4.4 -0.3 -5.4 -7.2 0.5 -69.4 79.3
Finance, real estate and business services 2.7 1.1 4.1 1.6 2.7 3.7 -34.2 16.5
General government services -0.6 2.5 3.3 2.4 -0.4 1.2 -1.0 0.9
Personal services 1.7 1.1 0.8 0.4 0.7 0.5 -32.7 38.6
Total value added at basic prices 1.7 -3.2 3.5 -0.9 -1.3 -1.6 -50.5 64.4
Taxes less subsidies -1.7 -3.0 1.9 0.1 -3.0 -2.9 -63.2 86.1
GDP at market prices 1.4 -3.2 3.3 -0.8 -1.4 -1.7 -51.7 66.1
Constant 2010 prices, percentage change quarter-on-quarter (seasonally adjusted and annualised)
Source: Stats SA GDP, 3rd Quarter 2020
In the fourth quarter of 2019, only the Mining and quarrying, Finance, real estate and business
services and Personal services industries recorded positive growth while the rest recorded a
contraction. The Agriculture, forestry and fishing and Transport, storage and communication
industries recorded the largest contractions at -7.6 per cent and -7.2 per cent respectively, while GDP
contracted by 1.4 per cent. In the first quarter of 2020, Agriculture, forestry and fishing registered
significant growth of 35.9 per cent while Mining and quarrying saw a massive decrease of -21.5 per
cent. Manufacturing recorded the second largest contraction for this quarter (-8.5 per cent) and the
national GDP contracted by 1.7 per cent. As a result of the national lockdown to limit the spread of
the novel coronavirus which began at the end of the first quarter of 2020, all industries contracted
by significant percentages except for Agriculture, forestry and fishing (which was the only industry
to record positive growth), and General government services that contracted by only 1.0 per cent.
National GDP contracted by 51.7 per cent in the second quarter of 2020. All of the industries went on
to record positive growth figures in the third quarter of 2020 driven mainly by the easing of lockdown
restrictions. National GDP was recorded growing at a significant 66.1 per cent in the third quarter of
2020.
12Northern Cape Socio-Economic Review and Outlook 2021
2.3.2 Inflation
Figure 2.1 shows the South African inflation rate from January 2020 to January 2021.
Figure 2.1: South African Inflation, January 2020-January 2021
South African Inflation, January 2020-January 2021
5.0
4.5
4.0
3.5
3.0
2.5
%
2.0
1.5
1.0
0.5
0.0
Jan-20 Feb-20 Mar-20 Apr-20 May-20 Jun-20 Jul-20 Aug-20 Sep-20 Oct-20 Nov-20 Dec-20 Jan-21
Inflation 4.5 4.6 4.1 3.0 2.1 2.2 3.2 3.1 3.0 3.3 3.2 3.1 3.2
Source: Stats SA, Consumer Price Index, January 2021
The annual rate of inflation was recorded at 4.5 per cent in January of 2020, increasing to 4.6 per
cent in February after which it started to decline until it reached a minimum of 2.1 per cent in May
2020. The inflation rate ended 2020 at 3.1 per cent in December. The rate of inflation increase
slightly to 3.2 per cent in January 2021. According to Statistics South Africa, food and non-alcoholic
beverages; housing and utilities; and miscellaneous goods and services were the main drivers of the
increase in the inflation rate from December 2020 to January 2021.
2.4 Provincial Economy
Figure 2.2 illustrates the GDP growth rates of South Africa and the Northern Cape. Growth figures
for the Northern Cape are provided for 2009 to 2018 and for South Africa for 2009 to 2023.
Figure 2.2: GDP Growth Rates of South Africa and Northern Cape, 2009-2023
GDP Growth Rates of South Africa and Northern Cape, 2009-2023
4.0
2.0
0.0
-2.0
%
-4.0
-6.0
-8.0
2009 2010 2011 2012 2013 2014 2015 2016 2017 2018 2019 2020 2021 2022 2023
SA -1.5 3.0 3.3 2.2 2.5 1.8 1.2 0.4 1.4 0.8 0.2 -7.2 3.3 2.2 1.6
NC - 2.3 2.2 2.0 3.2 2.4 3.0 1.1 - 1.2 2.8 0.5
2020 estimate, 2021-2023 forecasts
Constant 2010 prices
Source: Stats SA GDP, 4th Quarter 2019 (SA 2009-2019, NC 2009-2018), National Treasury Budget Review 2021 (SA
2020-2023)
13Northern Cape Socio-Economic Review and Outlook 2021
In 2009, the economy of the Northern Cape and the country recorded a contraction of 2.3 per cent
and 1.5 per cent respectively. After the contraction of 2009, the economy of the Northern Cape went
on to grow positively for six consecutive years after which the economy contracted by 1.2 per cent
in 2016. The economy of the province recovered in 2017 after output grew by 2.8 per cent and grew
by a further 0.5 per cent in 2018. After contracting in 2009, the national economy went on to record
positive grow each year until 2019. In 2020, the estimated contraction that the country is expected
to have recorded was -7.2 per cent. National Treasury’s forecasts indicate that the economy of the
country is expected to show some recovery, with projected growth of 3.3 per cent in 2021, 2.2 per
cent in 2022 and 1.6 per cent in 2023.
For 2009 and 2018, the provincial contributions made to the national GDP are provided below.
Figure 2.3: Provincial Contributions to South Africa’s GDP, 2009 and 2018
Provincial Contributions to South Africa's GDP, 2009 and 2018
40.0
35.0
30.0
25.0
20.0
%
15.0
10.0
5.0
0.0
WC EC NC FS KZN NW GP MP LP
2009 13.7 7.6 2.2 5.4 16.3 6.5 33.8 7.3 7.3
2018 13.6 7.7 2.1 5.0 16.0 6.4 34.3 7.5 7.4
Current prices
Source: Stats SA GDP, 4th Quarter 2019
The contribution that the Northern Cape made to national GDP decreased by 0.1 of a percentage
point from 2.2 per cent in 2009 to 2.1 per cent in 2018, making it the smallest contributor to national
GDP for both years. The contributions made by the Western Cape and KwaZulu-Natal declined by
0.1 and 0.3 of a percentage point respectively, while Gauteng’s contribution increased by 0.5 of a
percentage point. Mpumalanga’s contribution increased by 0.2 of a percentage point, while the Free
State’s contribution declined by 0.4 of a percentage point. The contributions made by Limpopo and
Eastern Cape each increased by 0.1 of a percentage point from 2009 to 2018. Gauteng remained by
far the largest contributor to the national economy, accounting for just over a third of national output.
14Northern Cape Socio-Economic Review and Outlook 2021
Figure 2.4 illustrates the contributions that the districts made to the province’s economy in 2019.
Figure 2.4: Contributions by District Municipalities to Provincial GDP, 2019
Contributions by District Municipalities to Provincial GDP, 2019
Namakwa, 10.7%
John Taolo
Gaetsewe, 16.9% Pixley ka Seme,
11.8%
Frances Baard, ZF Mgcawu, 25.1%
35.6%
Current prices
Source: IHS Markit, 2021 [Regional eXplorer Version 2070 (2.6p)] and own calculations
The Frances Baard district was the largest contributor to the GDP of the province, accounting for
more than a third (35.6 per cent) of the total GDP of the Northern Cape. The district with the province’s
second largest economy was ZF Mgcawu, which contributed 25.1 per cent to the economy of the
province, followed by John Taolo Gaetsewe (16.9 per cent). Pixley ka Seme contributed 11.8 per
cent and Namakwa 10.7 per cent to the province’s economy in 2019.
15Northern Cape Socio-Economic Review and Outlook 2021
2.4.1 Sector Contributions
Table 2.4 includes the Northern Cape economic sectors’ growth and contributions to GDP for 2017
and 2018.
Table 2.4: Provincial Sectoral Growth and Contributions to GDP, 2017 and 2018
Contributions to
Growth Rate
GDP
Sector (%)
(%)
2017 2018 2017 2018
Primary sector 8.1 -0.3 27.3 26.9
Agriculture, forestry and fishing 12.4 -5.9 7.1 6.4
Mining and quarrying 7.1 1.1 20.2 20.5
Secondary sector -0.4 -0.3 9.2 9.8
Manufacturing -0.7 0.4 3.1 3.2
Electricity, gas and water 0.2 0.3 3.5 3.9
Construction -0.9 -1.8 2.7 2.7
Tertiary sector 0.5 0.9 53.7 53.4
Trade, catering and accommodation -0.8 0.2 10.7 9.5
Transport, storage and communication 0.6 0.7 10.8 10.3
Finance, real estate and business services 1.5 1.2 11.9 12.4
Personal services 1.8 0.8 4.8 5.0
General government services 0.0 1.3 15.5 16.1
All industries at basic prices 3.0 0.3 90.2 90.0
Taxes less subsidies on products 0.9 2.1 9.8 10.0
GDPR at market prices 2.8 0.5 100.0 100.0
Growth rate at constant 2010 prices, Contributions to GDP at current prices
Source: Stats SA GDP 4th Quarter 2019
The Tertiary sector was the largest sector in the Northern Cape, having made a contribution towards
the provincial GDP of 53.7 per cent in 2017 and a slightly smaller contribution in 2018 at 53.4 per
cent. The Tertiary sector grew by 0.5 per cent in 2017, compared to 8.1 per cent growth for the
Primary sector and a 0.4 per cent contraction in the Secondary sector for the same year. In 2018,
the Tertiary sector grew by 0.9 per cent, compared to a 0.3 per cent contraction for each of the
Primary and Secondary sectors. In 2017, the Agriculture, forestry and fishing industry recorded the
highest growth rate at 12.4 per cent but contracted in 2018 at -5.9 per cent. The industry with the
highest growth rate in 2018 was General government services, growing at a low 1.3 per cent. Mining
and quarrying remained the largest industry in 2018, contributing 20.5 per cent to the provincial
economy, with Construction remaining the smallest industry, contributing only 2.7 per cent.
16Northern Cape Socio-Economic Review and Outlook 2021
The following graph shows the economic industries’ contributions to the total industries for each
district in the Northern Cape for 2019.
Figure 2.5: Industry Contributions to Total Industries per District, 2019
Industry Contributions to Total Industries per District, 2019
100%
21.9% 12.6%
17.6%
31.8% 29.7%
90%
7.5%
80%
10.6% 4.1%
4.7%
70% 14.6% 1.6%
8.8% 0.7%
1.3% Community services
60% 14.4% 18.3%
10.1% Finance
10.6%
Transport
2.9% Trade
50%
0.4% 10.7% Construction
14.5%
2.2% 15.3% Electricity
40% 3.4%
Manufacturing
3.4%
64.6% Mining
11.3% 4.4%
30% 12.2% Agriculture
37.6%
3.6%
4.2% 3.2%
20% 23.0%
3.8% 8.1%
2.7%
10% 4.5%
13.7%
9.3% 6.3%
8.4%
2.3% 3.0%
0%
Namakwa Pixley ka Seme ZF Mgcawu Frances Baard John Taolo
Gaetsewe
Current prices
Source: IHS Markit, 2021 [Regional eXplorer Version 2070 (2.6p)]
In the Frances Baard district, Community services accounted for 29.7 per cent of the district’s total
industries in 2019, making it the largest industry in the district. Community services, representing
31.8 per cent of total industries, was also the largest industry in Pixley ka Seme. Mining was the
largest contributing industry in the Namakwa, ZF Mgcawu and John Taolo Gaetsewe districts and
accounted for 37.6, 23.0 and 64.6 per cent of the districts’ total industries respectively. Manufacturing
was one of the small contributors to all districts’ economies.
17Northern Cape Socio-Economic Review and Outlook 2021
2.5 Conclusion
World output is projected to grow by 5.5 per cent in 2021, following the estimated contraction of
3.5 per cent in 2020 due to the economic crisis brought about by the global Covid-19 pandemic.
According to National Treasury, the national economy is estimated to have contracted by a significant
7.2 per cent in 2020, but is expected to show some recovery in 2021 with the economy projected
to grow by 3.3 per cent. Before the start of the pandemic, South Africa was already in a recession.
Gauteng made the largest contribution to the national economy in 2018, while the Northern Cape
made the smallest. The provincial economy recorded low economic growth of 0.5 per cent in 2018
after growing at a higher rate in 2017 at 2.8 per cent. Provincially, Mining and quarrying remained
the largest contributor to the provincial GDP. The district that made the largest contribution to the
economy of the province, was Frances Baard. The largest industry in Frances Baard and Pixley ka
Seme was Community services in 2019, while in Namakwa, ZF Mgcawu and John Taolo Gaetsewe,
Mining was the largest.
18Northern Cape Socio-Economic Review and Outlook 2021
Chapter 3: Labour
3.1 Introduction
In this chapter, an analysis is provided of the national and provincial labour characteristics.
Information is provided on which industries people find employment in and employment figures are
compared across the districts within the Northern Cape. The crisis brought about by Covid-19 also
led to challenges in the labour market as many jobs were lost in 2020. The analysis contained in
this chapter is important as it provides insight into which industries are shedding jobs and which
are increasing its employment. It also shows the need for intervention to fight the high rates of
unemployment faced by the country and the province.
3.2 National Labour Characteristics
3.2.1 Labour Status
The following table provides insight into the labour market status of South Africa. The data reflected
are for quarter 4 of 2019 and quarters 3 and 4 of 2020. The official definition of unemployment is
used.
Table 3.1: Labour Market Status for South Africa, 2019 Q4, 2020 Q3 and 2020 Q4
Qtr-to-qtr Yr-on-yr
2019 Q4 2020 Q3 2020 Q4
Labour Market change change
('000) ('000) ('000)
('000) ('000)
Population aged 15-64 38 727 39 167 39 311 143 583
Labour force 23 146 21 224 22 257 1 033 -889
Employed 16 420 14 691 15 024 333 -1 397
Unemployed 6 726 6 533 7 233 701 507
Not economically active 15 581 17 944 17 054 -890 1 473
Discouraged work-seekers 2 855 2 696 2 930 234 75
Other 12 726 15 248 14 124 -1 124 1 398
(Percentage (Percentage
Rates (%) (%) (%)
point) point)
Unemployment rate 29.1 30.8 32.5 1.7 3.4
Absorption rate 42.4 37.5 38.2 0.7 -4.2
Labour force participation rate 59.8 54.2 56.6 2.4 -3.2
Due to rounding, numbers do not necessarily add up to totals.
Source: Stats SA QLFS 4th Quarter 2020
Nationally, the number of employed people increased by 333 000 on a quarterly basis (from quarter
3 of 2020 to quarter 4 of 2020), while it decreased by an alarming 1.397 million on an annual
basis (from quarter 4 of 2019 to quarter 4 of 2020). The number of unemployed people increased
by 701 000 on a quarterly basis and by 507 000 on an annual basis. Discouraged work-seekers
also increased on both a quarterly and an annual basis. The national absorption rate, which is the
19Northern Cape Socio-Economic Review and Outlook 2021
proportion of the working-age population aged 15 to 64 years that are employed, increased by 0.7
of a percentage point from 37.5 per cent in quarter 3 of 2020 to 38.2 per cent in quarter 4 of 2020,
while it decreased by 4.2 percentage points on an annual basis. The unemployment rate increased
by 1.7 percentage points from the third quarter to the fourth quarter of 2020 and increased by 3.4
percentage points year-on-year. The nation’s unemployment rate stood at 32.5 per cent in the fourth
quarter of 2020.
Table 3.2 shows discouraged work-seekers, the absorption rate and the labour force participation
rate for the 9 provinces for the fourth quarter of 2020.
Table 3.2: Discouraged Work-Seekers, Absorption Rate and Labour Force Participation Rate per Province, 2020 Q4
Discouraged work- Labour force
Absorption rate
Province seekers participation rate
(%)
('000) (%)
Western Cape 87 49.0 63.3
Eastern Cape 172 28.3 54.3
Northern Cape 74 37.7 52.9
Free State 80 38.9 58.4
KwaZulu-Natal 786 33.8 48.0
North West 241 35.5 53.2
Gauteng 622 43.0 65.2
Mpumalanga 296 38.1 56.8
Limpopo 573 33.1 45.6
South Africa 2 930 38.2 56.6
Due to rounding, numbers do not necessarily add up to totals.
Source: Stats SA QLFS 4th Quarter 2020
Looking at the absorption rates of the fourth quarter of 2020, Western Cape (49.0 per cent), Gauteng
(43.0 per cent) and Free State (38.9 per cent) had the highest, while Eastern Cape (28.3 per cent)
had the lowest absorption rate. The Northern Cape had the fifth highest absorption rate. When
considering the number of discouraged work-seekers in the fourth quarter of 2020, KwaZulu-Natal
had the largest number (786 000), followed by Gauteng (622 000) and Limpopo (573 000) while
the Northern Cape had the smallest number. Gauteng had the highest labour force participation
rate (65.2 per cent), followed by Western Cape (63.3 per cent) and Free State (58.4 per cent) while
Limpopo had the lowest (45.6 per cent). The Northern Cape’s labour force participation rate was the
third lowest in the country.
20Northern Cape Socio-Economic Review and Outlook 2021
3.2.2 Unemployment
The unemployment rate by province for quarter 4 of 2019 and quarters 3 and 4 of 2020 is provided
in Figure 3.1.
Figure 3.1: Unemployment Rate by Province, 2019 Q4, 2020 Q3 and 2020 Q4
Unemployment Rate by Province, 2019 Q4, 2020 Q3 and 2020 Q4
60.0
50.0
40.0
30.0
%
20.0
10.0
0.0
SA WC EC NC FS KZN NW GP MP LP
2019 Q4 29.1 20.9 39.5 26.9 35.0 25.0 28.8 30.8 33.6 23.1
2020 Q3 30.8 21.6 45.8 23.1 35.5 26.4 28.3 33.7 27.8 26.3
2020 Q4 32.5 22.5 47.9 28.7 33.4 29.6 33.3 34.1 33.0 27.3
Source: Stats SA QLFS 4th Quarter 2020
Eastern Cape had the highest unemployment rate in the fourth quarter of 2020 at 47.9 per cent
followed by Gauteng (34.1 per cent), Free State (33.4 per cent) and North West (33.3 per cent). The
lowest unemployment rate was recorded in Western Cape at 22.5 per cent, with the Northern Cape
recording the third lowest rate. All the provinces experienced an increase in their unemployment
rates on a quarterly basis except for Free State which managed to decrease its unemployment
rate by 2.1 percentage points. On an annual basis, only Free State and Mpumalanga managed to
decrease their respective unemployment rates.
3.2.3 Employment
The number of people employed by industry in South Africa in quarter 4 of 2019 and quarters 3 and
4 of 2020 is shown in Table 3.3.
Table 3.3: Employment by Industry for South Africa, 2019 Q4, 2020 Q3 and 2020 Q4
Qtr-to-qtr Yr-on-yr
2019 Q4 2020 Q3 2020 Q4
Industry change change
('000) ('000) ('000)
('000) ('000)
Agriculture 885 808 810 2 -75
Mining 430 419 384 -35 -46
Manufacturing 1 720 1 460 1 491 31 -230
Utilities 120 90 99 9 -21
Construction 1 350 1 080 1 166 86 -184
Trade 3 249 3 008 3 063 55 -186
Transport 1 011 878 943 65 -68
Finance 2 568 2 434 2 312 -123 -256
Community and social services 3 792 3 381 3 551 170 -241
Private households 1 286 1 121 1 197 76 -89
Due to rounding, numbers do not necessarily add up to totals.
Source: Stats SA QLFS 4th Quarter 2020
21You can also read