NH Energy Landscape Patterns, Policy and Potential
←
→
Page content transcription
If your browser does not render page correctly, please read the page content below

NH Energy Landscape
Patterns, Policy and Potential
        Municipal Association Annual Conference
                  November 16, 2022

                           Clifton Below
Chair, Community Power Coalition of NH & Assistant Mayor, City of Lebanon
                          Henry Herndon
       Consultant to Community Power Coalition of New Hampshire
                          Chris Skoglund
              Director of Energy Transition, Clean Energy NH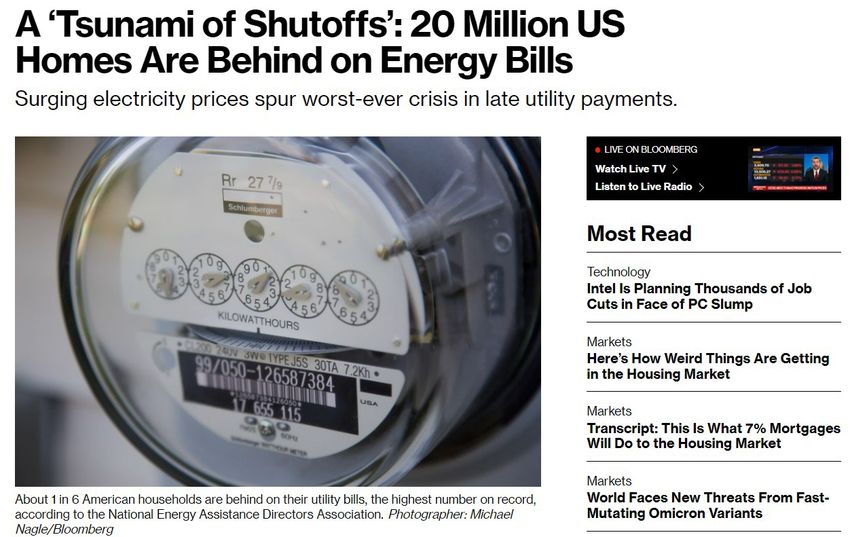
Panel Overview Patterns and Projections oChris Skoglund Director of Energy Transition, CENH Policy and Potential oHenry Herndon Consultant to CPCNH oClifton Below Chair, CPCNH & Assistant Mayor, City of Lebanon
NH Energy Landscape
      Patterns, Policy and Potential

Energy Patterns and Projections
  Municipal Association Annual Conference
             November 16, 2022

                Chris Skoglund
          chris@cleanenergynh.org
         Director of Energy Transition
               Clean Energy NH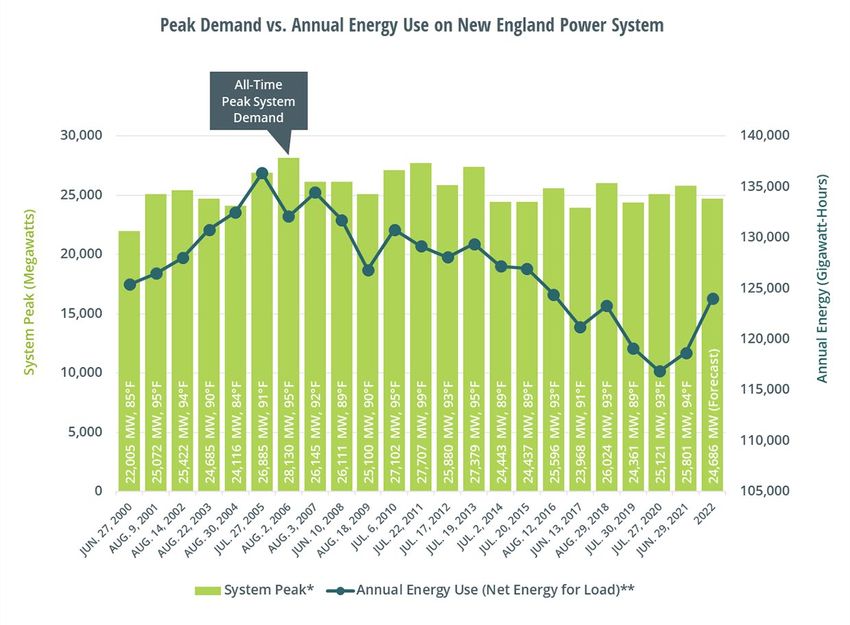
ABOUT CLEAN ENERGY NH
   New Hampshire’s leading clean energy advocate
   (501(c)3 Nonprofit), dedicated to:

Strengthening      Protecting Public       Reducing
NH’s Economy            Health             Emissions   4

       Learn more & become a member at:
         http://www.cleanenergynh.org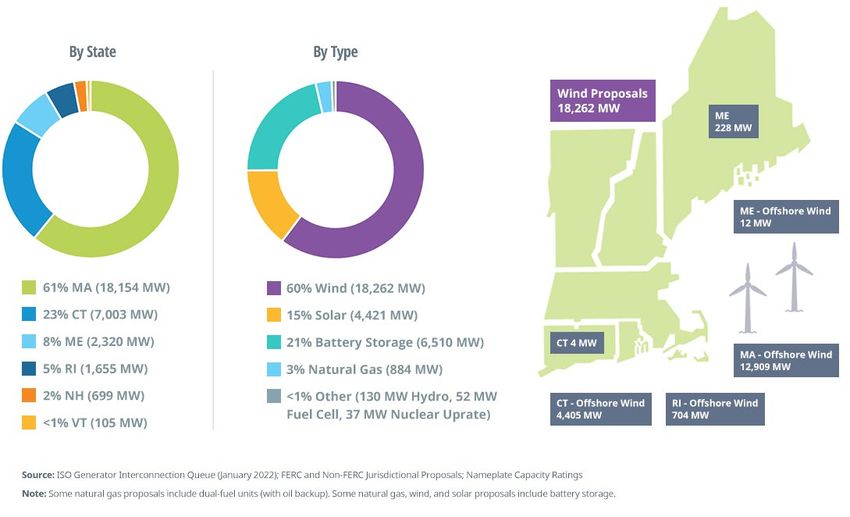
Presentation Overview
New Hampshire Energy System
New Hampshire in a Larger Context
A Look to the Future
Presentation Takeaways
NH Energy Prices Are HIGH
NH Energy System Highly Exposed
Energy Prices and Costs Result of Policy Decisions
Energy Costs Impact on NH’s Competitive Edge
The Future Is Ours to Make
New Hampshire In Focus
2019 Headline:
                       “NH Leading the Way”
                                                                                     NE States: Per Capita Emissions
                                                                                30                                          40%

                                            Million Metric Tons CO2e Per Year
                                                                                                                            35%
                                                                                25
                                                                                                                            30%
                                                                                20

                                                                                                                                  Percent Reduction
                                                                                                                            25%

                                                                                                                                      2005-1016
                                                                                15                                          20%

                                                                                                                            15%
                                                                                10
                                                                                                                            10%
                                                                                 5
                                                                                                                            5%

                                                                                 0                                          0%
                                                                                     CT   MA   ME    NH    RI     US   VT

                                                                                                    2005   2016
                                                                                                                                                      7
Source: Grist, World Resources Institute   Data Source: EIA State Energy Data System, Environmental Action Network
                                           Data; NHDES Analysis. Subject to revision. August 2020.

2019 Finding: New Hampshire ranked SECOND in nation in percent
emissions reductions between 2005 and 2016, and first in New
England.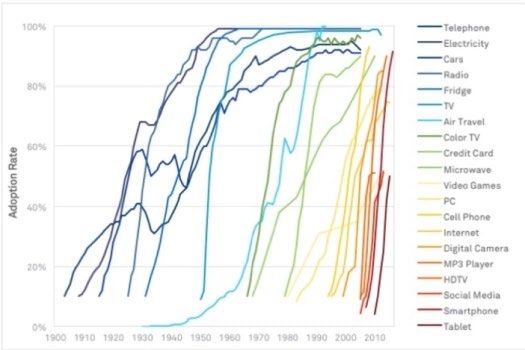
NH Economic, Energy, & Emissions
                                          Trends ARE Positive                                                                    Economic growth (black) has
                                                                                                                                 exceeded the population growth
                                                                                                                                 (green) even as overall “primary”
                                    70%
                                                                                                                                 energy consumption (blue) and
                                                                                                                                 GHG emissions (red) have FALLEN.
                                    60%

                                    50%

                                    40%
Percent Change (Relative to 1997)

                                    30%

                                    20%

                                    10%

                                     0%
                                           1997 1998 1999 2000 2001 2002 2003 2004 2005 2006 2007 2008 2009 2010 2011 2012 2013 2014 2015 2016 2017 2018

                                    -10%

                                    -20%

                                                           Real GDP        Population        GHG         Primary Energy Consumption

        Data Source: Federal Reserve Economic Data, US Energy Information Administration, US Census
        Bureau. August 2020.
Compared to base year (1990), TOTAL
                                                                                                                                emission are virtually unchanged in 2018.

  NH GHG Emissions                                                                                                              Compared to peak emissions in 2004/2005,
                                                                                                                                emissions have fallen more than 30%.

 Inventory By Sector                                                                                                            Electric sector emissions (top/red) have fallen
                                                                                                                                nearly 74% since 2005. Other sectors declined
                                                                                                                                through 2011, and have remained flat or
                                      25.00
                                                                                                                                begun rising.

                                      20.00
Million Metric Tons CO2 equivalents

                                      15.00

                                      10.00

                                       5.00

                                       0.00
                                           1990 1991 1992 1993 1994 1995 1996 1997 1998 1999 2000 2001 2002 2003 2004 2005 2006 2007 2008 2009 2010 2011 2012 2013 2014 2015 2016 2017 2018

                                                Agriculture       Waste       Industrial      Commercial         Residential      Transportation        Electricity Generation

Data Source: 2018 NH GHG Emissions Inventory: US Energy Information Administration, US EPA Data, RGGI Inc.; NHDES
Analysis. August 2020.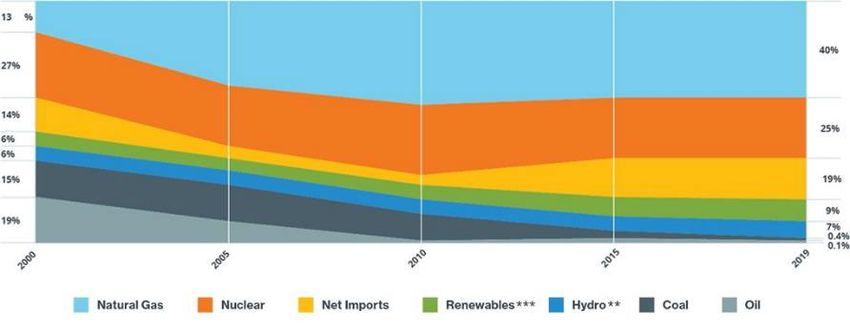
Overall Electric Generation
                                                                                                                                 Analysis of NH’s energy consumption
                                                                                                                                 across sectors, including retail electric
                                                                                                                                 sales, shows far less change. NH’s

     Changes in NH
                                                                                                                                 emissions are falling but the economy
                                                                                                                                 is consuming a MORE energy.

                                             30,000,000

                                             25,000,000
  Total Annual Generation (Gigawatt hours)

                                             20,000,000

                                             15,000,000

                                             10,000,000

                                              5,000,000

                                                     -
                                                          199219931994199519961997199819992000200120022003200420052006200720082009201020112012201320142015201620172018

                                                            Other    Other Biomass   Petroleum   Wind   Wood    Hydroelectric   Natural gas   Coal   Nuclear

  Data Source: US Energy Information Administration. August 2020.
New Hampshire in Context
Regional Greenhouse Gas Initiative
The Regional Greenhouse Gas
Initiative (RGGI) is a ten (10)
state cooperative effort among
northeastern states to cap and
reduce CO2 emissions from the
power sector.
Electric generation facilities
purchase emission allowances
through auctions and
participating states invest
proceeds in energy efficiency,
renewable energy, and other
consumer benefit programs.NH Emissions & Regional Electrical Market
NH’s electric generation
facilities do no provide
electricity for NH alone.
Electricity within New
England is shared over
transmission lines, and
managed by a region grid
operator, ISO-NE.
The electricity consumption
across NE impacts NH
generators and emissions.New England Peak Demand
& Total Electricity Consumption
NH GHG emissions
in the electric sector
have fallen as
regional “peak
demand” and total
regional electricity
consumption have
declined.
Source: ISO-NE, Electricity Use and Demand, November 2022 https://www.iso-ne.com/about/key-stats/electricity-use/Overall Electric Generation
Changes in New England
Source: ISO New England, Generation Data And Net Energy And Peak Load by Source ReportNew England Competes for Energy
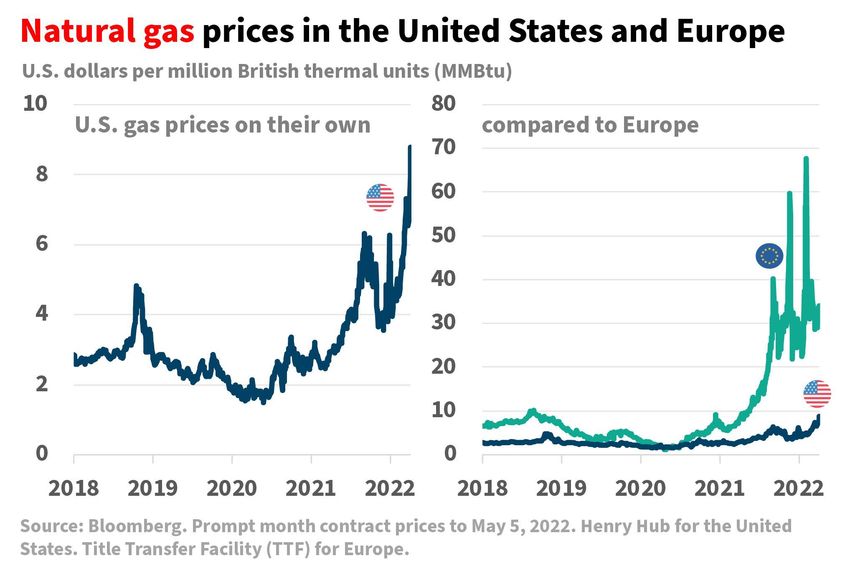
Global Energy Market
16ISO-NE Wholesale Market
Vulnerable to Winter Price Spikes
Source: ISO-NE, 2022, https://isonewswire.com/2022/04/27/monthly-wholesale-electricity-prices-and-demand-in-new-
england-march-2022/25
NE Electric SUPPLY Rates
20
Cents/kWh
15
10
5
Eversource (CT) United Illuminating (CT) Central Maine Power Versant Bangor Hydro (ME)
Versant Maine Public Eversource East (MA) Eversource West (MA) National Grid (MA)
Unitil (MA) Unitil (NH) Eversource (NH) Liberty (NH)
NH Electric Co-Op Rhode Island Energy
Source: NHPR 2022:
https://www.nhpr.org/nh-news/2022-09-08/why-electricity-prices-are-rising-unevenly-across-new-england19
State Energy Policies Add Up
NH Energy Policy Lags
    Northeast and Nation

Source: ACEEE, 2021, https://www.aceee.org/press-release/2020/12/2020-state-energy-efficiency-scorecard
NH Energy Consumption
Analysis of NH’s energy consumption
across sectors, INCLUDING RETAIL
ELECTRIC SALES, shows far less change.
By Sector 1990-2019
NH’s emissions are falling, but the
economy is consuming a slightly more
energy.
300.00
250.00
Annual Energy Consumption (TBTUs)
200.00
150.00
100.00
50.00
-
1990 1991 1992 1993 1994 1995 1996 1997 1998 1999 2000 2001 2002 2003 2004 2005 2006 2007 2008 2009 2010 2011 2012 2013 2014 2015 2016 2017 2018
Industrial Commercial Residential Transportation
Source: US DOE EIA State Energy Data System. August 2020.New England Electric Sales
Change in TOTAL Consumption
25% 23%
20%
17% 18% 17%
NH electricity
consumption 15%
(GWh/year) across all
10%
sectors increased more 7%
Percent Change
6%
than any other NE 5%
state from 1990-
present, and declined 0%
from less than almost 0%
-2%
any state between -5%
2005 and 2018. -6% -6%
-7%
-10%
-15% -13%
Connecticut Maine Massachusetts New Rhode Island Vermont
Hampshire
1990-2018 2005-2018
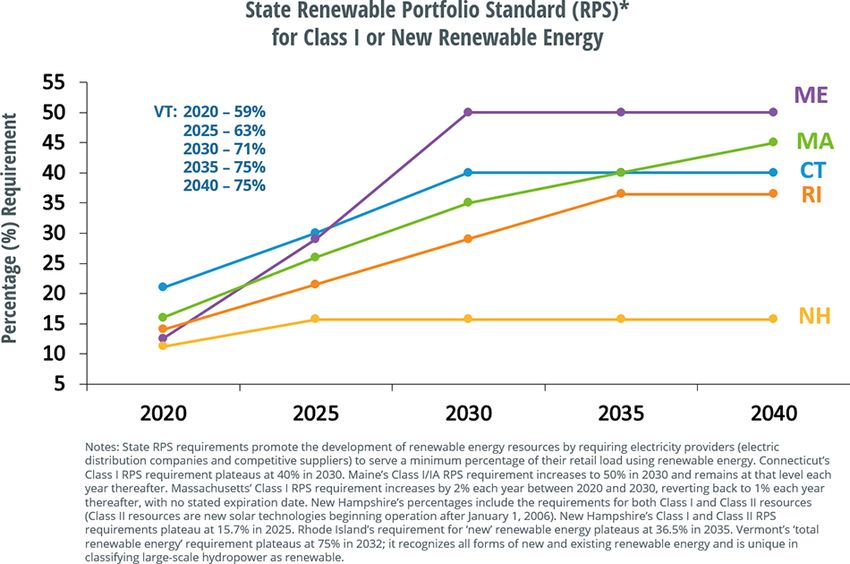
Data Source: US Energy Information Administration. August 2020.New England States Renewable Portfolio Standards Source: ISO-NE , November 2022, https://www.iso-ne.com/about/key-stats/resource-mix
Final Installed 2021 Solar PV
           Nameplate Capacity (MW)

Source: ISO-NE, Final 2022 PV Forecast Presentation, April 28, 2022
Climate Change Targets ARE Common
New Hampshire is an Outlier
LEGISLATED Economy-wide Emissions Reduction Targets
Electricity Sector RPS & CE Targets
ME:
80% By 2050 / EO For Net Zero By 2045
80% RPS By 2030
VT: 100% CE Target By 2050
80-95% By 2050
75% RPS By 2032
MA:
Net Zero By 2050 NH:
41% RPS By 2030, Then Escalates 2009 Climate Action Plan Set Goal Of 80%
100% CE Target By 2040 Emissions Reduction Relative To 2050
25% RPS By 2025
CT:
RI:
80% By 2050
80% By 2050
44% RPS By 2030
38% RPS By 2035
100% CE Target By 2040
100% CE By 2030
The five OTHER New England states are aggressively pursuing efforts aimed at
increasing renewable energy generation and reducing carbon emissions.SIDE NOTE: Fossil Fuel Producers
May Not Come to Rescue
27A Look Forward
FORECAST New England
    Total Electricity Consumption

Source: ISO-NE, Electricity Use and Demand, November 2022 https://www.iso-ne.com/about/key-stats/electricity-use/
FORECAST New England
Peak Electricity Demand
Source: ISO-NE, Electricity Use and Demand, November 2022 https://www.iso-ne.com/about/key-stats/electricity-use/ISO’s Electrification Forecast
Shows Demand Growth
Source: ISO-NE, 2021-2022 State Energy Profiles
https://www.iso-ne.com/static-assets/documents/2021/03/new_england_power_grid_state_profiles.pdfFinal 2022-2031 PV Forecast
Nameplate Capacity (MW)
Source: ISO-NE, Final 2022 PV Forecast Presentation, April 28, 2022The Future Is Not Written
PV Forecast Retrospective Look
        Nameplate Capacity (MW)

Source: ISO-NE, Final 2022 PV Forecast Presentation, April 28, 2022
Technological Adoption
Adoption
Can Occur Quickly of EVsStarted
Once
Consistent with Previous
Transitions
Image Credit: Tony Seba
35ISO Generator Interconnection Queue > 30,000 MW of Renewables + Storage Source: ISO-NE, November 2022, https://www.iso-ne.com/about/key-stats/resource-mix
Policies and Potential
1. The Inflation Reduction Act expands incentives that to-date
   have only been available to private companies to local
   governments;
2. Community Power and CPCNH are preparing to launch power
   supply service in 2023, giving cities and towns market power
   and the ability to develop local, cost-effective projects to
   benefit their communities;
3. Statewide Energy Data Platform is in development that will
   greatly improve the ability of innovative energy companies to
   create value for customers and for the system; and
4. 2023 NH Legislative Session is planned to remove regulatory
   barriers holding back cost-effective, development of in-state
   energy generators and battery storage at the community scale.
You can also read