Network Opportunity Map 2021 - NOM2021 Public 1 October 2021 - Western Power
←
→
Page content transcription
If your browser does not render page correctly, please read the page content below
Network Opportunity Map
2021
NOM2021
Public
1 October 2021

An appropriate citation for this paper is:
Western Power Network Opportunity Map 2021

Western Power
363 Wellington Street
Perth WA 6000
GPO Box L921 Perth WA 6842
T: 13 10 87 | Fax: 08 9225 2660
TTY 1800 13 13 51 | TIS 13 14 50
Electricity Networks Corporation
ABN 18 540 492 861
enquiry@westernpower.com.au
westernpower.com.au

Disclaimer

Western Power’s Network Opportunity Map 2021 (NOM2021) is prepared and made available solely for
information purposes. While care was taken in the preparation of the information in this paper and it is
provided in good faith, Western Power accepts no responsibility or liability for any loss or damage that may
be incurred by a person acting in reliance on this information or assumptions drawn from it. This
publication contains certain predictions, estimates and statements that reflect various assumptions and
business plans. The assumptions may or may not prove correct, and the assumptions and plans may change
over time. Anyone proposing to use the information in this paper should independently verify and check
the accuracy, completeness, reliability, currency and suitability of that information for their own purposes.

Western Power makes no representations or warranty as to the accuracy, reliability, completeness,
currency or suitability for particular purposes of the information, representations or statements in this
publication. Persons reading or utilising this document acknowledge that Western Power and their
employees, agents and consultants shall have no liability (including liability to any person by reason of
negligence or negligent misstatement) for any statements, opinions, information or matter (expressed or
implied) arising out of, contained in or derived from, or for any omissions from, the information in this
document, except insofar as liability under any Western Australian or Commonwealth statute cannot be
excluded.

The information contained in the NOM2021 is subject to annual review. Western Power is obligated to
publish future editions by 1 October each year, in accordance with the Electricity Network Access Code
2004 and changes made in September 2020.

Further Information

www.westernpower.com.au/network-opportunity-map

Contact

Network.Opportunities@WesternPower.com.au

                                                                                                      Page ii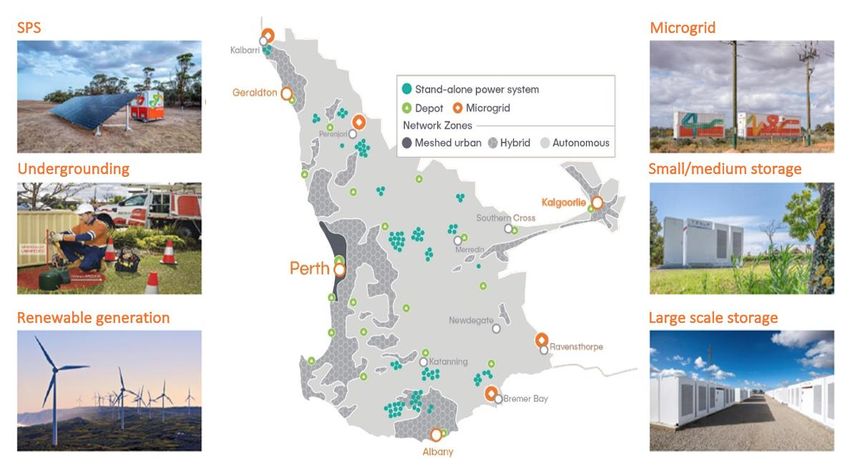
Contents

Contents...................................................................................................................................................... iii
Abbreviations.............................................................................................................................................. iv
Executive Summary .................................................................................................................................... vii
1.     Introduction .........................................................................................................................................1
       1.1        About Western Power ................................................................................................................ 2
       1.2        Role of Network Opportunity Map ............................................................................................. 5
       1.3        Network of the Future................................................................................................................ 8
2.     Transmission Network Opportunities ................................................................................................ 14
       2.1        Challenges ............................................................................................................................... 14
       2.2        Performance Parameters ......................................................................................................... 15
       2.3        Historical and Forecast Performance ........................................................................................ 17
       2.4        Identified Opportunities ........................................................................................................... 37
3.     Distribution Network Opportunities .................................................................................................. 38
       3.1        Challenges ............................................................................................................................... 39
       3.2        Distribution Network Performance Strategies .......................................................................... 39
       3.3        Performance Measures ............................................................................................................ 40
       3.4        Identified Opportunities ........................................................................................................... 45
Appendix A ACCESS CODE 2020 REQUIREMENTS ....................................................................................... 53
       A.1        Access Code Requirements Indexed To Network Opportunity Map 2021.................................. 54
Appendix B METHODOLOGIES ................................................................................................................... 57
       B.1        Planning Methodology ............................................................................................................. 58
       B.2        Asset Management Methodology ............................................................................................ 62
       B.3        Forecasting Methodology......................................................................................................... 74
Appendix C INVESTMENTS ......................................................................................................................... 78
       C.1        Investment Framework ............................................................................................................ 79
       C.2        Regulatory Oversight of Investment ......................................................................................... 82
       C.3        Network Opportunity Valuation ............................................................................................... 85
       C.4        Network Investments ............................................................................................................... 86

                                                                                                                                                       Page iii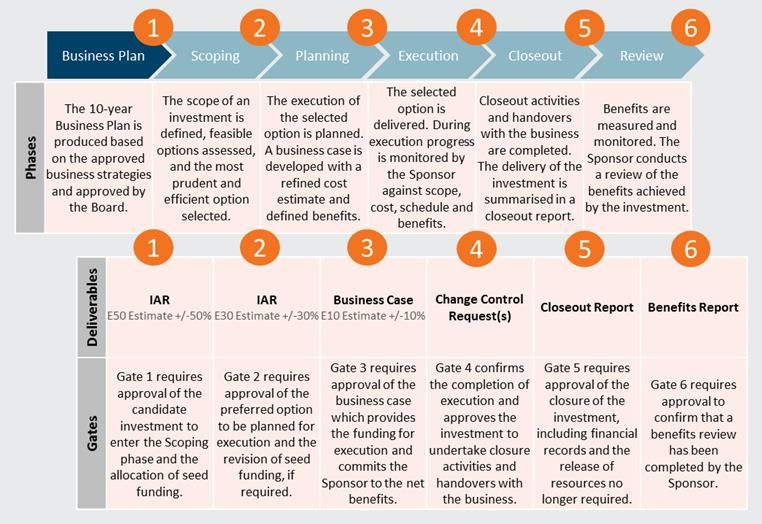
Abbreviations
The following table provides a list of abbreviations and acronyms used throughout this document. Defined
terms are identified in this document by capitals.

Term                      Definition
AA                        Access Arrangement
Access Code               Electricity Networks Access Code 2004 (& subsequent amendments)
Act                       Electricity Industry Act 2004 (& subsequent amendments)
ADV                       Annual Deferred Value
AEMO                      Australian Energy Market Operator
AMF                       Asset Management Framework
AMI                       Advanced Meter Infrastructure
AMS                       Asset Management System
AOS2021                   Alternative Options Strategy 2021
BC                        Business Case
BCH                       Beechboro Zone Substation
CAG                       Competing Applications Group
CBD                       Central Business District
CPI                       Consumer Price Index
CUSTED forecasts          Customers, Technology, Energy and Demand trends adjusted forecasts
DER                       Distributed Energy Resources
DNSP                      Distribution Network Service Providers
EDL1                      Electricity Distribution Licence
EGF                       Eastern Goldfields
EOI                       Expressions of Interest
EPWA                      Energy Policy Western Australia
ERA                       Economic Regulation Authority
ETL2                      Electricity Transmission Licence
ETS                       Energy Transformation Strategy
ETT                       Energy Transformation Taskforce
EV                        Electric Vehicles
FRZ                       Fire Risk Zone
FSP                       Flexibility Services Pilot
FY                        Financial Year
GIA                       Generator Interim Access
GTEng                     Grid Transformation Engine

                                                                                                  Page iv
HV            High Voltage
IAR           Investment Approval Requests
IGF           Investment Governance Framework
LV            Low Voltage
MAOSC2021     Model Alternative Option Service Contract 2021
MRL           Mean Replacement Life
MV            Mid Voltage
NBV           Net Benefit Valuation
NCMT          Network Capacity Mapping Tool
NCS           Network Control Service
NFIT          New Facilities Investment Test
NMI           National Metering Identifier
NOM Webpage   Network Opportunity Map Webpage
              www.westernpower.com.au/network-opportunity-map
NOM2021       Network Opportunity Map 2021 (this document)
NQRS Code     Electricity Industry (Network Quality and Reliability of Supply) Code
NSP           Network Service Provider
PV            Photovoltaic Systems
RFP           Requests for Proposal
RIS           Required In Service (date, usually part of a project definition)
RMU           Ring Main Units
ROI           Registration of Interest
SAIDI         System Average Interruption Duration Index
SAIFI         System Average Interruption Frequency Index
SCED          Security Constrained Economic Dispatch
SOTI          State of the Infrastructure Report
SPS           Stand-alone Power System
SSAM          Service Standard Adjustment Mechanism
SSBs          Service Standard Benchmarks
SST           Service Standard Targets
SVCs          Static Var Compensators
SWIN          South West Interconnected Network
SWIS          South West Interconnected System
TR            Technical Rules
WA            Western Australia
WEM           Wholesale Electricity Market

                                                                                      Page v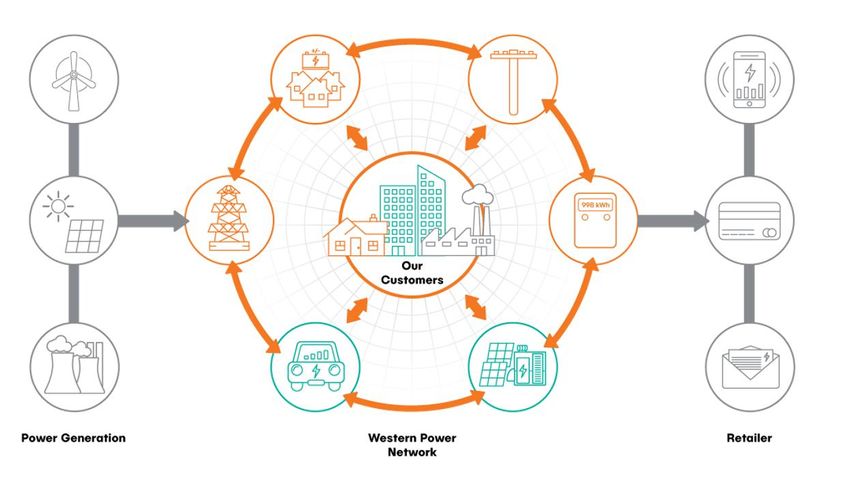
WOSP   Whole of System Plan
YP     Yanchep Zone Substation

                                 Page vi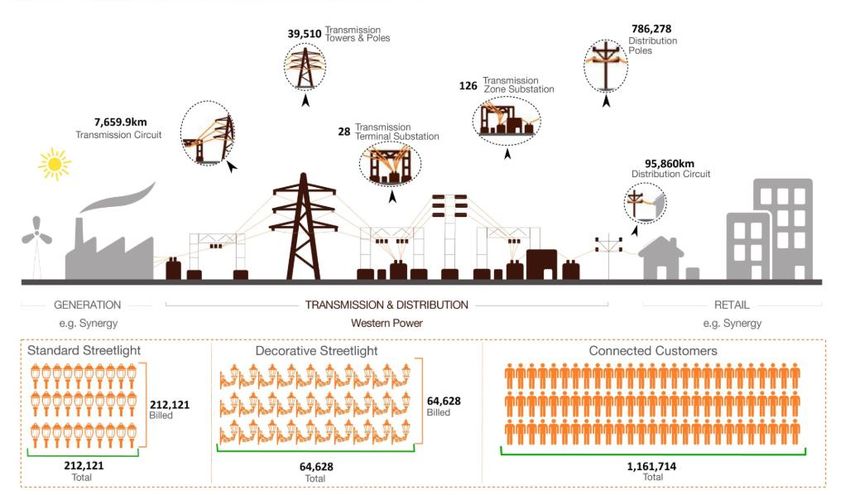
Executive Summary
Western Power’s Network Opportunity Map 2021 (NOM2021) offers an insight into the South West
Interconnected Network’s (SWIN) challenges and intentions in the next five to ten years, in an environment
of rapidly evolving technology and unprecedented penetration of renewable energy sources. The report
identifies existing and emerging network risks and constraints, offering the opportunity for third parties to
provide solutions to overcome these constraints.

The NOM2021 is being published as part of the Network Opportunity Map Webpage (NOM Webpage),
along with Alternative Options Strategy 2021 (AOS2021), Model Alternative Option Service Contract 2021
(MAOSC2021) and a suite of downloadable supporting data presented in a user-friendly format. The NOM
Webpage also features the Vendor NOM Registration form and feedback contact details as means for
Western Power to engage with customers and the industry in developing alternative solutions to some of
the emerging issues and constraints identified in NOM2021.

The Webpage and associated information, including NOM2021, aim to meet the intent and requirements
set out in the September 2020 changes to the Electricity Networks Access Code 2004 (Access Code),
specifically chapter 6A. To this end, NOM2021 contains details of identified emerging constraints and risks
on Western Power’s transmission and distribution networks in a format that can be used to anticipate
future opportunities for alternative solutions. The document also gives a broad overview of the
methodologies used to identify and quantify these constraints, as well as outlining the frameworks and
regulations that govern how Western Power invests in solutions addressing emerging network issues.

The information in the NOM2021 is primarily based on the Annual Planning Report 2020 and the Network
Plan NP23, updated in April 2021.

                                                                                                     Page vii
1.            Introduction
Western Power has provided Western Australians with safe, reliable and efficient electricity for more than
70 years, growing with our State and changing with the times.

Our vast transmission and distribution network connects homes, businesses and essential community
infrastructure to an increasingly renewable energy mix that is building our State and meeting the changing
energy needs of Western Australians. Demand for cleaner energy is transforming the traditional electricity
value chain, and understanding how the network needs to transform in response is the key to unlocking
future opportunities for our customers, businesses and the State.

The NOM Webpage enables this transformation by proactively seeking the input of business and industry
communities when addressing the needs of the network and harnessing the alternative solutions
developed to the benefit of all our customers.

The NOM has three distinct purposes:

     •   To provide a snapshot of the challenges, risks and constraints emerging for the network in the
         planning period (5 years) and in the foreseeable long term (10 years);

     •   To give all customers, industry and market participants an opportunity to anticipate network needs
         and proactively provide alternative solutions to those traditionally available to Network Service
         Providers (NSP); and

     •   To outline how Western Power will seek out, evaluate and engage with interested parties in
         developing alternative solutions to network constraints.

NOM2021 offers insight into some of the emerging opportunities for development and deployment of
alternative solutions. For some loads and/or generators, these opportunities might be in the form of
network areas with under- or over-utilisation, both on transmission and distribution network. For
alternative solutions, the opportunities could also include demand management, energy storage, reliability
improvements and many other solutions, with focus on areas of the network where we’ve identified
emerging constraints and issues.

The referenced data sheets listed on the NOM Webpage include some information that was traditionally
published by Western Power through other channels such as our Annual Planning Report; there is now
potential to phase out redundant publications.

Western Power intends to build on this first NOM publication, and the NOM Webpage to provide additional
insights and information that improve the visibility of new and emerging opportunities.

                                                                                                      Page 1
1.1 About Western Power
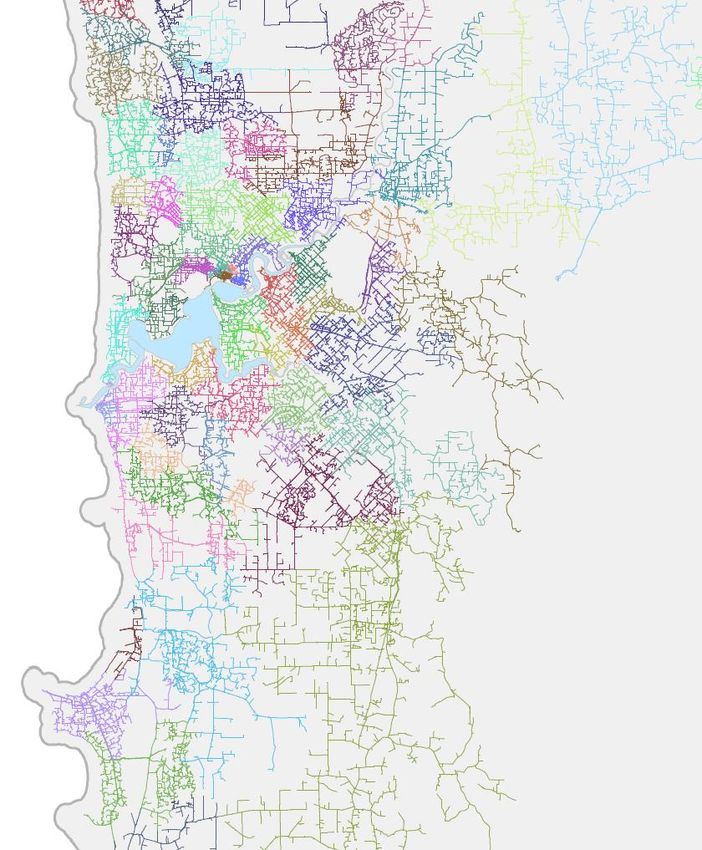
1.1.1 Our network
Figure 1.1: Overview of Western Power network within Western Australia
The Western Power network is unusual for two reasons: its geographical size and overall low density of
connections; and its isolation and lack of interconnections to any other large systems. These attributes
make the network uniquely challenging in both operation and maintenance.
Page 2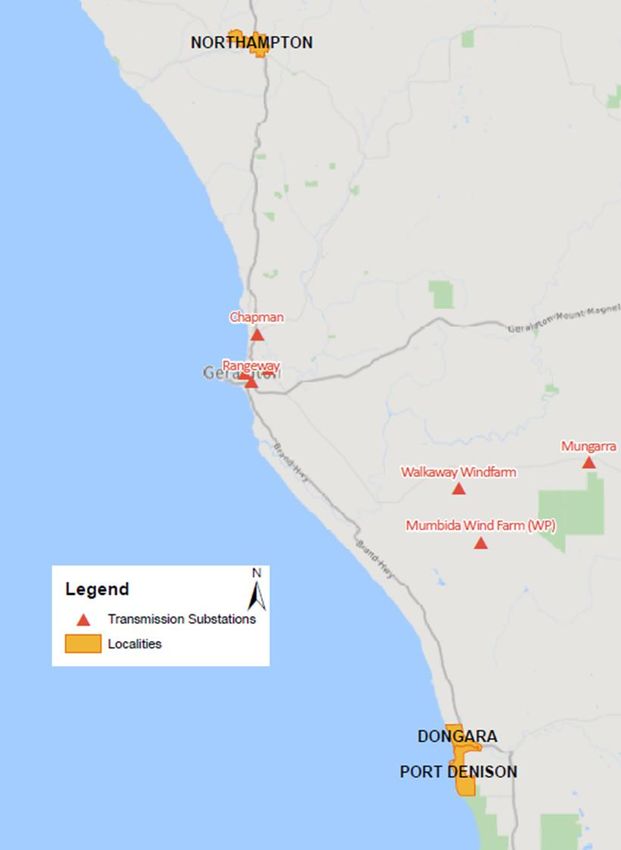
Figure 1.2: Western Power network metrics 2020-2021

The network incorporates:

    •   13 community power banks

    •   3000+ approved battery systems

    •   1.5 GW+ of rooftop solar (about 30 per cent of homes)

Western Power’s network is inherently dynamic and complex, with changing customer needs and
expectations. We aim to be agile and responsive to these factors while maintaining a safe, reliable and
efficient electricity supply, to ultimately deliver an affordable and quality product for all Western
Australians.

1.1.2         Our Vision, Purpose and Values

Our Vision

We deliver on the changing energy needs of Western Australians, powered by community trust and the
passion of our people.

Our Purpose

We provide a safe, reliable and efficient electricity supply for our customers.

Our Values

    •   Safety First
            o We respect and take care of each other, our community and the environment.
            o We choose safety – if it’s not safe we don’t do it.
    •   Customer Focus
            o We accept responsibility, do what we say and think about how our work affects others.
            o Our solutions are relevant and make financial sense for our community.

                                                                                                     Page 3
• Be Bold
o We embrace change and have a go.
o We challenge the status quo to deliver better outcomes.
o We learn and adapt quickly – we’re nimble.
• Teamwork
o We invite the diverse opinion of others and work together.
o We share ideas that advance our knowledge to develop energy solutions for our
community.
1.1.3 Our operating environment
Figure 1.3: Western Power’s role within the Western Australia’s electricity market
Western Power is a Western Australian State Government owned corporation responsible for building,
maintaining and operating an electricity network. It is licenced under the Electricity Industry Act 2004 (Act)
and regulated by the Economic Regulation Authority (ERA), which grants us the Electricity Transmission
Licence (ETL2) and Electricity Distribution Licence (EDL1) and determines Western Power’s revenue,
services, policies and incentives via the access arrangement (AA). The network facilitates the Wholesale
Electricity Market (WEM) which is operated by the Australian Energy Market Operator (AEMO).
These laws and regulations govern all aspects of our operations, from how funding for works is obtained, to
standards of supply and tariff structure. For more information, please visit the Energy Policy WA (EPWA)
website1.
1 https://www.wa.gov.au/organisation/energy-policy-wa/regulatory-framework
Page 41.2 Role of Network Opportunity Map
1.2.1 What is the Network Opportunity Map?
The Network Opportunity Map is a new regulatory requirement for Western Power outlined in chapter 6A
of the Access Code2. The detailed requirements for the content and timing of the Network Opportunity
Map can be found in Appendix A, along with references to sections of this document that address each
requirement.
The Access Code changes are intended to work hand in hand with a number of other initiatives (Section 1.3)
aimed at transforming our electricity industry into a flexible, future-focused model that leverages cleaner
and more efficient new technologies in a more sustainable way.
With this in mind, Western Power created a dedicated Network Opportunity Map Webpage (NOM
Webpage) within its public website: www.westernpower.com.au/network-opportunity-map
The NOM Webpage, published on 1 October 2021, houses all the Network Opportunity Map related
documentation and data, as well as forms, links and contact details including:
• The first edition of the head document, Network Opportunity Map 2021 (NOM2021, this
document)
• The first edition of the Alternative Options Strategy 2021 (AOS2021)
• The first edition of the Model Alternative Option Service Contract 2021 (MAOSC2021)
• Data sheets supporting the first edition of NOM2021
• A Vendor NOM Registration form (three-year rolling register)
• Email contact for feedback and suggestions (Network.opportunities@westernpower.com.au).
It is anticipated that future versions of the NOM Webpage, including the nature and format of information
published, will evolve both in content and method of delivery as Western Power improves how information
is assessed and delivered, informed by changes in the network, market behaviour and stakeholder
feedback.
1.2.2 How are constraints identified?
The network we operate is always changing: the topology changes daily due to switching for planned and
un-planned reasons, while the profile of demand and supply at various points can change minute by
minute. Because of this, a number of assumptions must be made when identifying emerging risks and
constraints. These are based on the best data available at the time, including but not limited to anticipated
demand and supply patterns, the condition and capability of specific assets, changes in policy and
regulatory requirements, and emerging technology. More details about the methodologies that influence
network condition evaluations can be found in Appendix B of this document.
The risks and constraints identified in any NOM version offer a snapshot view of what we know about our
network at that point in time. The amount of detail associated with each constraint can vary significantly,
from well-defined and eventuating within a few years, to broad and with a timeframe extending to 10 years
or beyond. The speed with which a constraint progresses to maturity depends on many factors, including
the magnitude of the issue and applicable voltage as well as unforeseen events that may affect it.
2 https://www.wa.gov.au/sites/default/files/2019-08/ElecNetworksAccessCode.pdf
Page 5While the NOM is published once a year, the solution development process for the network is continuous,
with new information gathered about each issue year-round. A particular constraint is said to mature as the
level of its certainty, detail and definition increases.
Figure 1.4 below shows a typical constraint maturation lifecycle with some notional timing.
Conceptual Constraint Lifecycle
Figure 1.4: Example of a constraint maturation lifecycle
1.2.3 When is an opportunity ready for an alternative solution?
The emerging risks and constraints indicated within this document can be used to anticipate where, when
and what kind of solutions might be required on the network in the coming years, presenting opportunities
for participation. Some risks or constraints may suit alternative solutions, while others will be better served
by traditional network solutions. In either case all customers, industry and market participants can use the
information to gain an indication of the type of works Western Power may undertake in the short to
medium term, and to proactively offer solutions to overcome risks and constraints.
The magnitude and nature of an issue, as well as certainty of the timing for the risk or constraint, will play a
role in determining when Western Power needs to commit to a solution that will address or defer the issue.
Western Power may also evaluate the suitability of each risk or constraint as an opportunity for an
alternative solution, and establish a benefits baseline through comparison with a traditional network
solution.
When a particular risk or constraint (or a group) identified as suitable for an alternative solution reaches
critical maturity, a sourcing event will be raised through the NOM Webpage. Each sourcing event will run
independently in the form of a Registration of Interest (ROI), Expression of Interest (EOI) or Request for
Proposal (RFP), depending on constraint parameters.
Page 6Alternative Option Solution Sourcing
Figure 1.5: Alternative option solution sourcing
The information contained in a sourcing event document may include:
• Constraint details required for development of an alternative solution, such as constraint type,
timing, size and location
• Functional requirements for any acceptable solution, such as performance parameters, availability,
connection voltage and required in-service date
• Critical timeframes, such as a proposal submission deadline and duration of submission evaluation
period
• Additional vendor information required for evaluation, such as capability assurance and safety
records
• If applicable, details of a network solution being considered, such as cost and expected benefits
• Any amendments to the MAOSC relevant to the specific sourcing event.
In addition to the constraint information an ROI, EOI or RFP may also outline:
• Additional vendor information required for verification
• Selection criteria and proposed timeline for submission evaluation
• Any proposed amendments to the MAOSC.
Once an opportunity has been published, the usual processes associated with Western Power sourcing
events will be followed, including adherence to all related laws and policies.
1.2.4 How do vendors participate?
The most direct way to participate in NOM is by filling out the Vendor NOM Registration form on the NOM
Webpage. Registration is valid for three years and will be used by Western Power to notify all parties when
Page 7a new edition of NOM is available or when a new sourcing event is published. At the end of the three year
period, vendors will be invited to re-register. Whether registered or not, vendors can participate by
responding to sourcing events of interest in line with the relevant specifications.
Vendor Participation Pipeline
Figure 1.6: Vendor participation pipeline
Suppliers that are already part of one or more Western Power Preferred Vendor Panel will be notified
automatically if a published opportunity could relate to their established field of expertise.
An alternative way to participate is to contact Western Power through the feedback details provided on the
NOM Webpage: Network.opportunities@westernpower.com.au
The contact can be used to tell Western Power about technologies being developed that could be used as
alternative solution, or to offer assistance with constraints that have not yet reached maturity. We would
also like to hear ideas for improving the usefulness of the information contained within this document and
associated NOM processes.
1.3 Network of the Future
The traditional energy service business model – a network of assets that delivers electricity in a one-way
flow – is no longer the norm. Networks must facilitate bi-directional flow of energy, in addition to
incorporation of islanded systems, microgrids and stand-alone power systems (SPS).
Western Power is embracing this changing environment and transforming how we plan, build and operate
our network. New technologies and customers who are more conscious of their energy source are also
driving demand for renewable energy and non-traditional solutions.
The diagram below depicts the transition from the existing integrated network to a modular network. It is
reliant on community behaviour, technology advancement rates, regulation and policy.
Page 8Figure 1.7: A model of network evolution
Western Power is innovating with new technologies that have the potential to make the most of our
network and better meet customer needs. The network is being transformed through adoption of the new
technologies where they provide better cost and reliability performance compared to traditional solutions.
Figure 1.8: Modular grid and main elements of transformation
Some of the initiatives currently being developed or underway are explored in greater detail in the
following sections of the document. Many of these represent alternative options which are already
deployed on the network and form a template for types of solutions being sought for the emerging
network constraints under NOM.
Page 91.3.1 Energy Transformation Strategy (ETS)
The Energy Transformation Strategy (ETS)3 is the Western Australian Government’s work program aimed at
delivering secure, reliable, sustainable and affordable electricity for years to come. Western Power has a
significant role to play in assisting delivery of this objective, under the three work streams described here.
Whole of System Plan
A Whole of System Plan (WOSP)4 has been developed by the Energy Transformation Taskforce (ETT). Along
with AEMO, Western Power was a key contributor to this plan, which is informed by energy industry
stakeholders and market participants. It brings together the important aspects of power system planning
under a single umbrella.
The WOSP was a detailed study of how the South West Interconnected System (SWIS) may evolve in the
next 20 years. Using data provided by industry, the plan modelled four scenarios to show how changes in
demand, technology and the economy may shape electricity use and guide investments in large-scale
generation, storage and network solutions to achieve lowest-cost electricity. The study aggregated the
SWIS into 11 transmission zones to test the four scenarios, modelling the impact on emissions under each
scenario. Distribution network investments were not considered as part of the WOSP.
The Plan for the SWIS was released in October 2020 and:
• It identifies the best options for investment in our power system, to maintain security and
reliability at the lowest sustainable cost. For example:
o new generation connections were best located in the south west areas to use existing
network capacity and add generation diversity
o no transmission augmentations were indicated under low demand scenarios;
• some transmission augmentations may be required under higher demand scenarios assists in the
transition to a lower-emissions power system by guiding the efficient integration of renewable
generation and identifying opportunities for energy storage, which will play an increasing role in
meeting essential electricity needs; and
• it provides guidance to regulators and industry regarding efficient power system investment, and to
policymakers on the future needs of the power system.
Under the Access Code, priority network projects identified by the WOSP do not require a Regulatory Test
(more in Appendix C.2) determination, as the options analysis and modelling undertaken by the WOSP can
be relied upon for regulatory purposes. The first WOSP2020 did not identify any priority network
investments.
Future WOSPs may influence the content of future NOMs, particularly through storage opportunities
identification.
Foundation Regulatory Frameworks
Improving access to the Western Power network
Current network access arrangements do not make the best use of available transmission capacity and the
existing investment in the network, resulting in barriers to entry for new generators. The arrangements
3 https://www.wa.gov.au/organisation/energy-policy-wa/energy-transformation-strategy
4 https://www.wa.gov.au/government/document-collections/whole-of-system-plan
Page 10have also led to an outcome where generators have different rights to access the network, creating
inefficiencies in the dispatch of generators in the WEM.
The proposal to adopt a framework for fully constrained access aims to improve generator access to the
network by providing more equitable access for generators and optimising grid use. This will help remove
barriers to investment and facilitate access to the WEM for new low-cost and cleaner generation
technologies. By facilitating more efficient use of available network capacity, the reforms will also provide a
greater return on investment in new and existing network infrastructure that is ultimately paid for by
electricity consumers. Western Power is working with AEMO and EPWA towards a ‘go live’ date of 1
October 2022 for constrained access.
Delivering the future power system
In the face of the rapid transformation being experienced in the electricity sector, the market systems,
standards, obligations and frameworks that underpin the operation of the SWIS are under increasing
pressure.
The power system management and regulatory framework are being modernised to ensure:
• energy is dispatched at the lowest sustainable cost;
• the power system is not limited in its ability to accommodate growing levels of renewable
generation and other new technologies such as battery storage and electric vehicles, while
maintaining security and reliability; and
• timely and adequate signals for investment in the power system.
Following consultation, the ETT will make decisions on elements of market and regulatory design. These
decisions will form the basis for changes to market rules and regulations.
Distributed Energy Resources
In April 2020, the Minister for Energy released a DER Roadmap5 to ensure growing levels of DER can be
integrated into the State’s electricity systems safely and securely, and customers can continue to benefit
from solar PV and other new technologies.
The Roadmap will guide changes to policies, regulations, technical requirements and customer protections
to support integrating increasing levels of DER in the short, medium and longer term. More information is
available from the Energy Transformation Strategy website6.
1.3.2 Flexibility Services Pilot
Western Power is partnering with Western Australian businesses to build network support services7 into
commercial and industrial customer solutions as part of our drive to create a more sustainable, reliable and
innovative network for the future.
With our customers now not only consuming energy but also supplying energy, we’re changing the way we
manage our network to enable this two-way flow. We’re working with energy retailers and businesses to
explore opportunities available to generate, use and supply energy more effectively. Through network
5 https://www.wa.gov.au/government/publications/der-roadmap
6 https://www.wa.gov.au/organisation/energy-policy-wa/energy-transformation-strategy
7 https://cdn-au.mailsnd.com/26738/L5R4xFPqN17nj7EitGlOs0c2RShrbKL2pnN4rPRRHOE/3305166.pdf
Page 11support services, WA businesses can manage their distributed energy resources such as solar PV, batteries
and manageable loads like heating and cooling systems in a way that provides network support, in return
for compensation by Western Power. Our partners will receive financial benefits for modifying their energy
use and enabling us to manage the integration of renewables on the network more efficiently.
More information about the Flexibility Services Pilot is available on the Western Power website.8
1.3.3 Grid Transformation Engine
Network infrastructure typically has a long lifespan (beyond 50 years in many instances) which requires
forward-looking investment planning. The rapidly changing nature of energy consumption and the use of
electricity networks requires an update to traditional network planning approaches. The Grid
Transformation Engine (GTEng) is a software system which considers different economic, demographic and
technology scenarios across a 30-year period to inform network strategy, planning and investment.
Enhanced planning systems such as GTEng are an essential part of the capabilities needed to realise the full
benefits of new technology and regulatory changes.
1.3.4 Stand-alone Power Systems
Stand-alone Power Systems generate and store electricity without being connected to the grid. SPS offers
an alternative to poles and wires which require significant upgrades and/or replacement in parts of the
network with low population density. Following a very successful trial of six sites in the Great Southern
region, in October 2020 Western Power completed the installation of a further 52 units as part of an
ongoing SPS program.
The passing of the Electricity Industry Amendment Bill 2019 by State Parliament in April 2020 was a
significant milestone in the provision of new energy solutions for regional customers. The resulting
regulatory reforms will allow Western Power to add SPS units and storage devices to our regulated asset
base and recover these investments via network tariffs.
Large portions of the regional overhead network are maintained to service low customer and energy
density, and SPS provides a cost-effective alternative to network renewal in these areas. Supplying rural
customers with an SPS unit substantially improves supply quality and reliability, while materially reducing
bushfire and public safety risks. Further deployment of SPS is planned in the coming years.
1.3.5 Community Batteries
Western Power has installed 13 community batteries at several locations9 across our network. For the
majority of these batteries, we have partnered with Synergy, using PowerBank products that allow customers
to store excess electricity generated by their solar panels in a network-scale battery and draw on this during
peak times. We have also partnered with the Shire of Margaret River to install a community battery on the
customer side of meters – a unique trial to investigate the local network benefits of network-scale batteries
installed behind the meter. More community batteries are planned in the future.
8 https://westernpower.com.au/our-energy-evolution/projects-and-trials/100mw-industry-challenge
9 The full list of community battery sites at the time of writing is: Meadow Springs, Falcon, Ellenbrook (No. 1), Ashby, Two
Rocks, Canning Vale, Busselton, Kalgoorlie, Ellenbrook (No. 2 - Westgrove), Port Kennedy, Yokine, Parmelia, Margaret River
(behind-the-meter).
Page 121.3.6 Kalbarri Microgrid
A microgrid is a small-scale network that can operate independently or connected to the grid. The Kalbarri
microgrid will consist of a new 5MW, 4.5MWh utility scale battery which will supply Kalbarri in the event
that network power is interrupted. It will use renewable energy from residential and commercial sources,
including a nearby 1.6MW Synergy windfarm, to extend battery runtime during network outages.
Construction is underway and the microgrid is expected to be operational in 2021.
1.3.7 Perenjori Battery Energy Storage System
Perenjori is the first town in Western Australia to trial a backup battery energy storage system (BESS) to
improve reliability via a 1MW, 1MWh network battery installed on the outskirts of town. This world-first trial
addresses both longer and momentary outages for an entire rural town. The system came online at full
capacity in mid 2018 and has already provided substantially improved reliability for customers supplied via
the BESS.
Page 132. Transmission Network Opportunities
This section of the NOM2021 provides an overview of identified network challenges and emerging
opportunities on the transmission network, which covers voltages of 66 kV and above. In most cases the
identified risks and constraints have not yet evolved into discrete investments and opportunities but are
anticipated to do so within 10 years.
The Western Power transmission network extends from Geraldton in the north to Albany in the south and
to Kalgoorlie in the east. This area is split into four major geographic regions: East, North, South and
Central. A fifth much smaller region, Central Business District (CBD), is also shown in Figure 2.1. below for
transmission planning purposes.
Figure 2.1: Western Power’s transmission network regions
2.1 Challenges
Global energy transformation and increasing renewable generation incorporating inverter-based
technologies has triggered a greater awareness of a power system characteristic referred to as system
strength – a measure of voltage ‘stiffness’ that supports the correct and stable operation of the energy
system.
The system strength of a power system has typically been provided by traditional generation technologies
such as coal-fired generators and gas turbines. These same generators also provided most of the system
Page 14rotating inertia. With the displacement of traditional generators and the connection of large-scale inertia-
less renewables, system strength issues and issues relating to a reduction in system inertia are emerging.
Further information about the Asset Management challenges can be found in Appendix B.2.
2.2 Performance Parameters
Western Power routinely assesses the condition of the transmission network and its ability to supply
existing and future demand in accordance with the Technical Rules (TR)10. Our Network Performance
Framework, outlined in Figure 2.2, details the key parameters used to undertake transmission network
performance management.
Figure 2.2: Network Performance Framework
Some of performance parameters are quite broad and Western Power is still developing metrics that will
adequately demonstrate performance of the transmission network using them, with some indicators
covering multiple parameters. For example, the Zone Substation Loading metric could be used to
demonstrate both thermal and utilisation performance of those assets. These are further explored in the
following sections of this document.
It is important to note that only a small subset of scenarios has been considered here. Also, different
parameters can be the cause of the overall limits placed on any one asset depending on the specific
circumstances. Anyone proposing to use the information in this paper should independently verify and
check the accuracy, completeness, reliability, currency and suitability of that information for their own
purposes.
We are keen to understand which measures are useful in signalling opportunities and what other metrics
we should develop to support the market participation in solution development.
2.2.1 Zone Substation Loading
Zone substation loading reflects utilisation of substations against the thermal capacity limit of an asset,
using a forecast of substation peak net load. It is a key measure used in planning scenarios and can trigger
substation upgrades such as additional transformers and switchboards. It is important to note that peak
load forecast is a measure of the highest load a substation might have on a single occasion in any given
year.
10 Approved Technical Rules - Economic Regulation Authority Western Australia (erawa.com.au)
Page 15The metric is useful as it indicates available capacity at a given substation, highlighting opportunities to
connect load or to connect generation, as well as develop load management solutions that will delay or
remove the need for costly, network augmentation solutions. For more detail, please refer to Section 2.3.1.
2.2.2 Thermal Network Transfer Capacity
The thermal transfer capacity of the transmission network is the maximum transfer of power, in
megawatts, that can be achieved across a particular network boundary while ensuring assets remain within
their specified thermal limits.
This metric will indicate boundary transfer capacity and expected transfers at peak load. It is useful as it
highlights opportunities for generation, storage, load, demand side management and other services on
either side of the defined boundary that can assist with improving available transfer capacity across it. For
more detail, please refer to Section 2.3.2.
2.2.3 System Voltage Performance
System voltage performance is a measure of observed and forecast voltages against the transmission
network criteria set out in the TR.
Some basic indictors of this metric have been included and we are looking at ways they can be converted
into more specific opportunities. For more detail, please refer to Section 2.3.3.
2.2.4 Voltage Network Transfer Capacity
Due to the localised nature of voltage performance, transfer capacity boundaries are required to
adequately demonstrate opportunities to participate in voltage performance. The voltage boundaries are
under development, using a similar method to thermal boundaries. The maximum transfer capacity of each
voltage boundary will be specified based on the voltage steady state or step change performance.
No opportunities have been identified under this parameter for NOM2021, but more information is
anticipated to be ready for the 2022 edition.
2.2.5 Power System Stability
The pursuit of a cleaner, greener, low carbon future network has provided several stability challenges
requiring careful management. Renewable generation is typically inverter connected and when displacing
traditional generation technology, it reduces system inertia and fault levels, impacting system strength (see
Section 2.1) and stability.
Stability metrics will be designed to monitor system stability performance against the transmission network
stability criteria set out in the TR.
Due to the localised nature of stability performance, transfer capacity boundaries similar to those used in
voltage and thermal boundaries are required to adequately demonstrate opportunities to participate in
stability performance management.
No opportunities have been identified under this parameter for NOM2021, but more information is
anticipated to be ready for the 2022 edition.
Page 162.2.6 Network Reliability
Western Power’s network reliability requirements are set out across a number of regulatory codes,
including the Electricity Industry Network Reliability and Quality of Supply Code, or NQRS Code11, TR and
Access Arrangement Service Standard Benchmarks (SSB).
While there are a number of parameters that describe reliability, the focus of this document is on supply
during outages on critical transmission network components. Western Power has been contracting
generation facilities that can provide improved reliability to a particular network area or customer during
planned and unplanned outages.
This metric is under development with the intent of being ready for the 2022 edition of NOM.
2.3 Historical and Forecast Performance
This section provides a summary of transmission network performance based on utilisation, thermal,
voltage and reliability measures.
The detailed data that was used to produce some of these summaries can be accessed in the Network Data
link on the NOM Webpage, under Zone Substation Capacity and Zone Substation Forecasts.
2.3.1 Zone Substation Loading
Table 2.1 shows the existing utilisation and forecast peak load utilisation in the next 5 to 10 years for all
zone substations operated by Western Power, colour coded per the legend below.
LEGEND
Under utilised below 40%
Medium utilisation >40% & 75% &Table 2.1: Zone substation utilisation heat map
Substation Actual
Forecast Utilisation (POE10)
Region Substation Capacity Utilisation Comment
MVA 2020 2021 2022 2023 2024 2025 2030
Additional transformer (Scoping, RIS year 2023), new block load anticipated in
CBD COOK STREET (CK) 81 73% 82% 80% 81% 85% 105% 99%
2025
CBD FORREST AVENUE (F) 39 67% 69% 67% 65% N/A N/A N/A Substation retirement and transfer to HAY and JTE (Execution, RIS year 2023)
CBD HAY STREET (HAY) 143 52% 47% 46% 54% 54% 53% 53% Load transfer from F and W (Execution, RIS year 2023)
CBD JOEL TERRACE (JTE) 76 41% 41% 40% 78% 76% 74% 63% Load transfer from F and W (Execution, RIS year 2023)
CBD MILLIGAN STREET (MIL) 134 51% 53% 50% 52% 50% 47% 36% Load transfer from W (Execution, RIS year 2023)
CBD NORTH PERTH (NP) 77 71% 70% 70% 73% 72% 72% 70% Load transfer from W (Execution, RIS year 2023)
Substation retirement and transfer to HAY, JTE, MIL and NP (Execution, RIS year
CBD WELLINGTON STREET (W) 29 109% 91% 89% 88% N/A N/A N/A
2023)
East BLACK FLAG (BKF) 31 115% 146% 145% 144% 144% 144% 143% Additional transformer (Scoping, RIS year 2026)
East BOULDER (BLD) 62 46% 44% 44% 44% 44% 44% 44%
East BOUNTY (BNY) 10 102% 112% 112% 112% 112% 112% 112% 10 MVA loading TR compliance limit
East CARRABIN (CAR) 6 20% 17% 17% 17% 17% 18% 18%
East CUNDERDIN (CUN) 14 64% 63% 64% 64% 65% 65% 68%
East KELLERBERRIN (KEL) 6 54% 53% 52% 52% 52% 52% 52%
East KONDININ (KDN) 29 30% 32% 32% 32% 32% 32% 31%
East MERREDIN (MER) 13 85% 88% 89% 90% 92% 93% 99%
East NORTHAM (NOR) 41 65% 67% 66% 66% 66% 66% 65% Transformer upgrade (Planning, RIS year 2024)
East PICCADILLY (PCY) 64 60% 57% 58% 58% 59% 60% 64%
East SAWYERS VALLEY (SVY) 56 45% 45% 46% 47% 48% 69% 75% Load transfer from WUN (Scoping, RIS year 2027)
East SOUTHERN CROSS (SX) 13 17% 16% 15% 15% 15% 15% 15%
WESTERN KALGOORLIE
East 31 43% 43% 44% 45% 46% 47% 53%
TERMINAL (WKT11)
WESTERN KALGOORLIE
East 30 44% 55% 55% 88% 88% 88% 87% New block load anticipated in 2023
TERMINAL (WKT33)
East WUNDOWIE (WUN) 16 67% 68% 68% 68% 67% 67% N/A Substation retirement and transfer to SVY (Scoping, RIS year 2027)
East YERBILLON (YER) 4.50 54% 67% 75% 82% 88% 93% 123%
East YILGARN (YLN) 29 43% 56% 56% 56% 56% 56% 54%
Central AMHERST (AMT) 85 82% 79% 80% 80% 81% 81% 85%
Central ARKANA (A) 72 70% 69% 68% 67% 67% 67% 67%
Central Aust.Paper Mills (APM) 46 64% 63% 64% 65% 66% 67% 71%
Central BALCATTA (BCT) 53 30% 30% 30% 31% 32% 34% 42%
Central BEECHBORO (BCH) 86 78% 85% 87% 88% 90% 91% 98%
Page 18Substation Actual
Forecast Utilisation (POE10)
Region Substation Capacity Utilisation Comment
MVA 2020 2021 2022 2023 2024 2025 2030
Central BELMONT (BEL) 72 58% 57% 55% 53% 52% 52% 51%
Central BENTLEY (BTY) 56 36% 38% 75% 75% 74% 73% 71% Load transfer from TT (Execution, RIS year 2023)
Central BIBRA LAKE (BIB) 56 96% 97% 99% 100% 101% 102% 106% Managed by distribution transfer, if required
Central BYFORD (BYF) 77 95% 105% 107% 109% 111% 112% 122% Managed by distribution transfer, if required
Central CANNING VALE (CVE) 93 58% 56% 55% 54% 54% 53% 50%
Central CLARENCE STREET (CL) 43 68% 67% 66% 65% 64% 63% 58%
Central COCKBURN CEMENT (CC) 77 56% 60% 60% 58% 56% 54% 43%
Central COLLIER STREET (COL) 69 59% 53% 53% 53% 54% 54% 55%
Central COTTESLOE (CTE) 54 85% 86% 86% 86% 86% 86% 87%
Central DARLINGTON (D) 48 44% 47% 47% 47% 48% 48% 50%
Central EDMUND STREET (E) 43 60% 59% 57% 57% 57% 57% 61%
Central FORRESTFIELD (FFD) 80 33% 48% 49% 49% 50% 50% 53%
Central GOSNELLS (G) 77 76% 74% 70% 66% 63% 60% 46%
Central HADFIELDS (H) 77 64% 64% 63% 63% 62% 62% 60%
Central HAZELMERE (HZM) 27 86% 91% 91% 91% 91% 91% 91%
Central HENLEY BROOK (HBK) 53 106% 113% 117% 121% 125% 129% 149% Additional transformer (Initiation, RIS year 2027)
Central KALAMUNDA (K) 77 40% 42% 42% 41% 41% 41% 40%
Central KEWDALE (KDL) 56 59% 57% 64% 63% 62% 61% 57% Load transfer from TT (Execution, RIS year 2023)
Central MADDINGTON (MDN) 26 84% 88% 92% 96% 99% 102% 117% Managed by distribution transfer
Central MALAGA (MLG) 81 54% 45% 45% 46% 47% 48% 51%
Central MANDURAH (MH) 76 97% 99% 98% 98% 97% 96% 95% Managed by distribution transfer
Central MANNING STREET (MA) 43 77% 78% 76% 73% 71% 70% 66%
Central MASON ROAD (MSR) 74 57% 56% 55% 55% 55% 55% 54%
Central MEADOW SPRINGS (MSS) 86 81% 83% 83% 84% 84% 85% 86%
Central MEDICAL CENTRE (MCE) 83 57% 60% 61% 62% 63% 63% 68%
Central MEDINA (MED) 81 68% 65% 65% 66% 66% 67% 68%
Central MIDLAND JUNCTION (MJ) 94 63% 63% 63% 63% 63% 63% 63%
Central MORLEY (MO) 79 67% 66% 66% 66% 66% 65% 65%
Central MUNDAY (MDY) 54 41% 45% 45% 45% 45% 45% 45%
Central MURDOCH (MUR) 54 69% 70% 70% 70% 70% 71% 72%
Central MYAREE (MYR) 65 55% 59% 58% 57% 55% 53% 44%
Central NORTH BEACH (NB) 75 76% 75% 74% 73% 72% 71% 66%
Page 19Substation Actual
Forecast Utilisation (POE10)
Region Substation Capacity Utilisation Comment
MVA 2020 2021 2022 2023 2024 2025 2030
Central O'CONNOR (OC) 70 68% 72% 71% 70% 72% 76% 94%
Central OSBORNE PARK (OP) 63 78% 75% 74% 74% 73% 72% 70%
Central PINJARRA (PNJ) 57 35% 42% 44% 45% 46% 47% 51%
Central RIVERTON (RTN) 81 91% 85% 85% 84% 84% 83% 81%
Central RIVERVALE (RVE) 83 57% 57% 70% 70% 70% 70% 69% Load transfer from TT (Execution, RIS year 2023)
Central ROCKINGHAM (RO) 75 72% 71% 71% 72% 72% 72% 72%
Central SHENTON PARK (SPK) 71 71% 74% 74% 74% 74% 74% 73%
Central SOUTHERN RIVER (SNR) 85 92% 93% 95% 97% 99% 102% 112% Managed by distribution transfer
Substation retirement and transfer to BTY, KDL, and RVE (Execution, RIS year
Central TATE STREET (TT) 72 55% 58% 58% N/A N/A N/A N/A
2023). Some load transfers can happen up to 12 months before
Central WAIKIKI (WAI) 80 93% 95% 96% 98% 99% 100% 107% Managed by distribution transfer
Central WELSHPOOL (WE) 90 68% 70% 74% 73% 73% 73% 73% Load transfer from TT (Execution, RIS year 2023)
Central WEMBLEY DOWNS (WD) 43 83% 86% 88% 90% 92% 95% 109%
Central WILLETON (WLN) 26 85% 84% 81% 77% 75% 72% 60%
Central YOKINE (Y) 70 85% 85% 85% 86% 86% 88% 95%
North CHAPMAN (CPN) 31 43% 43% 43% 43% 42% 42% 41%
North CLARKSON (CKN) 56 128% 116% 116% 115% 115% 114% 112% Managed by distribution transfer
North ENEABBA (ENB) 31 29% 27% 26% 26% 26% 26% 28%
North GERALDTON (GTN) 65 44% 54% 54% 54% 53% 52% 49%
North JOONDALUP (JDP) 53 101% 104% 107% 108% 110% 112% 120% Managed by distribution transfer
North LANDSDALE (LDE) 88 89% 88% 88% 88% 88% 88% 88%
North MOORA (MOR) 16 89% 95% 95% 95% 96% 96% 99%
North MUCHEA (MUC) 51 51% 52% 52% 53% 53% 53% 54%
North MULLALOO (MUL) 66 76% 75% 75% 74% 74% 73% 71%
North PADBURY (PBY) 82 80% 71% 72% 72% 73% 73% 76%
North RANGEWAY (RAN) 69 51% 44% 45% 46% 48% 49% 55%
North REGAN (RGN22) 19 55% 54% 52% 52% 53% 55% 62%
North REGAN (RGN33) 19 73% 51% 51% 51% 52% 52% 54%
North THREE SPRINGS (TS) 16 52% 53% 55% 56% 56% 57% 61%
North WANGARRA (WGA) 28 72% 81% 83% 86% 89% 92% 105%
North WANNEROO (WNO) 84 60% 69% 69% 69% 69% 69% 69%
North YANCHEP (YP) 61 69% 68% 69% 71% 73% 76% 90%
South ALBANY (ALB) 60 89% 90% 89% 89% 88% 88% 85%
Page 20Substation Actual
Forecast Utilisation (POE10)
Region Substation Capacity Utilisation Comment
MVA 2020 2021 2022 2023 2024 2025 2030
South BEENUP (BNP) 14 42% 46% 47% 48% 48% 47% 42%
South BODDINGTON (BOD) 10 45% 54% 54% 54% 54% 54% 55%
South BRIDGETOWN (BTN) 29 96% 104% 104% 104% 105% 105% 107% Demand side management
BUNBURY HARBOUR
South 62 107% 105% 105% 105% 106% 106% 108% Managed by distribution transfer
(BUH)
South BUSSELTON (BSN) 71 70% 71% 72% 74% 75% 76% 81%
South CAPEL (CAP) 22 92% 115% 115% 126% 126% 126% 125% Transformer upgrade (Scoping, RIS year 2027)
South COLLIE (CO) 30 53% 52% 52% 51% 51% 50% 48%
South COOLUP (CLP) 12 48% 41% 41% 41% N/A N/A N/A Substation retirement and transfer to WGP (Execution, RIS year 2022)
South KATANNING (KAT) 20 72% 73% 73% 73% 73% 73% 74%
South KOJONUP (KOJ) 10 27% 27% 27% 27% 27% 27% 27%
South MANJIMUP (MJP) 29 50% 49% 48% 46% 45% 45% 41%
South MARGARET RIVER (MR) 37 47% 46% 46% 47% 47% 47% 48%
South MARRIOTT ROAD (MRR) 67 55% 92% 92% 93% 93% 93% 95% Demand side management
South MOUNT BARKER (MBR) 44 15% 17% 17% 16% 16% 15% 13%
South NARROGIN (NGN) 40 41% 39% 40% 40% 41% 41% 43%
South PICTON (PIC) 74 57% 65% 66% 67% 68% 69% 73%
South WAGERUP (WGP) 30 41% 48% 47% 64% 64% 64% 63% Load transfer from CLP (Execution, RIS year 2022)
South WAGIN (WAG) 6 89% 88% 88% 87% 86% 86% 83%
RIS refers to required in-service dates and may not align perfectly with changes in substation utilisation as load transfers can happen at any time during the
project.
POE refers to Probability of Exceedance and more info on this parameter can be found in Appendix B.3.
Page 212.3.2 Thermal Network Transfer Capacity
To assess the performance of thermal transfer capacity measures, a series of network boundaries are
defined in each region based on active constraints in transmission networks.
The network boundaries for South and North regions are detailed in the following sub-sections. Defining
boundaries for other regions (East, CBD and Central) is in progress and results will be available in the 2022
edition.
2.3.2.1 South Region
Export Boundaries
The most active network export boundaries in the South Region are shown in Figure 2.3. These boundaries
are defined using the worst contingency ( ) and the worst overload circuit (*).
Northern, Southern & Guildford Terminals
OLY
330 kV
220 kV
132 kV
66 kV
LWT WGP WLT
East Country
KMP * SHO
KEM
NGS NGN
WOR
WCL
BSI MRR WAG
KAT
BUH MU
* KOJ
WSD PIC CO
CAP
BTN
MBR
BSN
ALB
MR
BNP MJP SEEXP 01
SWEXP 01
Figure 2.3: Network export boundaries in South Region (SWEXP 01; SEEXP 01)
Figure 2.4 and Figure 2.5 show a comparison between peak transfer in the next 10 years with the existing
export capacity for SWEXP 01 and SEEXP 01 boundaries.
Page 22Figure 2.4: Peak transfer and export capacity in boundary SWEXP 01
Figure 2.5: Peak transfer and export capacity in boundary SEEXP 01
Import Boundaries
Figure 2.6 shows the most active network import boundaries in the South Region. These boundaries are
defined using the worst contingency ( ) and the worst overload circuit (*).
Page 23Northern, Southern & Guildford Terminals
330 kV East Country
220 kV
132 kV
66 kV KMP
KEM
NGS NGN
* WOR
WCL
BSI MRR WAG
KAT
BUH
* MU
* KOJ
WSD PIC CO
CAP
BTN
*
MBR
BSN
ALB
MR
BNP MJP SEIMP 01
SWIMP 02
SWIMP 01
SCIMP 01
Figure 2.6: Network import boundaries in South Region (SWIMP 01; SWIMP 02; SEIMP 01; SCIMP 01)
Peak transfer in the next 10 years is compared with the existing import capacity for SWIMP 01, SWIMP 02,
SEIMP 01, SCIMP 01 boundaries in Figure 2.7 to Figure 2.10 below.
Figure 2.7: Peak transfer and import capacity in boundary SWIMP 01
Page 24Figure 2.8: Peak transfer and import capacity in boundary SWIMP 02
Figure 2.9: Peak transfer and import capacity in boundary SEIMP 01
Figure 2.10: Peak transfer and import capacity in boundary SCIMP 0112
12 As the worst contingency is N-1-1 type, peak load has been scaled by a factor of 80% for assessment.
Page 252.3.2.2 North Region
Export Boundaries
The most active network export boundaries in the North Region are shown in Figure 2.11. These
boundaries are defined using the worst contingency ( ) and the worst overload circuit (*).
TS-MW EXP
NC-TS EXP
Kalbarri
Chapman
Geraldton Golden
Grove
Rangeway Mungarra
Walkaway
Wind Farm
Karara
Mumbida Mine
Wind Farm
* Three
Springs
Three Springs
Terminal
*
Eneabba
Eneabba
Terminal
Badgingarra
Emu Downs Moora
Yandin
Cataby Terminal
MW-NB EXP
Regans
*
Kerr McGee
Muchea
Pinjar Muchea
NB-MN EXP
Newgen
Yanchep Neerabup
Clarkson
Neerabup
Wanneroo
Terminal
* 330 kV
220 kV
132 kV
Joondalup 66 kV
33 kV
Mullaloo Northern Terminal Load Area
Figure 2.11: Network export boundaries in North Region (NC-TS EXP; TS-MW EXP; MW-NB EXP; NB-MN
EXP)
Figure 2.12 to Figure 2.15 show a comparison between peak transfer and existing export capacity in the
next 10 years for export boundaries defined in Figure 2.11.
Page 26The following assumptions are made when calculating the peak transfer and existing export capacity of the
boundaries:
• The MARNET13 protection scheme is enabled
• The Neerabup (NBT) transformer is out of service
Listed below are generators in the North Region subject to Generator Interim Access (GIA) constraining
mechanisms:
• Beros Road wind farm (9.8 MW)
• Badgingarra wind and solar farm (130 MW)
• Warradarge wind farm (180 MW)
• Yandin wind farm (210 MW)
Figure 2.12: Boundary transfer capacity – NC-TS EXP
Figure 2.13: Boundary transfer capacity – TS-MW EXP
13 A particular protection scheme applicable to the relevant scenarios in this region.
Page 27Figure 2.14: Boundary transfer capacity – MW-NB EXP
Figure 2.15: Boundary transfer capacity – NB-MN EXP
Import Boundaries
The most active network import boundaries in the North Region are shown in Figure 2.16. These
boundaries are defined using the worst contingency ( ) and the worst overload circuit (*).
Page 28You can also read