NEANIAS Novel EOSC services for Emerging Atmosphere, Underwater
←
→
Page content transcription
If your browser does not render page correctly, please read the page content below
NEANIAS
 Novel EOSC services for Emerging Atmosphere, Underwater and
                        Space Challenges

                                Deliverable Report

Deliverable: D3.1 Requirements, Specifications & Software Development Plan
for Atmospheric Services

30/04/2020

          NEANIAS is funded by European Union under Horizon 2020 research and innovation
          programme via grant agreement No. 863448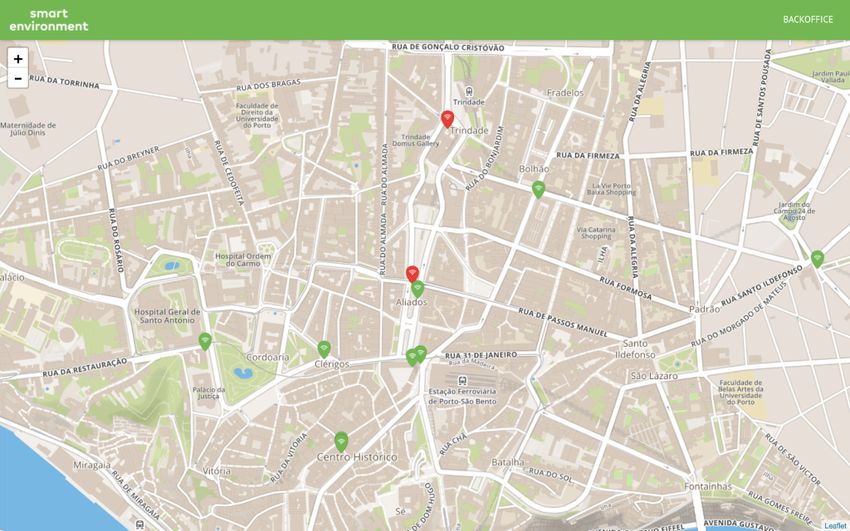
www.neanias.eu
Requirements, Specifications & Software Development Plan for Atmospheric Services

Document Info

Project Information
Acronym                 NEANIAS
Name                    Novel EOSC Services for Emerging Atmosphere, Underwater & Space
                        Challenges
Start Date              1 Nov 2019                     End Date       31 Oct 2022
Program                 H2020-EU.1.4.1.3. - Development, deployment and operation of ICT-based e-
                        infrastructures
Call ID                 H2020-INFRAEOSC-2018-          Topic          H2020-INFRAEOSC-2019-1
                        2020
Grant No                863448                         Instrument     RIA
Document Information
Deliverable No          D3.1
Deliverable Title       Requirements, Specifications & Software Development Plan for Atmospheric
                        Services

Due Date                30-Apr-2020                       Delivery Date 08-May-2020
Lead Beneficiary        UBIWHERE (6)
Beneficiaries (part.)   NOA (20); MEEO (17); UNIMIB (11); ATHENA (2); NKUA (1);
Editor(s)               Ricardo Vitorino (Ubiwhere); Konstantinos Karantzalos (NKUA); Spyridon
                        Rapsomanikis (Athena)
Authors (s)             Ricardo Vitorino, Francisco Cardoso (Ubiwhere); Konstantinos Karantzalos
                        (NKUA); Spyridon Rapsomanikis (Athena)
Contributor (s)         Diogo Oliveira, João Garcia, Carlos Cortinhas (Ubiwhere); Filippos Bodare
                        (ATHENA); Olyna Olympia Gounari (NKUA); Alessandro Tibaldi (UNIMIB)
Reviewer(s)             Ugo Becciani, Sergio Molinari (INAF)
Workpackage No          WP3
Version                 V.1.0                         Stage          Final
Version details         Revision: 31 . Last save: 2020-05-07 , 15:33
                        Pages: 46 . Characters: 64.846
Distribution            Public                        Type           Report
Keywords                EOSC; Services; Cloud Computing; Atmospheric Research;

2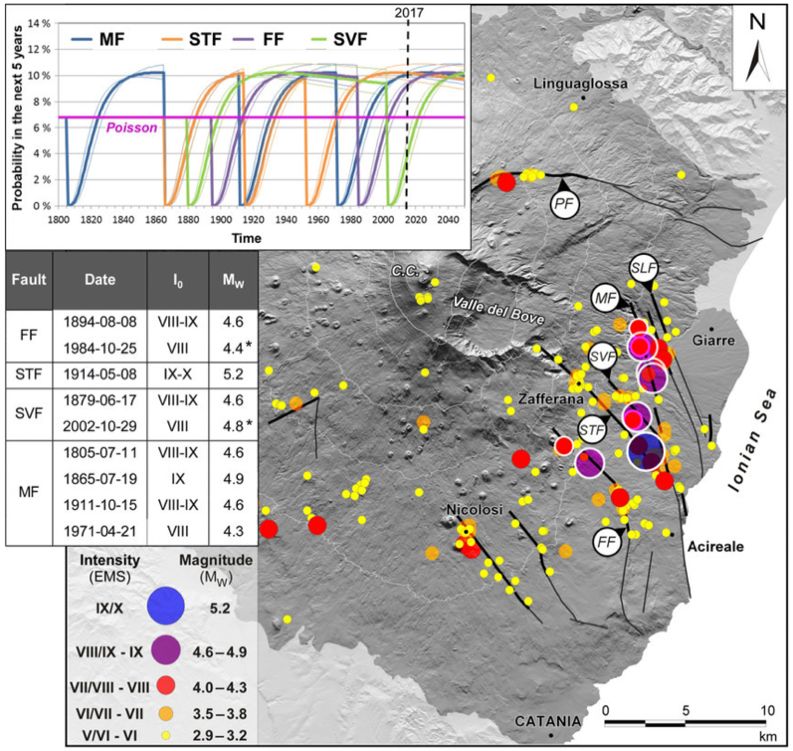
www.neanias.eu
Requirements, Specifications & Software Development Plan for Atmospheric Services

Change Record

Version    Date         Description                             Editor(s)
V1.0       8/5/2020     Document version submitted to EC        R. Vitorino

3
www.neanias.eu
 Requirements, Specifications & Software Development Plan for Atmospheric Services

Disclaimer

NEANIAS is a Research and Innovation Action funded by European Union under Horizon 2020 research
and innovation programme, via grant agreement No. 863448.
NEANIAS is project that comprehensively addresses the ‘Prototyping New Innovative Services’ challenge
set out in the ‘Roadmap for EOSC’ foreseen actions. It drives the co-design, delivery, and integration into
EOSC of innovative thematic services, derived from state-of-the-art research assets and practices in three
major sectors: underwater research, atmospheric research and space research. In each sector it engages a
diverse set of research and business groups, practices, and technologies and will not only address its
community-specific needs but will also enable the transition of the respective community to the EOSC
concept and Open Science principles. NEANIAS provides its communities with plentiful resource access,
collaboration instruments, and interdisciplinary research mechanisms, which will amplify and broaden each
community’s research and knowledge generation activities. NEANIAS delivers a rich set of services,
designed to be flexible and extensible, able to accommodate the needs of communities beyond their original
definition and to adapt to neighbouring cases, fostering reproducibility and re-usability. NEANIAS identifies
promising, cutting-edge business cases across several user communities and lays out several concrete
exploitation opportunities.
                               This document has been produced receiving funding from the European
                               Commission. The content of this document is a product of the NEANIAS
                               project Consortium and it does not necessarily reflect the opinion of the
                               European Commission. The editor, author, contributors and reviewers of this
                               document have taken any available measure in order for its content to be
                               accurate and lawful. However, neither the project consortium as a whole nor
                               the individual partners that implicitly or explicitly participated in the creation
and publication of this document may be held responsible for any damage, financial or other loss or any other
issue that may arise as a result of using the content of this document or any of the project outputs that this
document may refer to.
The European Union (EU) was established in accordance with the Treaty on the European Union
(Maastricht). There are currently 27-member states of the European Union. It is based on the European
Communities and the member states’ cooperation in the fields of Common Foreign and Security Policy and
Justice and Home Affairs. The five main institutions of the European Union are the European Parliament,
the Council of Ministers, the European Commission, the Court of Justice, and the Court of Auditors
(http://europa.eu.int/).

4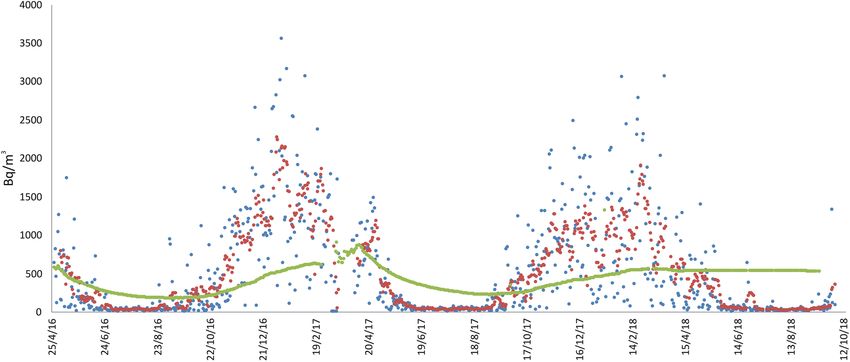
www.neanias.eu
  Requirements, Specifications & Software Development Plan for Atmospheric Services

Table of Contents

Document Info .................................................................................................................................................................... 2
Change Record ................................................................................................................................................................... 3
Disclaimer ........................................................................................................................................................................... 4
Table of Contents ............................................................................................................................................................... 5
Tables of Figures & Tables ................................................................................................................................................ 6
Abstract ............................................................................................................................................................................... 8
1.      Introduction ............................................................................................................................................................... 9
     1.1.    Context .............................................................................................................................................................................. 9
     1.2.    Contents and Rationale ..................................................................................................................................................... 9
     1.3.    Structure of the document ................................................................................................................................................. 9
2.      User Requirements for the Atmospheric Services ................................................................................................ 10
     2.1.     Atmospheric End-user Communities .............................................................................................................................. 10
        2.1.1.     Urban air quality authorities ................................................................................................................................. 11
        2.1.2.     Geologists, Geohazards and civil protection stakeholders.................................................................................... 11
        2.1.3.     Meteorological services ......................................................................................................................................... 12
        2.1.4.     Energy and Power sector and industrial emitters ................................................................................................. 12
        2.1.5.     Ecologists ............................................................................................................................................................... 12
        2.1.6.     Rural/urban planners ............................................................................................................................................. 13
        2.1.7.     Insurance and health.............................................................................................................................................. 13
     2.2.     Relevant Atmospheric Datasets and Products ................................................................................................................ 13
        2.2.1.     Data and Products for Urban air quality authorities ............................................................................................ 13
        2.2.2.     Data and Products for Geologists ......................................................................................................................... 19
        2.2.3.     Data and Products for Meteorological services .................................................................................................... 21
     2.3.     Atmospheric Sector: Current Software and Services ..................................................................................................... 29
        2.3.1.     [A1] – Greenhouse gases flux density monitoring service .................................................................................... 31
        2.3.2.     [A2] – Monitoring atmospheric perturbations and components in active tectonic regions service ..................... 32
        2.3.3.     [A3] – Air quality estimation, monitoring and forecasting service ....................................................................... 33
     2.4.     User Requirements for Atmospheric Services ................................................................................................................ 35
3.       Co-design and Service Specifications..................................................................................................................... 37
4.      Software Development Plan and Guidance ........................................................................................................... 39
     4.1.    [A1] – Greenhouse gases flux density monitoring service implementation ................................................................... 39
     4.2.    [A2] - Monitoring atmospheric perturbations and components in active tectonic regions service implementation ...... 40
     4.3.    [A3] - Air quality estimation, monitoring and forecasting service implementation....................................................... 42
5.       Evaluation – Conclusions – Future Steps .............................................................................................................. 43
6.       References ................................................................................................................................................................ 44
List of acronyms ............................................................................................................................................................... 45
7.       Appendix .................................................................................................................................................................. 46

5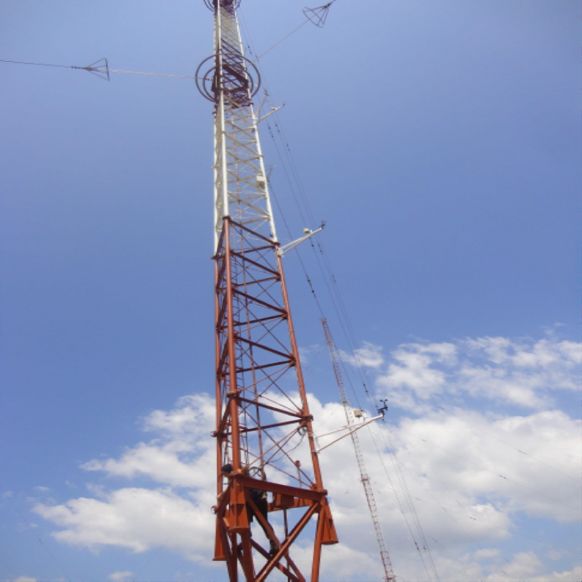
www.neanias.eu
Requirements, Specifications & Software Development Plan for Atmospheric Services
Tables of Figures & Tables
Document Figures
Figure 1 – Monitar Air Quality Monitoring Station (left) and Weather station (right) ............................................................ 13
Figure 2 – Urban Platform real-time map.............................................................................................................................. 14
Figure 3 – Urban Platform Air Quality analysis from an in-situ monitoring station ................................................................ 15
Figure 4 – Urban Platform Weather analysis from an in-situ monitoring station ................................................................... 15
Figure 5 – Urban Platform Air Quality analysis with customizable dashboard and charts ...................................................... 16
Figure 6 – Smart Air Quality real-time map ........................................................................................................................... 17
Figure 7 – Smart Air Quality individual analysis from an in-situ monitoring station ............................................................... 17
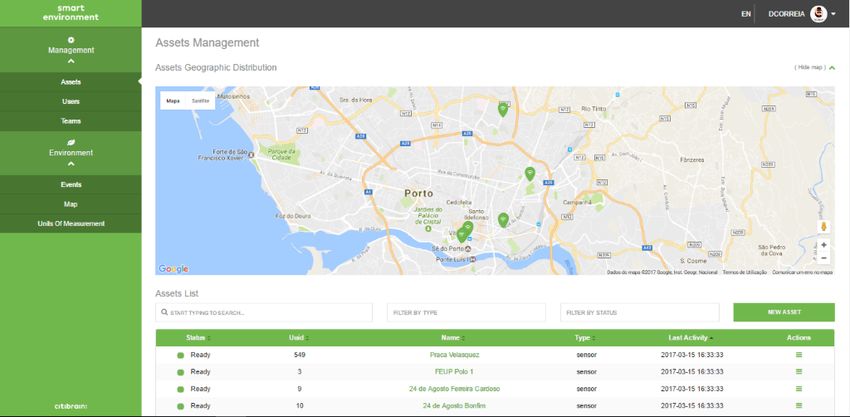
Figure 8 – Smart Air Quality asset management (stations and teams). .................................................................................. 18
Figure 9 – Main active faults of Mt Etna and main historic seismic events. ........................................................................... 20
Figure 10 – Simplified geological map of Mt Etna with main active faults and the sites of indoor radon measurements. The
urbanized areas are shown in light gray. PFS, Pernicana fault system; RFS, Ragalna fault system; TFS, Timpe fault
system; FF, Fiandaca fault; TF, Trecastagni fault; ATF, Aci Trezza fault. ......................................................................... 21
Figure 11 – 2016-2018 Radon measurements recorded at Mt Etna in the Giarre municipality. Radon concentration are
presented as daily (blue line), weekly (red), and long-term (green) averages. No data interruption occurred during the
acquisition period. ....................................................................................................................................................... 21
Figure 12 – VOAGr MET Tower. ............................................................................................................................................ 22
Figure 13 – VOAGr MET TOWER graphical form flux densities using different flux densities calculating methods. ................ 23
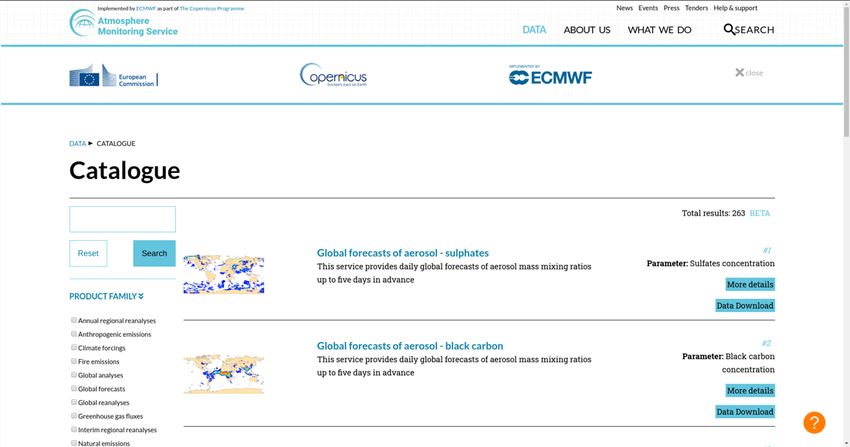
Figure 14 – Copernicus online catalogue of data. .................................................................................................................. 27
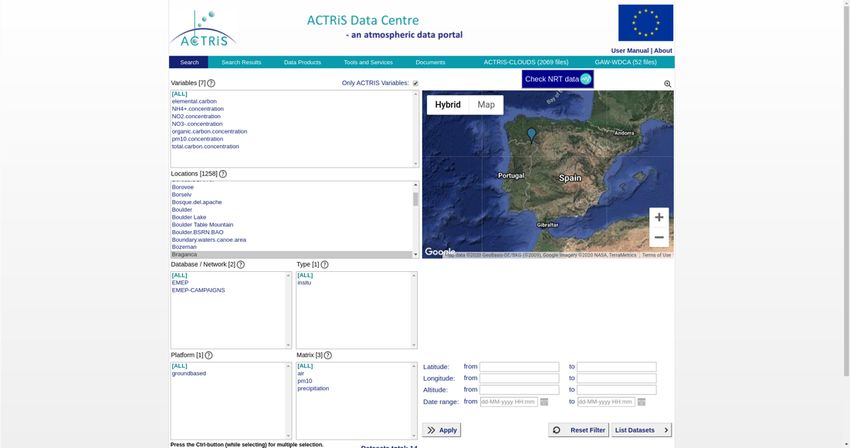
Figure 15 – ACTRiS Data Centre (an online portal for data). .................................................................................................. 28
Figure 16 – ACTRIs processing data through its portal. .......................................................................................................... 28
Figure 17 – Example of fluxes on the 24th July 2013 with different data filtering. .................................................................. 30
Figure 18 – Example latent heat flux density......................................................................................................................... 30
Figure 19 – Example of determined Evapotranspiration on 25-30 July 2013. ......................................................................... 31
Figure 20 – Comparison of the determination Sensible Heat fluxes by Eddy Covariance and Variances methods .................. 31
Figure 21 – Algorithm of polynomial function (k = 3). Thick bars illustrate local orientations of maximum horizontal stress
axes. A) Gridded map of calculated stress field. Thin bars illustrate calculated maximum horizontal stress axes on the
grid nodes. B) Corresponding calculated stress trajectory map. Figure from (Lee and Angelier, 1994) .......................... 32
Figure 22 – Algorithm of distance-weighting method (R = 60, p = 2). Thick bars show local orientations of maximum
horizontal stress axes. A) Gridded map of calculated stress field; thin bars indicate local maximum horizontal stress
axes. B) Corresponding calculated stress trajectory map. Figure from (Lee and Angelier, 1994) .................................... 33
Document Tables
Table 1 – End-user communities for Atmospheric Services ................................................................................................... 11
Table 2 – Monitar’s air quality parameters ........................................................................................................................... 14
Table 3 – Monitar’s weather parameters .............................................................................................................................. 14
Table 4 – Dataset for Urban air quality authorities ............................................................................................................... 19
Table 5 – Dataset for Geologists ........................................................................................................................................... 19
Table 6 – Dataset for Meteorological Services ...................................................................................................................... 22
Table 7 – OpenWeather Dataset from its service .................................................................................................................. 24
Table 8 – OpenWeather API conditions ................................................................................................................................ 24
Table 9 – IPMA Dataset from its service................................................................................................................................ 25
Table 10 – IPMA API conditions ............................................................................................................................................ 25
Table 11 – DarkSky Dataset from its service.......................................................................................................................... 25
Table 12 – DarkSky API conditions ........................................................................................................................................ 25
Table 13 – AQICN API conditions .......................................................................................................................................... 26
Table 14 – User Requirements for Atmospheric Services ...................................................................................................... 35
Table 15 – Acceptance criteria for user requirements ........................................................................................................... 36
Table 16 – Co-Design Specifications ...................................................................................................................................... 38
6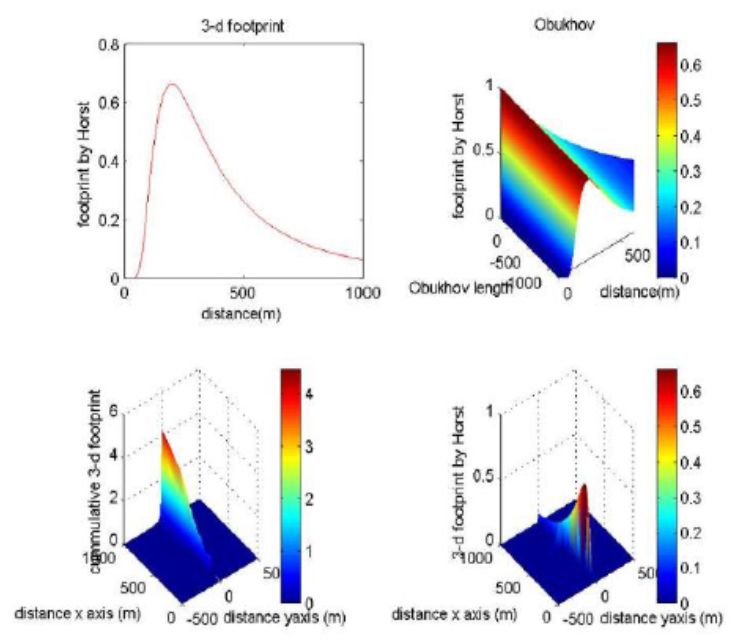
www.neanias.eu
 Requirements, Specifications & Software Development Plan for Atmospheric Services

Table 17 – Software plan for A1 ............................................................................................................................................ 39
Table 18 – Software plan for A2 ............................................................................................................................................ 41
Table 19 – Software plan for A3 ............................................................................................................................................ 42

7
www.neanias.eu
 Requirements, Specifications & Software Development Plan for Atmospheric Services

Abstract

The objective of Deliverable D3.1 is to report on requirements, specifications and software development plan
of the Atmospheric Research Services. The present document describes the different end-user communities
working within the Atmospheric theme and their research needs, the datasets and products used and needed
by these communities, as well as the current status of employed software and services. Then it describes a
mapping of requirements to the technical specifications and finally, the foreseen software development plan.

8
www.neanias.eu
 Requirements, Specifications & Software Development Plan for Atmospheric Services

1.     Introduction
 1.1. Context
In the framework of WP3, NEANIAS will deliver cloud-based services that target specific challenges of the
atmospheric thematic sector. WP3 embraces co-design under an agile methodology that spans all project
activities, where service consumers and providers are engaged in a cycle of requirements, design,
implementation/verification, evaluation and feedback. WP3 activities are amplified by engagement and
onboarding activities, ensuring the potential of sustainability from the perspective of adoption and uptake. In
particular, bringing together experts and know-how from Open Science, EOSC and Research Infrastructures,
such as National and Kapodistrian University of Athens, Università Degli Studi di Milano Bicocca and
Athena Research Centre, just to name a few, NEANIAS seeks not only to satisfy the needs of the atmospheric
sector communities, boarding the cloud era, but also to identify and elevate opportunities that exploit the
plentiful resources (data, CPU, storage, services) at reach, weaving innovative value chains and innovative
ways to conduct e-science.
In such a context, the first Task of WP3 i.e., ‘T3.1 atmospheric research sector user requirements, service
co-design and gap analysis’ has analysed information, data and requirements collected from the
Atmospheric-related application domains and user communities to form the first deliverable of WP3, the
present document: ‘D3.1 atmospheric Research Services Report on requirements, Specifications & Software
development Plan’.

 1.2. Contents and Rationale
The scope of Deliverable D3.1 is to document the preliminary efforts undertaken within the context of T3.1,
containing, in particular, the requirements, specifications and software development plans for the
Atmospheric Research Services.
In particular, to properly collect requirements (categorised below), the atmospheric end-user communities,
the involved datasets and products and the current status of employed software and services are presented.
A mapping of requirements to technical specifications has been performed and finally an adequate software
development plan has been prepared.

 1.3. Structure of the document
The deliverable is structured in five sections (chapters), being the first one responsible for introducing the
report, briefly mentioning its content and how it is structured. Chapter 2 describes the Atmospheric end-user
communities (section 2.1), their datasets and products (section 2.2), the current state of the software and
services employed (section 2.3) and the requirements (section 2.4), while Chapter 3 details their co-design
and specifications, including a gap analysis. Chapter 4 presents the software development plan and guidance,
including the presentation of the preliminary architecture of the Atmospheric Services and the datasets to
validate the services. Finally, Chapter 5 outlines the conclusions and future steps.

9
www.neanias.eu
 Requirements, Specifications & Software Development Plan for Atmospheric Services

2.     User Requirements for the Atmospheric Services
This chapter aims at defining the user requirements of the project. To do so, first, the target communities will
be identified (who they are, their needs and how NEANIAS can help them), and then current existing
products and datasets will be listed and described, which will help in identifying tools and sources that can
be helpful in designing, implementing and testing NEANIAS. Finally, current software and services will be
studied to understand which tools can help in the development of the project. With this, it will be possible to
define the user requirements of the project.

 2.1. Atmospheric End-user Communities
In this section, target end-user communities are identified, where it is described who they are, what they need
(in the form of user stories) and how NEANIAS can help achieve such purpose. This is an important step in
understanding what to do along the project, since the developed product must be useful and valuable to its
end-users. The end-user communities for the Atmospheric Services are listed below, being analysed in more
detail afterwards.

 End-user Community                     Brief Description
 Urban air quality authorities          Monitor the air quality in cities or urban environments to track the performance of
                                        environmental policies and ensure the quality of life of citizens, interested in calculating
                                        the energy and anthropogenic energy fluxes as well as greenhouse gases (GHG)
                                        emissions fluxes.
 Geologists                             Study the solid, liquid, and gaseous matter that constitutes the Earth, interested in
                                        tracking and calculating gas fluxes from active faults, fractures and volcanic vents in
                                        relation to tectonic stresses.
 Geohazards, civil protection           Focused on the protection of citizens from natural disasters, and using the principles of
                                        emergency operations (prevention, mitigation, preparation, response, or emergency
                                        evacuation and recovery), this community is interested on the assessment of dangerous
                                        areas regarding the air quality and gases emissions.
 Meteorological services                Providing weather forecasts, warnings of hazardous weather, and other weather-
                                        related products to organisations and the public for the purposes of protection, safety,
                                        and general information, these are interested in calculating GHG emissions fluxes, to
                                        validate national inventories.
 Energy and power sector and            With the business of producing energy or resources through industry facilities, these
 industrial air pollutant emitters      communities need to calculate GHG emissions, specific pollutant fluxes as well as
                                        energy fluxes, to ensure compliance with regulations and benchmark their
                                        environmental and energy performance.
 Ecologists                             Study the interactions of organisms and their biophysical environments, by analysing
                                        their abundance, distribution and biodiversity, monitoring the ecological relationships
                                        and how they regulate the flux of energy, nutrients, and climate all the way up to the
                                        planetary scale. This community is interested in tracking and analysing the dynamic
                                        history of the planetary atmosphere's CO2 and O2 composition and how it has been
                                        affected by the biogenic flux of gases coming from respiration and photosynthesis, in
                                        relation to the ecology and evolution of plants and animals.
 Rural/urban planners                   Organising and monitoring socio-economic activities and initiatives to manage the
                                        spatial organisation of regions for efficient allocation of land use and improve standard
                                        of living, either in cities or rural areas. Depending on how these planning outcomes are
                                        applied, they can improve air quality in the long run, by strategic location of polluting
                                        sources and exposed population, and encouraging a structure that would minimise

10
www.neanias.eu
Requirements, Specifications & Software Development Plan for Atmospheric Services
pollution emissions, hence the interest in tracking the GHG emissions fluxes, as well as
energy fluxes.
Insurance, health With the purpose of ensuring their customers or patients safest conditions, where the
level of pollutants prescribed by regulations must not be exceeded during a given time
in a defined area, these communities need to access atmospheric data about the GHG
and pollutants emissions to validate incidents and cross-check with policies.
Table 1 – End-user communities for Atmospheric Services
2.1.1. Urban air quality authorities
Urban air quality authorities seek to better understand human activity's effect on air quality and the
environment. Since anthropogenic energy fluxes and GHG emission fluxes have a big impact on several
sectors like agriculture and health, it is essential to have the proper tools for monitoring greenhouse gas flux
density as well as for air quality estimation, monitoring, and forecasting. To achieve that, it is necessary to
automate and validate existing software modules for these two main ambitions.
The first one, monitoring greenhouse gas flux density is achievable using data obtained from specifically set
meteorological stations, integrated as a novel cutting-edge service into EOSC. For that, an orchestrator will
be built to select the optimal method or combination of methods, for processing, depending on the dataset,
that can be uploaded by the user.
The second one, air quality estimation, monitoring and forecasting, is achieved with the novel integration of
satellite, geospatial and in-situ data and a management platform implemented as a Software-as-a-Service
(SaaS) platform. With web responsive layouts and REST interfaces for integration with external systems, the
interfaces of the platform will be configurable, being able to give daily, weekly and monthly reports of all
the data collected by the sensing stations.
With the previous objectives completed, it becomes possible for urban authorities not only to improve their
analysis on the existent datasets and to achieve better results, but also to build and improve forecast and
monitoring services.
2.1.2. Geologists, Geohazards and civil protection stakeholders
The geologists’ community working on geohazards needs to better understand the relationships between
different phenomena that can affect the civil society. A great concern is represented by gases released in
volcanic areas (including radon, SO2, CO2) that have serious health negative effects, as well as by ashes
produced by volcanic eruptions. The latter also has an impact on health, along with important problems to
air traffic and other infrastructures.
Particularly, Radon emission depends on a series of other phenomena such as atmospheric pressure,
temperature variation, and changes of stresses acting on the fractures from which gas is outpoured. The
geological community has asked NEANIAS to release services capable of cross-correlating the time series
of data regarding gas emission, atmospheric conditions and earthquake occurrence, possibly to be also
applied to CO2 and SO2 series from multiscale database (e.g. spanning from satellite data to field-collected
ones). The latter process is composed of several variables that comprehend the surface distance between the
gas emission point and the earthquake epicentre location, the distance between the gas emission point and
the depth of the earthquake hypocentre, the tectonic stress characteristics (fault kinematics trajectories of the
principal stresses obtainable from the earthquake focal mechanism solution), and the Magnitude of the
seismic event, and the spatial resolution of data. It is thus necessary to develop a service capable of cross-
correlating all these parameters in order to distinguish which is the dominant process in dictating the
variations of gas radon emission, and possibly also to CO2 and SO2.
The emission of gases and ashes from the summit crater of an active volcano such as Etna or Stromboli, are
dependent upon the endogenous dynamic of the magma into the volcanic conduit, thus mainly related to the
11www.neanias.eu Requirements, Specifications & Software Development Plan for Atmospheric Services pressure dependent on the three-phases fluid system, and upon the stress state of the host rock surrounding the conduit, which is to say the volcanic edifice. Earthquake occurrence can change the local stress state favouring gas flux by stress unclamping. The geological community is asking to NEANIAS to release services capable of cross-correlating the time series of data regarding gas emission, earthquake occurrence, and stress changes. Again, earthquake occurrence means that the service must be capable of correlating the distance of the earthquake epicentre and hypocentre location from the crater, the tectonic stress characteristics (fault kinematics trajectories of the principal stresses obtainable from the earthquake focal mechanism solution), and the Magnitude of the seismic event. The software can be released in three phases addressing incrementally more complex datasets and scenarios towards analysing efficiently the variation in gas concentrations before during and after a seismic event. The software will be tested against the detection of changes in ash and gas concentration at regions with active volcanoes (e.g. Etna and Stromboli in Italy, Santorini in Greece), which constitutes a targeted application of significant importance for assessing geohazards and risks. The geological community also needs the implementation of a service capable of calculating and visualize the stress trajectories in plan and 3D view. A basic C implemented software called “Lissage” program from Lee and Angelier (1994) can calculate stress trajectory in 2D (maps) but has several limitations, it is not user- friendly, does not consider different data sources (e.g. field data, focal mechanisms, earthquakes) and, finally, it does not provide a 3D or an automatic 2D-layered output compatible with common GIS workspace (e.g. ArcMap, QGIS, Google Earth) and Matlab/Excel. The existing software comes from: [10] Lee, J. C., & Angelier, J. (1994). Paleostress trajectory maps based on the results of local determinations: the “Lissage” program. Computers & Geosciences, 20(2), 161-191. 2.1.3. Meteorological services It is usually asked from national meteorological services to obtain, calculate GHG emissions according to the guidelines given by the EC directive 2003/87/EC, as amended by the 2007/589/EC. Not only can it be a monotonous job, when performed manually, literature has proven that the obtained data are inaccurate. On the other hand, flux determination by measurements are also expensive and not practical for a whole country. There are two ways of bypassing this impasse: the first is to separate these fluxes in economic sectors and legislate the requirement to obtain these fluxes from them, and the second is to validate fluxes calculated from space satellites and improve their algorithms. These approaches will be followed to provide a service that provides weather services with GHG emissions calculations for proper monitoring and evaluation. 2.1.4. Energy and Power sector and industrial emitters Once the requirement to obtain GHGs fluxes from the sectors Energy, Power and other Industrial emitters has been legislated, their requirements to submit GHGs emissions will emerge. This requirement will not be based on inventories of material used and accompanying algorithms but on “point” and “area” source measurements, therefore the atmospheric services shall be able to receive as input or query parameters the location (a tuple of coordinates, a street name, a polygon or area or other geography type of data), besides the time intervals, so industry operators become able to benchmark their services and perform audits and confirm they comply with the regulation and policies. 2.1.5. Ecologists Our services described from 2.1.1 to 2.1.4 will help them to establish the validity of the above sector’s presentation of results, i.e. leveraging gases fluxes monitoring to evaluate the atmosphere composition and compare with the ecosystem’s evolution. 12
www.neanias.eu
    Requirements, Specifications & Software Development Plan for Atmospheric Services

  2.1.6. Rural/urban planners
Planners of urban or rural areas need a reliable service that provides them with sustainable indicators of the
environment such as Fine particulate (PM2.5) and particulate (PM10) concentration, as well as greenhouse
gas emissions measured in tonnes per capita, so as to correlate with the demographic information available.
Moreover, and especially considering the pandemic faced from late 2019 to 2020, due to COVID-19, it is
important to monitor the impact of these particulate and spread of respiratory pandemics, as some studies
alert to. Therefore, the Atmospheric services must be able to provide standard Key Performance Indicators
about these conditions for a certain area and period of time.

   2.1.7. Insurance and health
Similar to 2.1.6, the services will allow insurance or health communities to validate incidents and cross-
check with policies, therefore, the services shall support thresholds as query parameters to request all data of
a certain area that was under or above a given threshold.

    2.2. Relevant Atmospheric Datasets and Products
In this section, various atmospheric datasets and products are identified, which will be helpful to understand
what is available that can be useful within the project, be it data that can be used to test the project or products
that can be either used to provide some sort of service to the project, or serve as a guideline to define some
feature.

  2.2.1. Data and Products for Urban air quality authorities
The city of Porto makes air quality data openly available through their urban data platform’s portal1, where
the data is free and open, following FIWARE data models and open standards. It uses Monitar’s Air Quality
and Weather stations2, which follow the directive 2008/50/EC. The air quality stations monitor air quality
gaseous parameters with constant flow sampling and particulate filtration and can also integrate other
air quality sensors. The communication is done using the 3G/4G network or Wi-Fi networks, when
available.

                           Figure 1 – Monitar Air Quality Monitoring Station (left) and Weather station (right)

The following tables represent some of the solution’s main characteristics regarding the parameters that the
air quality stations and the weather stations can measure.

1
    http://history-data.urbanplatform.portodigital.pt/v2/ui/#/queries
2
    https://www.monitar.pt/
13
www.neanias.eu
Requirements, Specifications & Software Development Plan for Atmospheric Services
Parameter Range
O3 10 – 1000 ppb
NO2 0.05 - 0.5 ppm
CO 0 – 1000 ppm
CO2 0 – 5000 ppm
PM1 0 –100 µg/m³
PM2.5 0 – 100 µg/m³
Volatile organic compounds (VOCs) 1 – 1000 ppm
Table 2 – Monitar’s air quality parameters
Parameter Range Accuracy
Temperature -40 – 125 ºC ±0.3 ºC
Relative humidity 0 – 100 % ±2 %
Wind direction 0 – 360 º ± 3º±5%
Wind speed 0 – 89 m/s 0.5 m/s or ±5%
Rain fall 0 – 999.8 mm ± 0.2 mm or ±4 %
Solar radiation 0 – 1800 W/m² ± 5%
UV radiation 0 – 16 index ±5%
Table 3 – Monitar’s weather parameters
Regarding the products for Urban air quality authorities, the following software solutions are available:
2.2.1.1. Urban Platform
The Urban Platform3 consists of a multitenant software platform capable of collecting, storing, analysing and
publishing (as open data, when needed) multi-domain information, provisioned by different sources such as
sensor networks, Open Data catalogues as well as information systems and mobile applications.
Figure 2 – Urban Platform real-time map
The Urban Platform is a solution that provides in real-time a holistic view of a city or region, with an
interactive map displaying georeferenced information about the different verticals/use cases (traffic, parking,
public transports, air quality, energy, street lighting, waste management, water leakage, and flow level,
electric charging, energy, street lighting, waste management, water leakage and flow level, electric charging,
3
Urban Platform - https://urbanplatform.city
14www.neanias.eu
Requirements, Specifications & Software Development Plan for Atmospheric Services
and noise level), plus the capability of focusing on or zooming in specific pins and filtering the data per
vertical solution or region in an always-visible element, offering an easy way for users to search for the
relevant information. All information is represented in a rich way with multiple criteria such as colour,
dimension and icon types, providing an easy way to understand the overall status of the city at any given
moment.
Figure 3 – Urban Platform Air Quality analysis from an in-situ monitoring station
Despite all the domains that the Urban Platform can accommodate, the most relevant for this case is the
Weather and Air Quality. The two images (the one above and the other below) show two scenarios for
different locations where it is possible to see a detailed view of the air quality measured by a station and the
weather parameters measured.
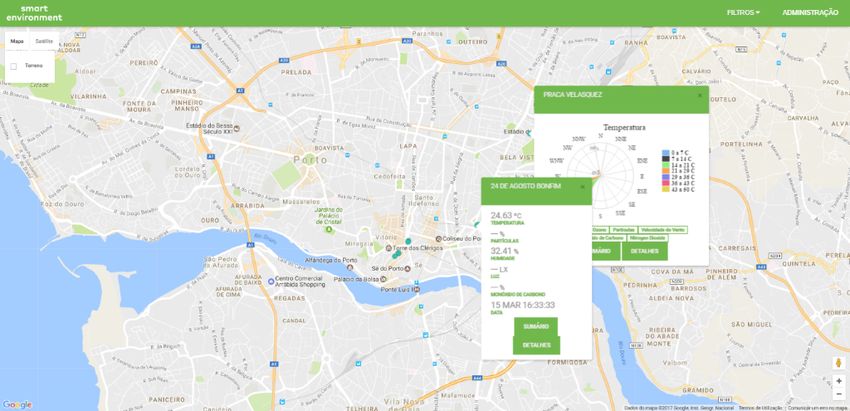
Figure 4 – Urban Platform Weather analysis from an in-situ monitoring station
Besides the visualisation of real-time and historical information, the Urban Platform also calculates some
insights, as it is possible to see in the following image, by correlating information such as traffic congestion
15www.neanias.eu
Requirements, Specifications & Software Development Plan for Atmospheric Services
with air quality index for a specific area or region, but also to have some insights based on historical data,
for example, the noise level observations per hour and per weekday.
Figure 5 – Urban Platform Air Quality analysis with customizable dashboard and charts
2.2.1.2. Smart Air Quality
Smart Air Quality is a cloud solution for smart cities that focuses on air quality monitoring, which allows
public authorities to have a detailed view of all the city air quality stations and allows to take some insights
into the overall air quality. It collects and stores the data provided by air quality stations (IoT devices) that
communicate in real-time through wireless networks. The solution then makes the data available through
open and interoperable REST APIs (so they can be shared with the community) and responsive user
interfaces that adapt to the device’s screen dimensions, to be used by expert staff from the smart city.
16www.neanias.eu
Requirements, Specifications & Software Development Plan for Atmospheric Services
Figure 6 – Smart Air Quality real-time map
Besides allowing the end-users to identify and access air quality measurements from individual stations, it
provides a system for asset and event management, to control and manage each station individually and the
data collected by it.
Figure 7 – Smart Air Quality individual analysis from an in-situ monitoring station
Besides this, it provides operational features where administrators can see the operational status of devices
and dispatch teams to fix the ones not working properly or technicians to integrate new ones.
17www.neanias.eu
Requirements, Specifications & Software Development Plan for Atmospheric Services
Figure 8 – Smart Air Quality asset management (stations and teams).
18www.neanias.eu
Requirements, Specifications & Software Development Plan for Atmospheric Services
2.2.1.3. Dataset for Urban air quality authorities
The following table describes the datasets that urban air quality authorities shall get access to with the
thematic service A3:
DATASETS – A3
id Name of Dataset Type Source
1 Porto Air Quality REST API for real-time and historical data on air quality Porto Urban Data Platform (Monitar)
monitored from 5 stations (O3, NO2, CO, CO2, PM10, PM2.5,
Volatile organic compounds)
2 Porto Weather REST API for real-time and historical data on weather monitored Porto Urban Data Platform (Monitar)
from 7 stations (Temperature, Relative humidity, Wind direction,
Wind speed, Rain fall, Solar radiation, UV radiation)
3 Porto Weather IPMA & OpenWeather
REST API for weather forecast for a given day
forecast
4 Porto Air Quality AQICN
REST API for air quality index calculation
Index
5 Satellite Air Quality REST API providing: Ozone (O3), Nitrogen Dioxide (NO2), MEEO – Sentinel-5P Data
Sulphur Dioxide (SO2, Carbon Monoxide (CO), Methane (CH4),
Formaldehyde (HCHO), UV Aerosol Index
Table 4 – Dataset for Urban air quality authorities
While Porto’s Air Quality and Weather data has already been described before, the two other datasets are
described in a later section. The dataset from MEEO was defined in a joint effort with WP4 and WP6.
2.2.2. Data and Products for Geologists
The following table describes the dataset required for geologists for thematic service A2:
DATASETS – A2
id Name of Dataset Type Source
1 Gas radon from Mt Excel table of values of gas radon emitted from the faults of Etna National Institute of Geophysics and
Etna faults volcano Volcanology, Italy
2 Gas and ash plumes Excel table of values of various gases and ashes emitted from National Institute of Geophysics and
from Etna crater the summit vents of Etna Volcanology, Italy
3 Gas from Nea Kameni Excel table of values of various gases emitted from the fractures Surveys by researchers of various
volcano, Greece on Nea kameni volcano, Santorini universities
4 Map of all Etna faults Database containing the georeferenced data of all faults on Mt National Institute of Geophysics and
Etna Volcanology, Italy
5 Seismicity of Mt Etna Database containing all foci and M of earthquakes that occurred National Institute of Geophysics and
at Etna in the last tens of years Volcanology, Italy
6 Meteorological data of Excel tables of meteorological data
each site
7 Thermal anomalies at CSV table MODIS/MODVOLC
selected volcanoes
8 SO2 columns from CSV table Global Volcanism Program
satellites at various
volcanoes
Table 5 – Dataset for Geologists
The above listed datasets represent information about the two main components of processes that are related
to the geological needs represented in the NEANIAS project: the atmospheric component and the solid Earth
component. Regarding the atmospheric component, the team has already collected relevant data series on the
19www.neanias.eu
Requirements, Specifications & Software Development Plan for Atmospheric Services
gas emission from various volcanoes, namely Mt Etna in Italy and Nea Kameni in Santorini, Greece. The
data series are more complete for Mt Etna having been collected in the last years each 20 minutes by installed
instruments that were continuously monitoring the gas radon flux. On Nea kameni the measurements of gases
(mainly CO2) have been done instead manually with a consequent more limited in time data collection. Other
atmospheric datasets comprehend the meteorological data, mainly pressure and temperature. Finally, we
collected data on thermal anomalies and SO2 columns from satellites at some selected volcanoes. Regarding
solid Earth, the gas data will be compared with other datasets represented by the distribution of faults on Mt
Etna and of fractures in the smaller Nea Kameni island, and with the datasets on the distribution of seismicity
in the same time frame. The aforementioned datasets will serve the need of the following potential users and
business cases (associate datasets and results with real world examples): Geohazard organizations and
consultancies, civil protection, geologists, civil aviation agencies.
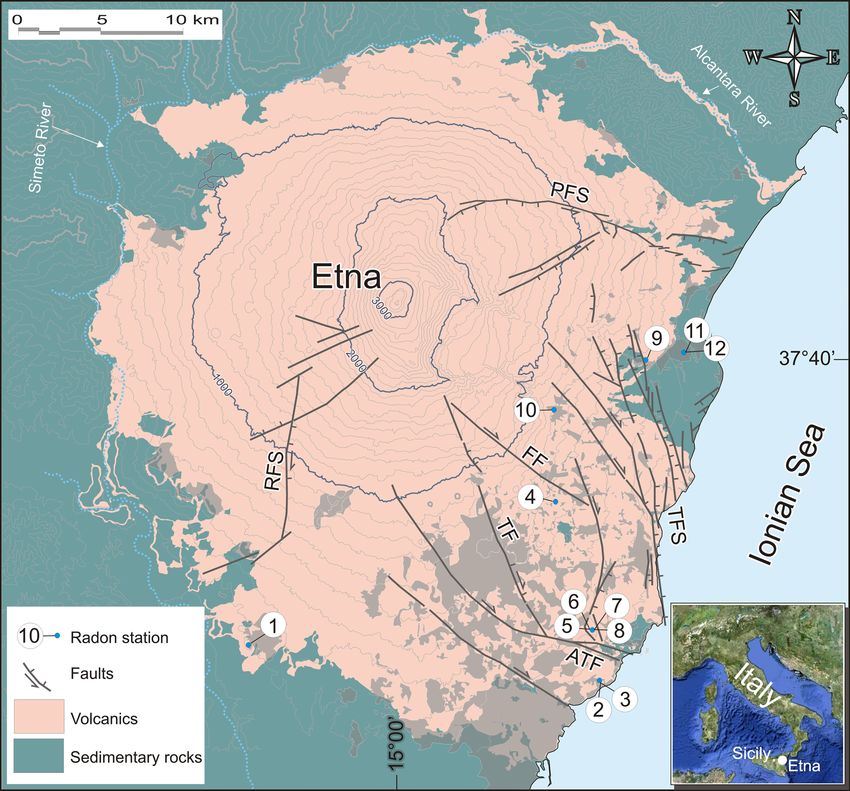
Figure 9 – Main active faults of Mt Etna and main historic seismic events.
20www.neanias.eu
Requirements, Specifications & Software Development Plan for Atmospheric Services
Figure 10 – Simplified geological map of Mt Etna with main active faults and the sites of indoor radon measurements. The urbanized areas
are shown in light gray. PFS, Pernicana fault system; RFS, Ragalna fault system; TFS, Timpe fault system; FF, Fiandaca fault; TF,
Trecastagni fault; ATF, Aci Trezza fault.
Figure 11 – 2016-2018 Radon measurements recorded at Mt Etna in the Giarre municipality. Radon concentration are presented as daily
(blue line), weekly (red), and long-term (green) averages. No data interruption occurred during the acquisition period.
2.2.3. Data and Products for Meteorological services
For developing and validating the Atmospheric Service (A1), we will employ the following datasets:
DATASETS – A1
id Name of Type Source
Dataset
1 ATHENS Eddy covariance ENTA
THERMOPOLIS
21www.neanias.eu
Requirements, Specifications & Software Development Plan for Atmospheric Services
2 ATHENS AIRCRAFT- three level VARIANCES METHOD ENTA
THERMOPOLIS
3 VOA-Gr Eddy covariance ENTA and at www.unitus.it
STATION
4 VOA-Gr Gradient method at 4 heights ENTA
STATION
5 ATHENS Gradient method at 5 different heights ENTA
THERMOPOLIS
6 Copernicus various ECMWF
DATABASE
Table 6 – Dataset for Meteorological Services
The data obtained in the “Athens Thermopolis” and financed by the ESA, will be made available so that
users can try our algorithms to obtain fluxes of GHGs, energy and momentum above a city. From our
publications one can also obtain an algorithm that indicates anthropogenic fluxes of energy, in an urban
environment. The use of tried algorithms for the calculation of GHGs, energy and momentum from aircraft
flights will also be supported as a service to users. Eddy Covariance and gradient method from met towers
algorithms will also be provided. The Copernicus database, refers also to fluxes but data are sporadic and of
unknown validity. Below are some filtered, processed and explained flux data from our Climate Watch
Station VOAGr in northern Greece. This station is part of and provides data to the European Fluxes Database
Cluster (http://www.europe-fluxdata.eu/) with data deposited at “database@unitus.it”.
2.2.3.1. Flux densities examples from VOAGr
Spectral flux density is the quantity that describes the rate at which energy is transferred by electromagnetic
radiation through a (real or virtual) surface, per surface area and per wavelength. The Climate Watch Station
VOAGr (installed in northern Greece) shown in the picture below provides flux densities data that will be
used in NEANIAS, which need to be processed through calculation methods.
Figure 12 – VOAGr MET Tower.
Below one can find in graphical form flux densities from our VOAGr MET TOWER using different flux
densities calculating methods. The most commonly used method is Eddy Covariance since it requires the
vertical velocity datum covarying with the concentration of a scalar. Hence flux densities calculations are
22www.neanias.eu
Requirements, Specifications & Software Development Plan for Atmospheric Services
relatively straightforward. However, these parameters have to scan a number of frequencies, a fact that
requires fast response sensors, not always available. The aerodynamic gradient method and its derivatives is
based on the fact that scalars vary with height according to the prevailing atmospheric stability.
Determination of horizontal wind velocities and “slow” determinations of scalars suffice to calculate fluxes,
based for example on the "Monin-Obukhov" similarity theory.
Figure 13 – VOAGr MET TOWER graphical form flux densities using different flux densities calculating methods.
23www.neanias.eu
Requirements, Specifications & Software Development Plan for Atmospheric Services
2.2.3.2. Open data sources
There are different services capable of providing useful information regarding meteorological information,
with some of them providing publicly available open data, listed below.
OpenWeather
4
OpenWeather is an online service that provides historical, current and forecast data. Depending on the
data/service that is intended to use, it can be free or paid. The complete list of the available parameters and
units that the service provides can be found at https://openweathermap.org/current, with the following table
giving a brief summary of the available data:
Name Available
Temperature (min/max) Yes
Humidity Yes
Pressure (sea / ground level) Yes
Wind (speed / direction) Yes
Clouds Yes
Precipitation Yes
Snow Yes
Visibility Yes
Sunrise / Sunset Yes
UV Index Yes
Table 7 – OpenWeather Dataset from its service
Regarding the API, the following table provides some insights about it:
Characteristic Details
Calls per minute 60
Search by city Name/ID/Coordinates Yes
Current weather Yes
Forecast 5 Days, 3-hour intervals
Calls per day (historical) 5000 (paid)
Historical weather 1 month back (paid)
Table 8 – OpenWeather API conditions
IPMA
IPMA5 is the Portuguese service holding the biggest national network of meteorological infra-structures
that provides current weather and forecast data6. The last one can be aggregated by the day (until 3 days) or
local (until 5 days). The following table gives a summary of the available data:
Name Available
Temperature (min/max) Yes
Humidity No
Pressure (sea / ground level) No
Wind (speed / direction) Yes (by classes)
Clouds Yes * (inferred by weather classes)
Precipitation Yes * (inferred by weather classes)
Snow Yes * (inferred by weather classes)
Visibility No
4
https://openweathermap.org/
5
http://www.ipma.pt/pt/index.html
6
https://api.ipma.pt/
24www.neanias.eu
Requirements, Specifications & Software Development Plan for Atmospheric Services
Sunrise / Sunset No
UV Index No
Table 9 – IPMA Dataset from its service
Regarding the API, the following table gives some insights about it:
Characteristic Details
Calls per minute Infinite
Search by city Name/ID/Coordinates No/Yes/No
Current weather Yes
Forecast No (current weather is a forecast)
Calls per day (historical) Yes, 5 days
Historical weather No
Table 10 – IPMA API conditions
DarkSky
7
DarkSky provides current and forecast (minutely, hourly and daily) weather and alerts. The complete list of
the available parameters and units that the service provides can be found at https://darksky.net/dev/docs. The
following table gives a summary of the available data:
Name Available
Temperature (min/max) Yes
Humidity Yes
Pressure (sea / ground level) Yes (only one, not distinguished)
Wind (speed / direction) Yes
Clouds Yes
Precipitation Yes
Precipitation probability Yes
Precipitation Intensity/accumulation Yes
Snow Yes
Visibility Yes
Sunrise / Sunset Yes
UV Index Yes
Temperature High/Low times Yes
Dew Point Yes
Apparent Temperature Yes
Table 11 – DarkSky Dataset from its service
Regarding the API, the following table gives some insights about it:
Characteristic Details
Calls per day 1000 (free)
Search by city Name/ID/Coordinates Yes
Current weather Yes
Forecast Yes (next 48h)
Historical weather Yes
Table 12 – DarkSky API conditions
7
https://darksky.net/
25www.neanias.eu
Requirements, Specifications & Software Development Plan for Atmospheric Services
At the time of writing this deliverable, the service has already been acquired by Apple8, which will certainly
impose restrictions to the usage of the service, therefore the consortium will continuously monitor the
service’s conditions to assess its practicality for EOSC and NEANIAS.
Agromonitoring
9
Agromonitoring is part of the OpenWeather company but focuses on data suitable for agricultural
applications, it provides current, forecast and historical weather base on satellite data for a specific area. The
complete list of the available parameters and units that the service provides can be found at
https://agromonitoring.com/api. It also provides NDVI (Normalised Difference Vegetation Index), EVI
(Enhanced Vegetation Index) and accumulated temperature and precipitation, soil temperature and moisture.
It has basically the same data and API limits as OpenWeather, it only adds the Satellite imagery for the
agricultural applications. The historical data requires a paid subscription.
AQICN
AQICN10 provides worldwide Air Quality Index for different locations and cities. This service only provides
the index for the air quality (AQI) and not the pollutants considered for its calculation. Regarding the API,
the following table gives some insights about it:
Characteristic Details
Quota 1000 per second
Search by city Name/ID/Coordinates Yes
Current AQI Yes
Historical AQI No
Table 13 – AQICN API conditions
2.2.3.3. Research Projects
In the following section, research projects that are relevant for NEANIAS regarding the Atmospheric services
are analysed.
Copernicus
European Union’s Earth Observation Programme, Copernicus11, offers information services based on
satellite Earth observation and non-space data. It delivers near-real-time data that can be used globally and
regionally, served by a set of satellites and in-situ systems such as ground stations. The services that
transform the gathered satellite and in-situ data into valuable datasets that ensure the monitoring of changes,
allow better forecasts. The main areas where Copernicus focuses are Marine, Climate change, Security,
Emergency, Land and Atmosphere12.
The Copernicus Atmosphere Monitoring Service (CAMS) provides continuous data and information on
atmospheric composition. It provides daily information on the global atmospheric composition, reactive
gases, ozone, and aerosols. It also provides near-real-time and forecast (4 days) of the European air quality13.
8
https://www.businessinsider.com/apple-buys-dark-sky-app-grow-services-iphone-2020-4?op=1
9
https://agromonitoring.com/
10
https://aqicn.org/
11
https://www.copernicus.eu/en
12
https://www.copernicus.eu/en/about-copernicus/copernicus-brief
13
https://www.copernicus.eu/en/services/atmosphere
26You can also read