DESIGN AND IMPLEMENTATION OF A DATA AGGREGATION SYSTEM FOR THE 5G NETWORK MANAGEMENT PLANE - TRABAJO FIN DE MÁSTER José Luis Mendoza Sánchez
←
→
Page content transcription
If your browser does not render page correctly, please read the page content below
Universidad Politécnica de Madrid
Escuela Técnica Superior de Ingenieros de Telecomunicación

 DESIGN AND IMPLEMENTATION OF A
DATA AGGREGATION SYSTEM FOR THE
 5G NETWORK MANAGEMENT PLANE

             TRABAJO FIN DE MÁSTER

              José Luis Mendoza Sánchez

                           2021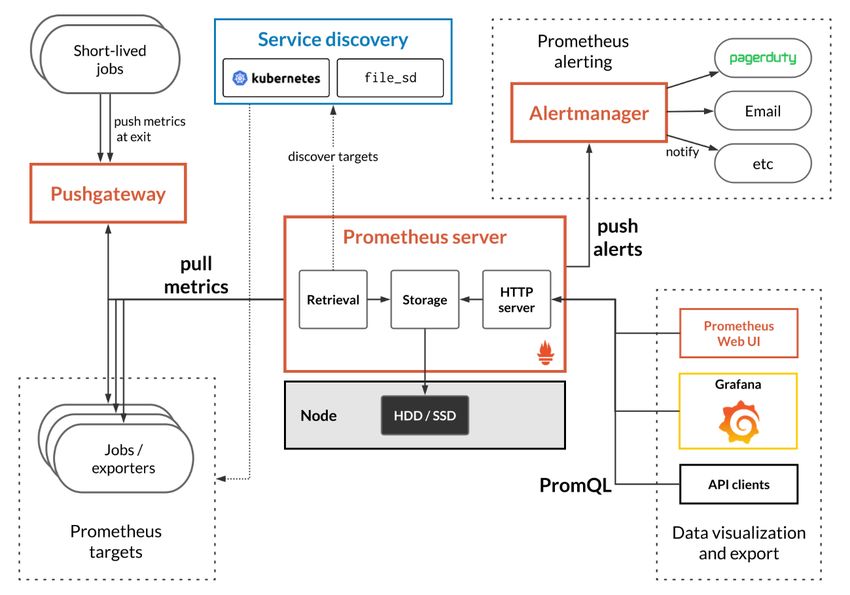
Universidad Politécnica de Madrid
Escuela Técnica Superior de Ingenieros de Telecomunicación

               Máster Universitario en
     Ingeniería de Redes y Servicios Telemáticos

             TRABAJO FIN DE MÁSTER

 DESIGN AND IMPLEMENTATION OF A
DATA AGGREGATION SYSTEM FOR THE
 5G NETWORK MANAGEMENT PLANE

                         Autor
              José Luis Mendoza Sánchez

                      Tutor
       Ignacio Domínguez Martínez-Casanueva

   Departamento de Ingeniería de Sistemas Telemáticos

                           2021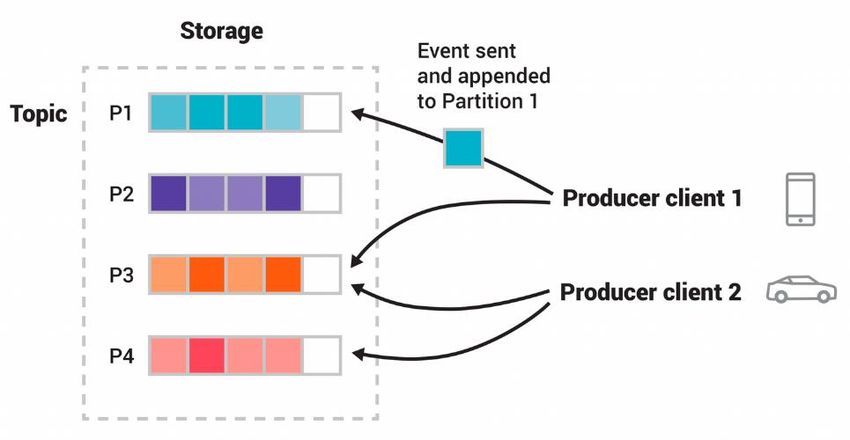
Resumen

   Las redes 5G han provocado un aumento de la complejidad del plano de gestión. Para
lograr una gestión inteligente y eficiente de las redes 5G, se necesitan nuevos
mecanismos de monitorización. El principal problema es el enorme número de fuentes
de datos que existen y su heterogeneidad, cada una con sus propios mecanismos y
formatos para representar la información. Utilizaremos el estándar ETSI de gestión de
información de contexto (ETSI ISG CIM), que permitirá una alta interoperabilidad con
otros sistemas de monitorización.

   En este Trabajo de Fin de Máster, proponemos una arquitectura genérica que permite
agregar y unificar todos estos datos para distribuirlos entre los suscriptores interesados
con diferentes propósitos (por ejemplo: análisis de datos, visualización…). Hemos
desarrollado dos prototipos que implementan dicha arquitectura: uno de ellos utiliza un
NGSI-LD Context Broker del estándar ETSI ISG CIM, y el otro utiliza Apache Kafka
como bróker de distribución, una plataforma de intermediación de mensajes. Hemos
realizado un experimento con los dos prototipos para compararlos y comprobar cuál se
adapta mejor a un escenario de monitorización de red. Los resultados han demostrado
que, mientras que los Context Brokers de NGSI-LD son viables en escenarios con poca
carga de datos, la solución de Kafka se ajusta mejor en escenarios con alta carga de datos,
como podría ser el caso de la monitorización de redes.

   Finalmente, hemos desarrollado otra implementación de la arquitectura propuesta
para ser utilizada en un escenario de uso real de la monitorización de la red 5G. Para el
desarrollo de todas las soluciones mencionadas, utilizaremos Apache NiFi, una
herramienta de ingeniería de datos.

Palabras clave: ETSI ISG Context Information Management, NGSI-LD, monitorización
de redes 5G, Orion-LD, Scorpio, Apache Nifi

                                              i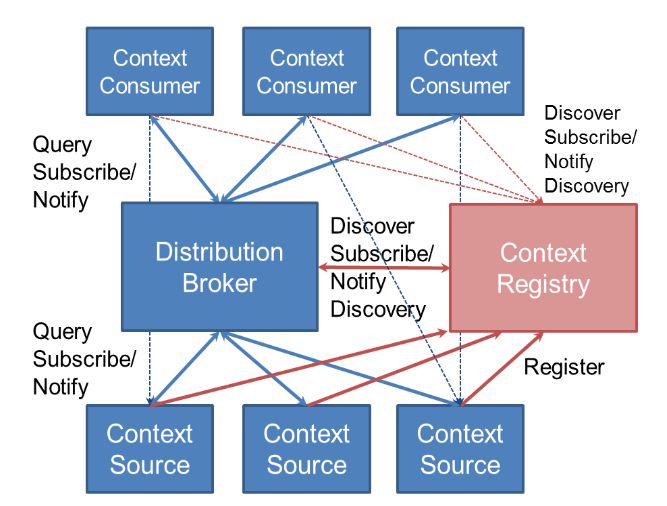
Abstract

  5G networks have led to an increase in the complexity of the management plane. In
order to achieve a smart and efficient management of 5G networks, new monitoring
mechanisms are required. The main problem is the huge number of data sources that
exist and their heterogeneity, with their own mechanisms and formats to represent the
information. We will leverage the ETSI ISG Context Information Management
framework (CIM) standard, which will enable high interoperability with other
monitoring systems.

  In this work, we propose a generic architecture which allows us to aggregate and
unify all this data to distribute it among interested subscribers with different purposes
(e.g., data analysis, visualization). We have developed two prototypes that implement
the forementioned architecture: one of them uses a NGSI-LD Context Broker from the
ETSI ISG CIM standard, and the other uses Apache Kafka, an event streaming platform,
as the distribution broker. We have conducted an experiment involving the two
prototypes to compare them and check which fits better in a network monitoring
scenario. The results have shown that, while the NGSI-LD Context Brokers are feasible
in scenarios with low loads of data, the Kafka solution fits better in scenarios with high
loads of data, as it could be the case of network monitoring.

  Finally, we will develop another implementation of the proposed architecture to be
used in a real use case scenario of the monitoring of the 5G network. For the developing
of all mentioned solutions, we will use Apache NiFi, a data engineering tool.

  Keywords: ETSI ISG Context Information Management, NGSI-LD, 5G network
monitoring, Orion-LD, Scorpio, Apache Nifi

                                             iii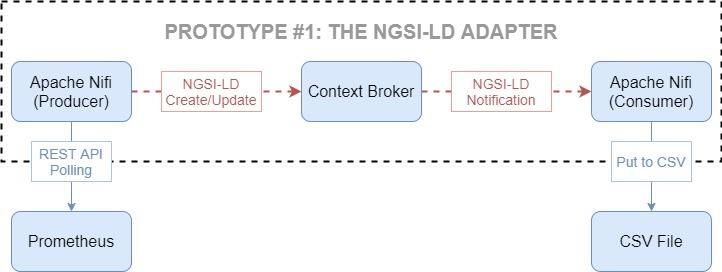
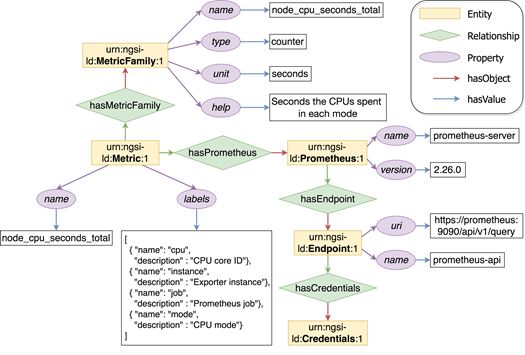
Table of Contents
Resumen .................................................................................................................................. i
Abstract.................................................................................................................................. iii
Table of Contents................................................................................................................... v
List of Figures ...................................................................................................................... vii
List of Acronyms .................................................................................................................. ix
1 Introduction .................................................................................................................... 1
1.1 Objectives of the project ........................................................................................ 3
1.2 Structure of this document .................................................................................... 3
2 State of the art ................................................................................................................. 5
2.1 Context Information Management ...................................................................... 5
2.2 Prometheus............................................................................................................ 10
2.3 Apache NiFi .......................................................................................................... 12
2.3.1 The ETL procedure....................................................................................... 13
2.3.2 Core components .......................................................................................... 15
2.3.3 Record-oriented data ................................................................................... 17
2.4 Apache Kafka ........................................................................................................ 18
2.4.1 Concepts ........................................................................................................ 19
2.4.2 Architecture ................................................................................................... 20
2.5 Apache Avro ......................................................................................................... 21
3 The monitoring data aggregation system ................................................................. 23
4 Experiments and results .............................................................................................. 27
4.1 The systems under test ........................................................................................ 27
4.1.1 The NGSI-LD adapter .................................................................................. 27
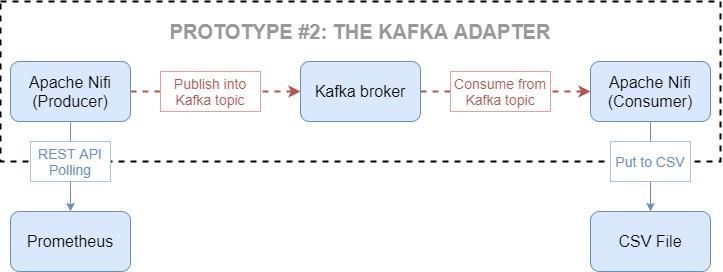
4.1.2 The Kafka adapter ........................................................................................ 32
4.2 Experiments........................................................................................................... 34
v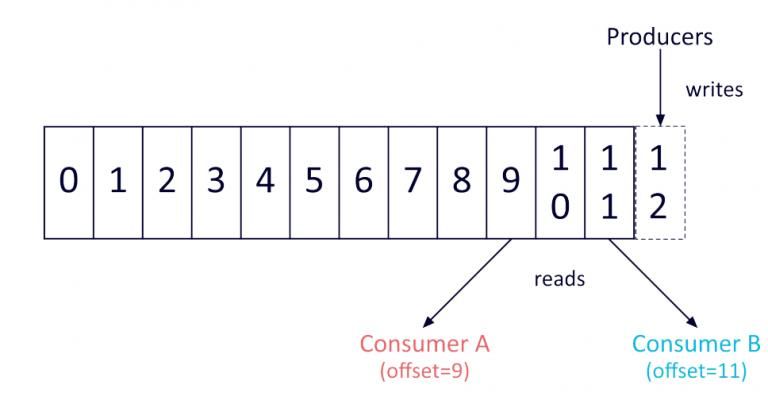
4.3       Results .................................................................................................................... 35

        4.4       Experiment conclusions....................................................................................... 38

    5      Real use case.................................................................................................................. 39

    6      Conclusions and future work ..................................................................................... 43

        6.1       Conclusions ........................................................................................................... 43

        6.2       Future work ........................................................................................................... 44

    Bibliography......................................................................................................................... 47

    APPENDIX A: ETHICAL, ECONOMIC, SOCIAL AND ENVIRONMENTAL
ASPECTS ................................................................................................................................... 51

        A.1 INTRODUCTION .................................................................................................... 51

        A.2 DESCRIPTION OF RELEVANT IMPACTS RELATED TO THE PROJECT .... 51

        A.3 DETAILED ANALYSIS OF SOME OF THE MAIN IMPACTS ......................... 52

        A.4 CONCLUSIONS ....................................................................................................... 53

    APPENDIX B: ECONOMIC BUDGET ............................................................................. 55

                                                                        vi
List of Figures
Figure 2-1. Central Broker architecture .............................................................................. 7
Figure 2-2. Distributed Broker architecture ....................................................................... 7
Figure 2-3. NGSI-LD Information Model layers ............................................................... 8
Figure 2-4. NGSI-LD Data Model example use case ........................................................ 9
Figure 2-5. Prometheus common architecture ................................................................ 11
Figure 2-6. GUI of Apache NiFi ........................................................................................ 13
Figure 2-7. Traditional scenario (ETL) vs modern world techniques (ELT) ............... 14
Figure 2-8. Architecture of Apache NiFi .......................................................................... 16
Figure 2-9. Clients publishing events to the same topic. ............................................... 20
Figure 2-10. Topic-partition closer look. .......................................................................... 20
Figure 2-11. Architecture of Apache Kafka ..................................................................... 21
Figure 3-1. Generic architecture for a monitoring data aggregation system .............. 23
Figure 3-2. Prometheus source NGSI-LD data model ................................................... 24
Figure 3-3. Example of node_cpu_seconds_total metric ............................................... 25
Figure 4-1. The NGSI-LD adapter ..................................................................................... 28
Figure 4-2. TimeSeries NGSI-LD data model. ................................................................. 29
Figure 4-3. Parsed example of node_cpu_seconds_total metric ................................... 29
Figure 4-4. Flow chart of the NGSI-LD Producer ........................................................... 30
Figure 4-5. Subscription content. ...................................................................................... 31
Figure 4-6. Notification content......................................................................................... 31
Figure 4-7. The Kafka adapter ........................................................................................... 32
Figure 4-8. Avro schema of the Kafka-Avro adapter. .................................................... 33
Figure 4-9. Experiment results for latency measurements ............................................ 35
Figure 4-10. Experiment results for CPU / RAM measurements: Context Brokers .. 36
Figure 4-11. Experiment results for CPU / RAM measurements: Kafka Broker ....... 37
viiFigure 5-1. Real use case monitoring data aggregation system flow chart. ................ 40
Figure 5-2. Example of Grafana dashboard: average idle seconds for CPU_0. .......... 41
viiiList of Acronyms
API - Application Programming Interface
ASN.1 - Abstract Syntax Notation One
AWS - Amazon Web Services
BI - Business Intelligence
BIDW - Business Intelligence and Data Warehousing
C3IM - Cross-cutting Context Information Management
ELT - Extraction, Load, and Transfer
ETL - Extraction, Transfer, and Load
ETSI - European Telecommunications Standards Institute
ETSI ISG - ETSI Industry Specification Group
ETSI ISG CIM - Cross-cutting Context Information Management
FBP - Flow-based Programming
GUI - Graphical User Interface
IoT - Internet of Things
JVM - Java Virtual Machine
NCM - NiFi Cluster Manager
NOC - Network Operations Center
OLAP - On-Line Analytical Processing
OLTP - On-Line Transaction Processing
OS - Operating System
RPC - Remote Procedure Call
ixSDN - Software Defined Network
UI - User Interface
VNF - Virtual Network Functions
x1 Introduction
Telecommunications networks have always presented a big challenge for their
operators, who must track and monitor them in order to detect anomalies, failures or
even cyberattacks. This challenge has been multiplied exponentially in the case of the 5G
network due to its particularities: the virtualization, the increasing need for automation
and the variety of domains that covers in comparison with older mobile technologies.
We are going to comment all these particularities.
• The 5G network has been developed considering the advantages of the cloud
computing technology in terms of scalability, reliability, elasticity, and
economics. The results of this mixture are materialized in the virtualization of the
network functions, originating the Virtual Network Functions (VNF) and most
of the nodes of the network, originating the Software Defined Networks (SDN).
These new elements no longer require highly specialized – and therefore
expensive – hardware, but generic purpose servers able to run software for the
virtualization of the network.
• The adoption of virtualized environments has led to a new necessity for the
deploying of services on demand. The manual configuration of these new
services is a professional, time-consuming and error-prone task. The network
management automation is focused on the creation of automated mechanism for
the deployment and tuning of these services.
• The 5G network has a broad range of monitoring data sources, all of them with
their own characteristics: data models, accessing mechanism…. This variety is
directly translated into a huge heterogeneity we have to overcome. To this end,
it is important to collect the metadata of a data source (its context) to capture its
characteristics at the same time we collect its monitoring data.
So, we have a challenge to solve: the monitoring of the 5G cloud-based network,
taking into account all its particularities and new challenges. When a new problem like
this one is presented, a typical approach is to look to other technological fields and find
similar ones. Following this advice, we are going to inspect three areas, namely: DevOps,
Data Engineering and IoT.
• The software running on top of the 5G network servers are often containers
orchestrated by some tool like Kubernetes, OpenStack, or Docker Swarm. The
1monitoring of these containers is a challenge deeply studied in the DevOps area.
DevOps engineers face a similar problem like the one we have when their web
application (one of the numerous work areas of DevOps nowadays), that consists
of a great number of containerized micro-services, fails, and they have to track
the state of its containers to locate the problem.
• For its part, in the Data Engineering field, we discover that the extraction,
transformation and loading of large amount of data is handled by Big Data
architectures, for which a handful of tools are used. Monitoring data can also be
handled by these architectures so that it is beneficiated with the advantages of
Big Data like scalability and elasticity.
• In the IoT field, we find that the ETSI institution has created a framework for the
sharing of important information between the IoT heterogenous devices, the
“Cross-cutting Context Information Management” (the ETSI ISG CIM). This
framework is used for the collection of the metadata, as well as the data itself,
from the data source. In the ETSI ISG CIM, the management of these two is done
at the same level. This is very helpful in the area of IoT, where the context (e.g.,
device, building entities) is mixed with the actual monitoring data (e.g., sensors).
In network infrastructures this mixture is not feasible due to the huge amount of
data compared to IoT and the complex structures of the monitoring data (they
are not just sensor measurements). In any case, the interoperability of the
framework is very interesting for our problem, and that is why we are going to
leverage the standard and prove its compatibility with the management of the
network.
This project has been done under the umbrella of the 5GROWTH project (reference
[1]). This European project is coordinated by Carlos J. Bernardos from Universidad
Carlos III de Madrid in partnership with other educational institutions and private
companies, and it tries to validate both technically and economically the 5G technology
from the verticals’ points of view. Its mission is to empower vertical industries, such as
Industry 4.0, Transportation, and Energy with 5G end-to-end solutions.
In this thesis, we are going to design a generic architecture for a network monitoring
system. This system will consist of a Data Source, from which we will be collecting
monitoring data (e.g., metrics, logs…), a data pipeline to process the data, a Broker (the
intermediary) and a Consumer which will receive the monitoring data. To this end, we
will be using state-of-the-art technologies brought from the DevOps, Data Engineering
and IoT fields. In fact, after proposing the reference architecture, we will compare two
2specific implementations for such architecture to decide which one adapts better to the
particularities of the 5G network. Finally, we will create a last system to be used in a real
use case scenario of 5G network monitoring.
In the following subsections we are going to provide more information about the
purpose of this project and the structure of this document.
1.1 Objectives of the project
As we have introduced earlier, the purposes of this thesis are:
• Objective 1: To detail the enabling technologies that we can use for the monitoring
of the 5G network.
• Objective 2: To design a generic architecture behind a monitoring data
aggregation solution for the monitoring of the 5G network.
• Objective 3: To propose and develop distinct implementations of this architecture
that use different enabling technologies, compare them, and select which one is
better in terms of efficiency and latency.
• Objective 4: To develop a real use case scenario that can help us in our purpose of
monitoring the 5G network.
1.2 Structure of this document
This memory has 6 chapters and 3 appendices, which are:
• Chapter 1 – Introduction: the chapter in which we are now. It details the motivation
of the project and its purpose, as well as introduces the rest of the document.
• Chapter 2 – State of the art: in this chapter we are going to describe the technologies
that we are going to mention in the rest of the document and use in the project
itself.
• Chapter 3 – The monitoring data aggregation system: in this chapter we will explain
the idea behind a data aggregation system to enable the monitoring of the 5G
network.
• Chapter 4 – Experiments and results: we will describe the conducted experiments,
the prototypes we have developed and the followed methodology. We will also
show the results and explain our conclusions.
3• Chapter 5 – Real use case: in this chapter we will depict a new system, extension of
a previous commented one, that could fit in a real use case scenario for the
monitoring of the 5G network.
• Chapter 6 – Conclusions and future work: we will review the fulfilment of the
objectives commented in Chapter 1 and give the thesis a final conclusion and will
introduce new lines for the future.
• Appendix A – Ethical, economic, social, and environmental aspects: we will analyze
the impact of this project.
• Appendix B – Economic budget: the total cost of the project.
42 State of the art
In this chapter we will discuss the enabling technologies that have made possible the
execution of this project. We will have a closer look to the IoT ecosystem and its Context
Information Management. We will also provide details about Prometheus, a broadly
used monitoring tool. Finally, we will inspect some of the most used Data Engineering
tools, such as Apache NiFi, Apache Kafka, and Apache Avro.
2.1 Context Information Management1
In the last decade, we have seen an explosion in the number of devices that surround
us, a handful of which have become a technology trend all by themselves. That is the
case of the IoT (“Internet of Things”), which use cases have varied from the digitizing of
industrial processes to creating smart services for citizens. But just because a thing is
connected to the Internet does not make it IoT, and an optimal management of these
devices have become a new necessity in these days.
In this line was born the Cross-cutting Context Information Management framework
(the ETSI ISG CIM framework, or just C3IM2), which tries to adopt a common way to
collect, process and distribute Context Information from different devices. That
management purpose we have commented is fulfilled by a C3IM platform, which
collects data from heterogeneous devices and provides as consolidated context
information to applications via an API. The information described and the diagrams
displayed in this section about C3IM and the associated protocol has been taken from
references [2], [3], [4], [5] and [6].
We can define the context of an application as all the relevant aspects of its operating
environment that are required for it to work properly. In the ETSI ISG CIM framework,
context information is any relevant information about entities, their properties
(temperature, location, or any other such parameter), and their relationships with other
entities. Entities may be representations of real-word objects but may also be more
abstract notions such as a legal entity, corporation, nation state, or groups of entities.
Therefore, an example of context information may be: the temperature of a thermometer
in a given office or the number of packets transmitted from a 5G node to another one per
hour.
1 If the reader is fluent in Spanish, there is a video in which I explain Context Information Management, NGSI-LD, and Linked
Data: https://youtu.be/VYbyT3eRKIk
2 As stated in reference [4], the abbreviation is C3IM and not CIM to avoid confusion with other acronyms such as the ISO/IEC
Common Information Model.
5Therefore, context information is exchanged among applications, Context Producers,
Context Sources, Context Consumers and Context Brokers following a publish-subscribe
pattern. We are going to state the differences between these components:
• Context Broker: in the C3IM framework, a broker is a mediator between context
consumers and producers. For that purpose, they externalize a HTTP API REST
named “ETSI NGSI-LD API” for Context Producers to send their data and
Context Consumers to subscribe to notifications. There are, at the time of
publication of this document, three different Context Broker implementations3
supporting the ETSI NGSI-LD API, namely Orion-LD Context Broker4, Scorpio
Broker5 and Stellio Context Broker6.
• Context Producer: system that delivers context information to Context Brokers.
Specific implementation of a Context Producer can be, for example, a sensors
gateway. The data that the original devices produce often need some processing
(e.g., a format change) before been sent to the Context Broker.
• Context Source: while a Context Producer must actively send its information to
a Context Broker, a Context Source is a more complex system which can be
consulted on the context information it collects. The consulting mechanism
implies that the Context Source register itself in a component called the NSGI-
LD Registry providing the types of Entities, Properties, and Relationships which
the Context Source can be queried about. For example, a database can be
registered as a Context Source that can provide the CPU usage of a set of servers
placed in a datacenter.
• Context Consumer: it is any application interested in some context information
collected (via Context Producers) or accessible (via Context Sources) by the
Context Broker. A Context Consumer usually creates a subscription on the
Context Broker so that it gets notified in case of an update on the context
information it is interested in.
The arrangement of these components leads us to the three main architectures that
can be observed in any C3IM Platform:
• Central Broker: in this architecture, a single Context Broker is placed as the
endpoint of all the subscriptions of the Context Consumers and the aggregator
3 Full catalogue can be found in: https://www.fiware.org/developers/catalogue/
4 Orion-LD Context Broker repository in GitHub: https://github.com/FIWARE/context.Orion-LD
5 Scorpio Broker repository in GitHub: https://github.com/ScorpioBroker/ScorpioBroker
6 Stellio Context Broker repository in GitHub: https://github.com/stellio-hub/stellio-context-broker
6(in terms of storage and collection) of all the context information generated by
the Context Producers. This architecture is commonly used due to its simplicity.
Figure 2-1. Central Broker architecture
• Distributed Broker: this is a more complex architecture that involves the
existence of one or more Context Sources which can be consulted, when
necessary, by the Context Consumers. To make this work, Context Sources must
register the information they can provide, along with geographical and temporal
constraints if needed, to the Context Registry. Context Consumers can also
directly discover Context Sources via the Context Registry.
Figure 2-2. Distributed Broker architecture
7• Federation Broker: this is a model for the aggregation of multiple NGSI-LD
systems. In this model, applications can query or subscribe within a wider
geographical scope. When the query or the subscription comes to a Federation
Broker, this forwards it to the domain Context Brokers identified as able to
provide useful information to that operation and aggregates the result. In fact,
the Context Consumers will not notice any difference between this architecture
and the other mentioned. Federation is broadly used to improve scalability.
Now we are going to focus on the Context Broker, which uses the NGSI-LD data
exchange protocol. The purpose of this protocol is to facilitate the interconnection of the
Context Information with several platforms like open databases, mobile Apps and IoT
platforms by adding semantic via the Linked Data technology. The protocol includes
two key components: the NGSI-LD HTTP RESTful API and the NGSI-LD data model.
Beginning with the latter, the NGSI-LD Information Model is based on Linked Data
standards. Therefore, the NGSI-LD API only accepts JSON-LD, a flavor of JSON used
for Linked Data which links the fields of the document with URI (Universal Resource
Identifier) where you can extract more information about the data presented in that field.
Linked Data allows different systems to use the same URI to reference the same concept,
enriching the Context Information and enhancing interoperability across multiple
domains (Smart Cities, Smart Agriculture, banking, healthcare …).
The NGSI-LD Information Model is layered to adapt it to the nature of real-world
entities and semantics. Thus, we can differentiate: the Core Meta-Model, the Cross
Domain Ontology and the Domain-Specific Ontologies:
Figure 2-3. NGSI-LD Information Model layers
8• The NGSI-LD Core Meta-Model is the foundation of all the Information Model.
It is represented by Entities, Relationships and Properties. It contains the core terms
needed to uniquely represent the key concepts of the NGSI-LD Information
model as well as the terms that define the API-related Data Types.
• The NGSI-LD Cross Domain models provide widely used structures such as time
and place of an entity. These apply broadly to several domains and the
normalization of their representation offers useful interoperability between
different domains.
• The Domain-Specific Ontologies can be created by extending the other two layers
with specialized terms taken from other ontologies.
The following figure is a graphic example for the NGSI-LD data modelling of a simple
use case. It represents the buying of a bottle of wine by a customer in a local store. The
example only uses the NGSI-LD Core Meta-Model (Entities, Relationships and Properties)
Figure 2-4. NGSI-LD Data Model example use case
9The other component of the NGSI-LD protocol is the NGSI-LD API. This API,
implemented in the Context Broker mainly, is presented as a RESTful HTTP API to be
used by the other elements of the platform. Specifically, the permitted operations are:
• Context Producers: create or update Context Information on the Context Broker
following the NGSI-LD Information Model.
• Context Sources: in this case, the registration is done against the Context Registry
as described above, following the same API.
• Context Consumers: query or subscribe to a specific Context Information on the
Context Broker.
2.2 Prometheus
Prometheus (docs in reference [7] and explanatory video in reference [8]) is a tool for
monitoring both traditional and highly dynamic container environments, like
Kubernetes or Docker Swarm. The more complex is becoming modern DevOps, the
more necessary it is to support the automated monitoring of the infrastructure behind to
prevent domino effect with the failure of any of the deployed services. For that purpose,
Prometheus helps us by providing insight of what is happening in our environment at
both hardware and container levels and triggering alerts to the system administrators
when measurements fall below or exceed provided thresholds.
In 5G scenarios, as mentioned in the introduction of this text, there is a lot of
virtualization under the hood. Prometheus fits perfectly in this situation to provide
automated monitoring and alerts about the usage of the containers or the load of the
network.
Clarifying the terminology, Prometheus monitors a particular target that can be, for
example: a Linux or Windows Server, a service, an application… Each target has one or
more monitoring information e.g., CPU status, memory or disk usage, number of
requests or the duration of the same. When Prometheus monitor and store this
information, it becomes a metric. Those metrics will be stored inside Prometheus in a
human-readable format along with at most three attributes: help, type, and unit. Help is
basically an optional description of what the metric is. The available types are counters
(to keep account of how many times an event has happened), gauges (that can go up and
down to store the value of a metric in each moment) and histograms (to track how long
or big an event has been). Unit is optional too, and it refers to the magnitude of the metric
(seconds, meters, grams…)
10Prometheus pulls metrics from the targets, in opposite to the pushing mechanisms
that other monitor systems have. This reduces the load of network traffic considerably
and avoid setting processes on the services to push their metrics to the server. It also
comes with other advantages, but it is important to comment that not all the services are
suitable to be scraped by this pulling mechanism. That is the case of the “short-lived”
jobs, services that are awaken for a short period and they need to push their metrics in
that time window. For those cases, there exists a component called Pushgateway which
we will comment later.
The core component of a Prometheus architecture is the Prometheus Server, which
does the actual monitoring work and consists of three parts:
• Data Retrieval Worker: a process that pulls metrics data from applications,
services, servers, or any other targeted sources.
• Time Series Database: responsible of the storage of the metrics data.
• HTTP API: accepts queries in PromQL language for the stored data.
Additional to the Prometheus Server, other components are set in the whole picture
to complete the functionality of the platform:
Figure 2-5. Prometheus common architecture
11• For the pulling of the metrics, targets must have an HTTP endpoint allocated by
default in “address/metrics” that exposes their monitoring information in a
format that Prometheus can understand. Many services expose their metrics in
“address/metrics” natively, but for those that do not, an extra component is
required. This component is called an exporter, namely a script that fetches
metrics from our target, converts it to the correct format and expose it via
“address/metrics” so that Prometheus can scrape this endpoint. Prometheus has
a list of official exporters ready to be used in frequent services that can be used
either on traditional services or as docker images. In case of monitoring a custom
application, a Prometheus client library is available on its webpage for multiple
program languages.
• As commented before, there exists an element called the Pushgateway used by
those processes that cannot hold a HTTP Server because of their short life period.
The Pushgateway is an endpoint to gather all the metrics pushed by those
processes and keep them until the Data Retrieval Worker scrape it.
• The Service discovery subsystem helps the Data Retrieval Worker to locate the
targets that it has been commanded to scrape in its configuration file
(prometheus.yml).
• For visualization purposes, we can choose between a built-in solution provided
by Prometheus (Prometheus Web UI), some off-the-shelf software with the
proper adapter (the most common one is Grafana) or any other client able to
request a HTTP API (like Postman or a custom solution).
• The Alertmanager is the last component to describe. It is responsible for firing
alerts via different channels (for example, emails). The Alertmanager is triggered
by the Prometheus server, which evaluates its alert rules defined in its
configuration file periodically.
2.3 Apache NiFi
Apache NiFi (docs in reference [9]) is an open-source tool to automate the flow of data
between systems that was born as a project of the National Security Agency and donated
afterwards to the Apache Software Foundation in 2014. Its software development and
commercial support is currently offered by Cloudera, a US-based company whose data
analytics platform comes with a copy of Apache NiFi (among others).
Written in Java, it is a member of the so-called ETL tools used in many industries like
IoT or Big Data. It has a Web-based UI and follows a “drag and drop” visual framework
12to create dataflows. Furthermore, from its version 1.2.0, Nifi is prepared for working
with record-oriented data.
Figure 2-6. GUI of Apache NiFi
In the following subsections, we go in depth with the key concepts around Apache
NiFi.
2.3.1 The ETL procedure
According to references [10] and [11], ETL (Extract, Transform and Load) is the process
by which data is extracted from data sources (that are not optimized for analytics) and
moved to a central host (which is), performing such actions as changing the data types
or applying calculations. The exact steps in that process might differ from one ETL tool
to the next, but the result is the same.
Traditionally, data used to be extracted from a very reduced group of sources and
loaded into the main analytics server of the organization in question. Those sources are
the OLTP databases (On-Line Transaction Processing), like sales, inventory, and
customer records. The data was then transformed with cleansing and optimizing to be
incorporated later into an OLAP database (On-Line Analytical Processing). All these
processes were done for a very specific BI (Business Intelligence) analysis. If the analysis
13had to change, it was very frequent that the previous techniques could not support that
new analysis, then all the processes needed to run again, this time with different
transformations.
Modern world technologies have changed the ETL process radically nowadays,
beginning with the sources. What used to be simple ad-hoc applications created
specifically for our company are now dozens or thousands of sources from both the
inside and the outside of our organization. The amount and variety of data sources have
raised explosively, and the traditional paradigm used for structured data is not
sufficient. Furthermore, business choices now must be taken in real time leaving typical
batch processing in a second plane because it is too slow. The same reason applies for
the analysis, which can vary from an hour to the other, and that is why modern ETL
infrastructures no longer transform their data before storing it, and there exists a quick
shift towards “ELT” (noticing the change in the order of the Transform and Load stages).
Figure 2-7. Traditional scenario (ETL) vs modern world techniques (ELT)
Luckily, today we count on powerful tools based on the Cloud where to load all the
information. These tools are called Data Lakes and Data Warehouses. A Data Warehouse
is a database optimized for analytics, e.g., Apache Druid or Snowflake. As such, it
imposes structure on the data. On the other hand, a Data Lake is a storage substrate
where data is dumped without any prior transformation. Examples are Amazon S3 or
HDFS.
14For the analysis of this massive amount of data we also have Cloud-based software,
the so-called Business Intelligence tools. This tool is where data is analyzed and
visualized, e.g., Superset or Tableau. Sometimes Data Warehouses and Business
Intelligence tools come altogether as a unique software, called the Analytics Warehouse,
the BIDW tool or the BI/DW tool.
Apache NiFi is a key component to populate Data Lakes and Data Warehouses from
a vast variety of sources.
2.3.2 Core components
NiFi’s fundamental design concepts closely relate to the main ideas of FBP (Flow
Based Programming). According to its Wikipedia article (reference [12]), FBP is a
programming paradigm in which applications are defined as interconnections of “black
box” processes that exchange data. The main concepts of NiFi are inspired in the FBP
paradigm, and they are:
• FlowFile: it represents an object moving throughout our network. FlowFiles are
composed of two parts: attributes and content. Attributes are a key-value
dictionary associated to the FlowFile and helps NiFi track it. The content is a zero
or more bytes string representing the data inside the FlowFile.
• Processor: they perform some operation like routing, transforming, fetching, or
storing the FlowFiles. The processors are visually a configurable box that can be
selected from a catalogue.
• Connection: they link processors. Internally, they model a queue so that different
processes can interact at different rates if needed.
• Flow Controller: it is the brain of the operation. It acts as the broker facilitating
the exchange of FlowFiles between processors.
• Process Group: a set of processes and their connections with input and output
ports if needed. This allows the creation of new components by composition of
others.
As NiFi is written in Java, it runs over a JVM hosted by the OS. It comes with the
presence of some components as follows:
• Web Server: allow us to control NiFi using its API.
15• Flow Controller: its purpose is to provide threads for extensions to run on and to
manage them.
• Extensions: NiFi provides several extension points to provide developers the
ability to add functionality to the application to meet their needs. They are
executed within the JVM.
• Processors: mentioned before, they are also executed within the JVM.
• FlowFile Repository: NiFi keeps track of all active FlowFiles, their attributes and
other Metadata about them in this repository.
• Content Repository: it is where the contents of the FlowFiles live.
• Provenance Repository: where all the data-related events are allocated. The
tracking of all these events from beginning to end is often called Data
Provenance.
• Controller Services (reference [13]): they are components running in the
background with the ability to support or control large groups of processors. For
example, “AWS Credentials Provider Service”, which extracts the credentials
from AWS so that it can be queried by the AWS related processors, instead of
manually set the key inside the configuration of all these processors.
The three repositories are pluggable, meaning that they can be located on a separate
drive if needed.
Figure 2-8. Architecture of Apache NiFi
16Apart from this architecture, NiFi also gives the possibility to operate as a cluster
maintained with Apache Zookeeper and a NiFi Cluster Manager (NCM) to increase
scalability and performance.
Finally, we are going to detail the type of processors there are and give more example
about them (more details in reference [14]):
• Data Ingestion processors: they fetch data from sources. E.g.: GetFile, GetHTTP,
ListenTCP, GetMongo…
• Routing and Mediation processors: responsible of routing the FlowFiles to
different processors depending on the information of their attributes or content.
E.g.: RouteOnAttribute, RouteOnContent…
• Database Access processors: they can perform statements against different
databases: E.g.: ExecuteSQL, PutSQL, ListDatabaseTables…
• Attribute Extraction processors: responsible to extract, analyze, change FlowFile
attributes E.g.: UpdateAttribute, ExtractText, EvaluateJSONPath…
• System Interaction processors: they can interact with the operating system below.
This type of processors sets the NiFi powerfulness virtually unlimited, as we can
execute any programming language with an OS call. E.g.:
ExecuteStreamCommand, ExecuteScrip, ExecuteProcess…
• Data Transformation processors: they receive an input FlowFile and generate
another one at their output. E.g.: UpdateAttribute, ExtractText,
JoltTransformJSON…
• Sending Data processors: they store a FlowFile into an external system. E.g.:
PutFile, PutEmail…
• Splitting Data processors: allow us to split or merge the content in a FlowFile.
E.g.: SplitText, SplitJson, MergeContent…
• Specific technologies processors: like for example, the family of the HTTP
processors (e.g.: InvokeHTTP, ListenHTTP…) or the AWS processors.
2.3.3 Record-oriented data
As we have seen, one of the best NiFi’s strength is that the framework is data agnostic,
treating data like a vector of bytes with associated attributes. That makes sense in a lot
of different scenarios, but it does not in many other ones. It is the case of the record-
17oriented data, in which all the data we treat comes with the same structure or schema.
That is why, since version 1.2.0 of NiFi (May 2017)7, a series of processors and controller
services were released to make this last scenario much simpler, as introduced in the
Apache NiFi’s blog article of reference [15].
Record-oriented data can implement its schema in different formats, and NiFi
supports a bunch of them, e.g.: Avro, CSV, Json, or XML. For each supported record-
oriented schema, NiFi has a Record Reader and a Record Writer controller service. In
order to make sense of the data, Record Readers and Writers need to know the schema
that is associated with the data. Some Readers (e.g.: the Avro Reader) allow the schema
to be read from the data itself.
Once that the correspondent controller service is up and running, we can use record-
oriented processors that makes some work easier than before. For example, with a CSV
Reader and Writer, we can merge many FlowFiles with the same CSV schema into a
single one or store them into a SQL database effortless.
2.4 Apache Kafka
During many years, we have been using databases to store records representing real-
world things. Although this was the main rule for a long time, an increasing in the
necessity of storing events - rather than things – has brought to the birth of some
solutions. One of these solutions is Apache Kafka (docs in reference [16] and
introduction video in reference [17]), which is an event streaming platform. The key to
understand Kafka is to visualize it as the manager of many queues (or logs, or software
buses), which are called topics in Kafka’s terms. Kafka’s topics are nothing but ordered
collection of events that are stored in a durable way, with real emphasis on the word
durable, because it means that events should be replicated in multiple devices so that it
is fault tolerant.
There are a huge number of reasons to answer why has Kafka become so popular,
here are some of them:
• The simplicity of the concept of topic makes Kafka really scalable, which has
become a must in this Big Data world.
• In a world quickly shifting into Service-Oriented Architectures, the increasing of
microservices has positioned Kafka as one of the best options when it comes to
the message exchange between all these components.
7 Release notes of version 1.2.0 in https://cwiki.apache.org/confluence/display/NIFI/Release+Notes#ReleaseNotes-Version1.2.0
18• There is an increasing need for organizations to implement real-time analytics,
and Kafka’s topics can deliver events in real-time in a reliable manner.
• The integration with legacy events databases is possible and very simple thanks
to Kafka Connect, a Java library API to get data in and out of these older systems
by adding so-called connectors, most of which are already implemented and
ready to be reused in a declarative way.
• It also has another tool called Kafka Streams, a Java library API that handles
common higher-level operations like grouping, aggregating, counting,
filtering… for us to focus on functions that cover any specific needs of our
business.
2.4.1 Concepts
Kafka’s most basic unit is the event, also called record or message. The anatomy of an
event is simple: it is composed by three or four strings: an event key, an event value, an
event timestamp, and optional metadata headers. Events are published by producers
and subscribed by consumers. They are fully decoupled and agnostic of each other,
which is a key design element to achieve high scalability.
Events are organized in topics, as we already know. Events in a topic are not deleted
after consumption, so they can be read as often as needed. Topics are partitioned,
meaning that two events of the same topic can be physically stored in two different Kafka
servers (which are called brokers, as explained later) and also replicated to add fault
tolerance and high availability. This allows clients to both read and write data from or
to many brokers at the same time. Nevertheless, events with the same key are always
written to the same topic’s partition. Kafka guarantees event ordering inside each
partition (they can be read in the same order they were written) with an algorithm
inspired by Lamport’s clocks, the Idempotent producer algorithm (more information in
reference [18]). That is because inside each topic’s partition there is an ordered sequence
of events numbered with a sequential identifier called offset. Each consumer is
responsible for controlling the offset of the event it has already read, leaving the
possibility of reading a specific offset event if needed. That characteristic is called cherry-
picking and is a common concept in queues and control version systems.
19Figure 2-9. Clients publishing events to the same topic.
Blocks with the same color denote events with the same keys. Figure from reference [19]
Figure 2-10. Topic-partition closer look.
Consumers can read different events and perform cherry-picking. Figure from reference [19]
Kafka has a command line tool for the creation, inspection and managing of topics
and other administration tasks. Apart from it, we count on three Java APIs (similar to
the Kafka Streams API and Kafka Connect API commented before): the Admin API, the
Producer API and the Consumer API to integrate programs with Kafka. The whole five
Java APIs are also interoperable with Scala.
2.4.2 Architecture
Kafka Broker is the name given to the server that run each instance of Kafka in a Kafka
cluster. They use Apache ZooKeeper under the hood, a software for the management
and coordination of the cluster. Each broker can be responsible for partitions of one or
20more topics. For each partition of a topic that is replicated (called replica), a broker must
fit in one out of two roles: Leader or Follower. Leaders deal with client requests about
their topic partition, while Followers only replicate passively the topic partition of the
leader to stay up to date with it. If a Leader fails, a voting process will elect a new Leader
from the list of Followers that were in-sync with the former one.
Apart from Brokers, Kafka also has Producers and Consumers, roles we have already
commented. Consumers with a common task can be included in a Consumer Group to
improve parallelism, so that each partition is read by only a single consumer within the
group. The whole picture is presented in this figure extracted from reference [19]:
Figure 2-11. Architecture of Apache Kafka
2.5 Apache Avro
Apache Avro (docs in reference [20]) is a data serialization system developed within
the Apache’s Hadoop project. It is used to define the data schema in record-oriented
data. The procedure is: Avro uses a certain schema to serialize records in a compact binary
format, and it uses a compatible schema to de-serialize it. By having the schema present
in both writing and reading of each datum, the process becomes faster and the
serialization lighter. Schemas are defined with JSON, and they can be stored within the
serialized object, making it slightly heavier, but allowing any program to read it. Apache
21Avro has APIs written in many programming languages like C, Go, Java, Python or
Scala.
Avro is widely used in RPCs (Remote Procedure Call), where the client and the server
exchange schemas in the connection handshake.
As per today, there has been multiple systems that provides similar functionality (for
example: Apache Thrift, Google Protocol Buffers or the ASN.1 standard with its Basic
Encoding Rules). Apache Avro differs from those systems in these aspects:
• Dynamic typing: for reading and writing, all that Avro needs is a schema,
nothing about code.
• Untagged data: data can be written in a more compact manner as schema is
present when it is read.
• No manually-assigned fields IDs: when a schema changes, both the old and new
schema are always present when processing data, so differences may be resolved
symbolically, using field names.
223 The monitoring data aggregation system
In the introduction we mentioned that we were going to create a system for the
monitoring of the 5G networks adapted to all its particularities. In this chapter, we are
going to define the components of a monitoring data aggregation system in general.
This figure represents the components of the generic schema:
Figure 3-1. Generic architecture for a monitoring data aggregation system
Now, we are going to describe them:
• Data Source: the Data Source is where the monitoring data originally comes from.
We are going to use is Prometheus. This means that we have to deploy a
Prometheus instance with the proper exporter. This will provide an endpoint
(address/metrics as we commented in Chapter 2) from which to poll metrics via
REST API request. This endpoint will be consulted for metrics periodically.
As commented in the introduction of this document, not only it is important to
collect monitoring data, but also the associated metadata that we already know
can be called the context of the data source. To characterize the complex data
source that is Prometheus, we have created a NGSI-LD data model that
summarizes all the data and metadata that can be collected from it.
23Figure 3-2. Prometheus source NGSI-LD data model
In the data model we can observe the following entities:
o Prometheus: this entity represents the instance of Prometheus. For that
reason, it has two properties: the chosen name for the server and the
specific version. Distinguishing a Prometheus entity from another can be
very important in some scenarios to verify the available capabilities of
that specific instance.
o Metric: the metric entity is the representation for an actual metric from
Prometheus. It is described by a name property and has a set of labels
which identify a specific time series of the metric. For example, the
frequency of each CPU processor is described with the same metric name,
but with different set of labels.
o MetricFamily: this entity provides information about the type of the
metric (counters, gauges and histograms), as well as optional information
like the unit of measurement of the metric and a brief description.
o Endpoint: the endpoint entity of the data model describes the connection
point by which we have reached Prometheus. It has a name and a URI.
24o Credentials: describes the authentication method used for the collection
of the metric (e.g., user-password, certificate).
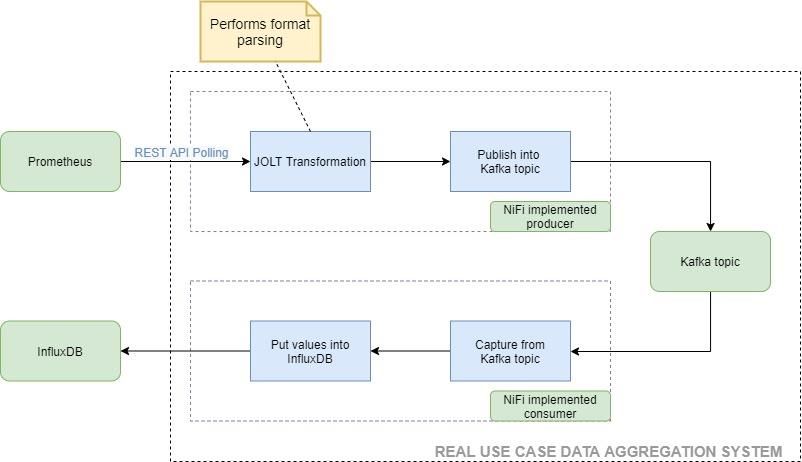
• Producer: the Producer will scrape Prometheus, transform the incoming data,
and send it to the Broker. For the transformation part, we must consider that the
metrics collected from Prometheus will be formatted in JSON following the
Prometheus data model generated when the query in PromQL is executed. In our
case, both producers will be implemented in Apache NiFi.
Here is an example of a metric retrieved from the Prometheus API. The metric
we can see here is the node_cpu_seconds_total, which tell us how many seconds
each CPU spent doing each type of work. For more information about this
specific metric, please consult the reference [21].
Figure 3-3. Example of node_cpu_seconds_total metric
As we can see, the JSON in the response comes with a very specific format. For
example, in the field value we have a vector whose first element represents the
timestamp of the metric and the second one is the actual value of the metric.
• Broker: the Broker is an intermediary component that will distribute the data
pushed by the Producer among all the interested Consumers.
25• Consumers: they will subscribe to the distribution service that offers the Broker
for the metrics they are interested in. After receiving the notification and
processing it, they will be able to dump the monitoring data into the Data Sink.
• Data Sink: it is the place where the monitoring data is stored (e.g., file texts or
databases) until its value is harvested8. For the harvesting of the value we could
use, for example, the displaying of a dashboard with the evolution of the
Timeseries and trigger alerts when a certain metric surpasses a pre-defined
threshold. A new component, not represented in the diagram, would be
responsible for doing this kind of tasks.
In the following chapter, we are going to compare two monitoring data aggregation
system prototypes. First, we will depict their specifications, then, we will describe the
methodology we are going to use and lastly, we will comment the derived results from
the experiments.
8The harvesting of the value of the data is a concept drawn from the Data Value Pyramid we can see in the book Agile Data
Science from reference [22]
26You can also read