EU Exit Long-term economic analysis November 2018 - Cm 9741 - Il Foglio
←
→
Page content transcription
If your browser does not render page correctly, please read the page content below
EU Exit
Long-term economic analysis
            November 2018

                      Cm 9741

EU Exit
          Long-term economic analysis
                      November 2018

                          Presented to Parliament
                             by the Prime Minister
                      by Command of Her Majesty

                                  November 2018

Cm 9741
© Crown copyright 2018
                                                Any enquiries regarding this publication
This publication is licensed under the terms    should be sent to us at
of the Open Government Licence v3.0 except      publiccorrespondence@cabinetoffice.gov.uk.
where otherwise stated. To view this licence,
visit nationalarchives.gov.uk/doc/open-         ISBN 978-1-5286-0900-5
government-licence/version/3
                                                CCS1118067288               11/18
Where we have identified any third party
copyright information you will need to obtain   Printed on paper containing 75% recycled
permission from the copyright holders           fibre content minimum.
concerned.
                                                Printed in the UK by the APS Group on
This publication is available at                behalf of the Controller of Her Majesty’s
www.gov.uk/government/publications              Stationery Office
EU Exit: Long-term economic analysis 1

Contents
Executive Summary                                                                                          3
Section 1 - Introduction                                                                                 11
1.1 Context                                                                                              11
1.2 Structure of the publication                                                                         12
Section 2 - Analytical approach                                                                          14
2.1 Trade analysis overview                                                                              14
2.2 Scenarios                                                                                            15
    2.2.1 Explanation of scenarios                                                                       16
2.3 Assessing changes and associated costs of new economic relationships                                 18
    2.3.1 UK-EU tariff and non-tariff barriers methodology                                               18
    2.3.2 UK-EU trade: assumptions                                                                       20
    2.3.3 UK-Rest of World trade: methodology                                                            22
    2.3.4 UK-Rest of World trade: assumptions                                                            22
    2.3.5 Regulatory flexibility                                                                         23
    2.3.6 Summary of assumptions                                                                         24
2.4 Macroeconomic tools                                                                                  26
    2.4.1 Regional modelling                                                                             26
    2.4.2 Migration                                                                                      27
    2.4.3 Fiscal modelling                                                                               28
    2.4.4 Additional sensitivity analysis                                                                28
2.5 Analytical limitations                                                                               29
2.6 Key factors relevant to future economic performance not quantified in this analysis                  30
    2.6.1 Factors not modelled                                                                           30
    2.6.2 Wider domestic economic policy not modelled                                                    30
    2.6.3 Global trends not modelled                                                                     31
Section 3 - Sectoral implications for UK-EU trade barriers                                               33
3.1 Potential changes in trade barriers with the EU and associated costs                                 33
3.2 UK Sectors                                                                                           35
    3.2.1 Manufactured Goods                                                                             35
    3.2.2 Agri-food                                                                                      38
    3.2.3 Services                                                                                       40
    3.2.4 Financial Services                                                                             43
    3.2.5 Networks                                                                                       45
2 EU Exit: Long-term economic analysis

Section 4 - Macroeconomic results                                                            49
4.1 Interpreting the results                                                                 50
4.2 Trade volume impact of trade policy only                                                 51
4.3 Impact of trade policy on economic output                                                54
4.4 Sectoral impacts of trade policy only                                                    57
4.5 Regional impacts of trade policy                                                         62
4.6 Migration impacts                                                                        65
4.7 Overall economic impacts combining trade, migration and regulation effects               66
     4.7.1 GDP and GDP per capita                                                            66
     4.7.2 Decomposition of the changes in economic output                                   70
4.8 Fiscal impacts                                                                           71
4.9 Additional sensitivities                                                                 76
Section 5 - Wider external economic analysis                                                 79
5.1 External analysis and evidence on potential changes to the costs of trade                79
5.2 External analysis on long term economic outcomes of changes to trade and market access   80
Glossary of Terms                                                                            83
EU Exit: Long-term economic analysis 3

Executive Summary
As the UK leaves the European Union it does so with strong economic fundamentals. The economy
is growing, unemployment is low and real wages are rising. The Government's future economic
relationship with the EU and independent global trade policy will be important drivers of future trade
flows both with the EU and the rest of the world. This will in turn influence productivity and economic
output. Economic analysis can support an understanding of how these changes might affect the UK
economy. But it does not seek to predict how the UK economy will perform in the future, not least
because the UK’s exit from the EU will be just one of a number of factors impacting economic growth.
The Government has undertaken economic analysis of EU exit under different scenarios, with the
objective of providing Parliament and the public with an assessment of the long-term economic
impacts of the UK's future relationship with the EU. The analysis compares potential future policy
scenarios against today's arrangements, holding all other factors constant. The analysis considers
the potential impacts from changes to specific trade-related policies, including analysis of EU trade
costs and opportunities from an independent UK trade policy.
The Government's analysis brings together evidence from across Government, insight from external
stakeholders and a range of data and analytical tools. It considers both the costs and benefits of
moving to new trading relationships with the EU and the rest of the world. An integral part of this
analysis is an assessment of how trade barriers could affect costs for businesses in the long run
across different sectors of the economy, both as a result of different trading relationships with the EU
and signing ambitious new Free Trade Agreements (FTA) with non-EU countries. The analysis uses
macroeconomic tools to assess the potential overall impact on the UK economy of these changes in
the long run.
This analysis is not an economic forecast for the UK economy. In particular:
•   It only considers the potential economic impacts that are specific to EU exit. Leaving the EU is just
    one of many factors that will influence the UK's economic performance in the long run. Other
    factors such as the rise of global value chains, the increasing importance of services trade,
    technological developments, and global demographics are held constant;
•   The analysis does not make judgements about any future UK Government policy decisions or
    responses; and
•   The estimates show the relative impacts of different trading arrangements in the long term and do
    not estimate the absolute increase or decrease in economic output compared to today. The
    results therefore show the broad relative impacts of the different scenarios, and in all scenarios
    the economy would be expected to grow.
No modelling can completely capture the complex ways in which the UK economy could be affected
by exiting the EU, particularly given the unprecedented circumstances of the UK's departure. While
the analysis draws on a robust set of tools and evidence, there is an inherent uncertainty
around this type of economic analysis. The results are therefore presented as ranges, and
should be interpreted with caution.
4 EU Exit: Long-term economic analysis

Modelled scenarios
In line with external studies and analysis previously undertaken by the Government, the work
considers four analytical scenarios: 1
•   The policy position set out by the Government in the July 2018 White Paper on “The future
    relationship between the United Kingdom and the European Union” (“modelled White Paper”);
•   A hypothetical FTA, with zero tariffs, reflecting average FTA non-tariff costs such as being outside
    the Customs Union and standard customs arrangements with the EU, regulatory barriers and
    other costs (“modelled average FTA”);
•   An EEA-type scenario, which reflects being outside of the Customs Union and as such primarily
    reflects the costs of standard customs arrangements with the EU. Zero tariffs are applied
    (“modelled EEA-type”); 2 and
•   A no deal scenario based on an assessment of average non-tariff barriers (NTBs) between
    countries trading on non-preferential World Trade Organization (WTO) terms and applying EU
    applied Most Favoured Nation (MFN) tariffs (“modelled no deal”).
The average FTA, EEA-type and no deal scenarios do not deliver the Government's policy objectives.
These scenarios are therefore included as reference points. The EEA-type scenario would mean
staying in the Single Market, implementing new EU legislation automatically and in its entirety, and
continued free movement of people. An average FTA, EEA-type scenario or trading with the EU on
WTO terms would not meet the Government's commitments to ensure no hard border between
Northern Ireland and Ireland.
The UK and the EU have agreed the Political Declaration which sets the framework for the UK's
future relationship with the EU. It sets out a free trade area for goods, including no tariffs, with
ambitious customs arrangements. It will be the first such agreement between an advanced economy
and the EU. It will also allow the UK to develop an independent trade policy beyond the partnership,
with the ability to sign new trade deals with other countries.
Agreement of the Political Declaration will now be followed by negotiations on the legal text. The UK
and the EU recognise that this means there could be a spectrum of different outcomes, and both
have agreed that we should be as ambitious as possible. The UK has put forward proposals that
would enable frictionless trade to be achieved outside the Customs Union and Single Market. That is
not something that is accepted by everyone in the EU, but the UK has the ability in the future
negotiations to continue to work for its objective of achieving frictionless trade.
Given the spectrum of outcomes, and ahead of the detailed negotiations on the legal text, an
appropriate analytical approach to modelling the impacts of the Political Declaration is to present a
range of possible outcomes. To do this, the analysis applies a sensitivity to illustrate the potential
impact of higher NTBs, including checks at or behind the border and other regulatory costs. This
illustrative sensitivity point reflects the midpoint in the difference of NTBs to trade between the
modelled White Paper at one end, and the modelled average FTA scenario at the other, and does not
represent an expected outcome.

1   The four scenarios, and the policy assumptions underpinning them, were approved by ministers.
2   The analysis isolates the impact of changing trading relationships, relative to a baseline of the UK’s current trading
    arrangements with the EU. From the perspective of this modelling approach, the baseline of the UK’s current trading
    arrangements is equivalent to membership of both the EEA and the Customs Union.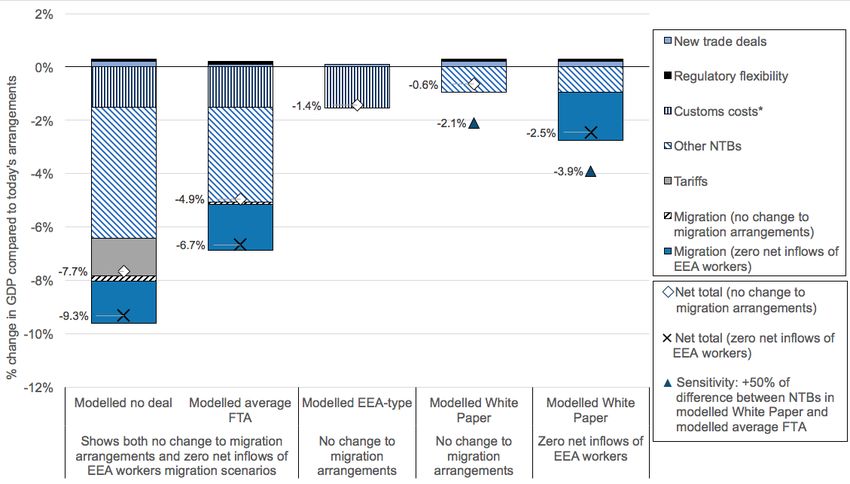
EU Exit: Long-term economic analysis 5

In each scenario, changes to UK-EU trade costs are considered. The analysis also considers
ambitious new trade deals with the rest of the world by assessing the potential impact of eliminating
tariffs and reducing non-tariff barriers with an illustrative range of potential partners.
The four scenarios, and the additional sensitivity, are then considered in two ways. The modelled
White Paper and average FTA scenarios are compared against the no deal scenario. All of the
scenarios are also compared against today's arrangements, as committed to Parliament on 19
November 2018, 3 but this is not a specific projection of future membership of the EU. This analysis
does not consider any potential impact of the UK aligning with the EU as it changes its rules in the
future. The future direction of EU policy is uncertain, and could have both positive and negative
impacts on the UK economy.
This analysis looks only at the long-term economic impacts, and for this purpose the long term can be
interpreted as around 15 years after the UK's new relationship with the EU comes into effect. It is
focused only on the specific changes triggered by EU exit and as such is not an overall economic
forecast. The analysis does not consider short-term operational or wider economic effects, including
where there is potential for short-term effects to sustain in the long run.
Economic impacts
It is expected that in all scenarios considered in this publication, the economy will continue to grow in
the long run. The estimates show the relative impacts of different trading arrangements.
The analysis shows that higher barriers to UK-EU trade would be expected to result in greater
economic costs.
The analysis compares the long-term economic impact of each of the modelled scenarios against
today's arrangements, first considering trade effects only (migration effects are considered separately
and described below). It also compares the central estimates of the modelled White Paper and
modelled average FTA scenarios to the modelled no deal scenario over the long run, by again
considering trade effects only.
Table E.1: Summary of trade only impacts on GDP compared to the modelled no deal scenario. 4           5

    Compared to modelled no                        Modelled White Paper                             Modelled
    deal (percentage point                                                                        average FTA
    difference)                          Modelled                     Modelled
                                        White Paper            White Paper with 50 per
                                                                cent NTB sensitivity5
    GDP                                     +6.9                          +5.4                         +2.7

No migration or regulation effects. Central estimates only. 6
Comparisons to modelled no deal are calculated as the difference between the scenario and modelled no deal,
expressed in percentage points of today’s arrangements.

3   HC Deb (19 November 2018), vol. 649, col. 661 “The baseline for this comparison will be the status quo - that is,
    today's institutional arrangements with the EU”.
4   Differences may not reconcile with other tables due to rounding.
5   Sensitivity analysis highlights the impact on GDP if NTBs are higher than estimated in the modelled White Paper
    scenario. The sensitivity reflects 50 per cent of the difference in NTBs between the modelled White Paper scenario
    and modelled average FTA scenario. Implicitly, the modelled White Paper scenario represents zero per cent on this
    range, and the modelled average FTA scenario represents 100 per cent. This midpoint is illustrative only and does not
    represent an expected outcome.
6   Ranges are not modelled for the differences between scenarios, or for the NTB sensitivity.
6 EU Exit: Long-term economic analysis

Table E.2: Summary of trade only impacts on GDP compared to today's arrangements.                  7

    Compared to today's      Modelled         Modelled          Modelled                  Modelled White Paper
    arrangements             no deal         average FTA        EEA-type
                                                                                   Modelled                  Modelled
    (per cent change)
                                                                                  White Paper          White Paper with 50 per
                                                                                                        cent NTB sensitivity7
    GDP                          -7.6             -4.9             -1.4                -0.7                     -2.2
                            (-9.0 to -6.3)   (-6.4 to -3.4)   (-2.3 to -0.9)      (-1.4 to -0.2)
No migration or regulation effects. Central estimates and ranges in brackets. 8

The analysis then considers the impact of these scenarios on different sectors of the economy, on
the nations of Scotland, Wales and Northern Ireland, and on the English regions. The analysis
shows that the modelled White Paper scenario, and the sensitivity modelled as the difference
between NTBs in the modelled White Paper and the modelled average FTA scenarios, would
support higher economic output for all sectors, nations and regions than the no deal
scenario.
Free movement of people will end as the UK leaves the EU. Future migration arrangements will be
determined in the UK's national interest, and will be set out in a White Paper, in line with the
Government's overall policy to reduce net migration to sustainable levels. Changes to migration will
have an impact on the economy. Migration is affected by both government policy and the relative
strength of the economy and demographic factors. Ahead of final decisions on the UK's long-term
migration arrangements, an illustrative range of potential changes to net EEA worker flows is
analysed alongside changes to the economy from trade. 9 The analysis estimates that the illustrative
scenario of zero net inflows of EEA workers could reduce GDP by around 1.8 per cent and GDP per
capita by around 0.6 per cent in the long run, compared to today's arrangements. The analysis does
not assume any changes to non-EEA migration. In the no change to migration arrangements
scenario, any migration effects reflect only the impacts on migration of a smaller economy.
The analysis then combines the estimated impact of changes in trade policy, modelled illustrative
migration arrangements, and the impact from potential regulatory flexibility in the long run from
leaving the EU to describe an overall impact on the economy. The analysis also considers potential
fiscal implications of these scenarios.

7   Sensitivity analysis highlights the impact on GDP if NTBs are higher than estimated in the modelled White Paper
    scenario. The sensitivity reflects 50 per cent of the difference in NTBs between the modelled White Paper scenario
    and modelled average FTA scenario. Implicitly, the modelled White Paper scenario represents zero per cent on this
    range, and the modelled average FTA scenario represents 100 per cent. This midpoint is illustrative only and does not
    represent an expected outcome.
8   The central estimates are not necessarily the midpoint of the range. All ranges have been generated by a Monte Carlo
    statistical process, which draws several thousand input values from their full distributions.
9   The Government's migration analysis first establishes future flows of EEA workers independent of any policy changes.
EU Exit: Long-term economic analysis 7
Table E.3: Summary of total GDP impacts (considering trade, migration, regulatory flexibility effects) compared
to the modelled no deal scenario. 10
Modelled White Paper
Compared to the modelled
Modelled Modelled Modelled
no deal (percentage point
White Paper White Paper with 50 per average FTA
difference)
cent NTB sensitivity10
GDP* +6.9 +5.4 +2.7
Central estimates only.
Comparisons to modelled no deal are calculated as the difference between the scenario and modelled no deal,
expressed in percentage points of today’s arrangements.
The numbers are the same as in Table E.1 because the addition of migration and regulatory flexibility effects difference
out. These effects are added into both modelled no deal and the scenarios presented in the table.
* These results are for differences in GDP for zero net inflows of EEA workers. Results for GDP per capita, and for no
change to migration arrangements are set out in section 4. They are not included in this table as they are broadly
similar to the figures shown.
Table E.4: Summary of total GDP impacts (considering trade, migration, regulatory flexibility effects) compared
to today's arrangements, for the illustrative no change to migration arrangements and zero net inflows of EEA
workers scenarios. 11 12
Compared to today's Modelled Modelled Modelled
Modelled White Paper
arrangements no deal average FTA EEA-type
(per cent change) Modelled Modelled White
White Paper Paper with 50 per
cent NTB sensitivity11
No change to GDP -7.7 -4.9 -1.4 -0.6
-2.1
migration (-9.0 to -6.3) (-6.4 to -3.4) (-2.4 to -0.9) (-1.3 to -0.1)
arrangements
GDP per -7.6 -4.9 -1.4 -0.6
-2.1
capita (-8.9 to -6.2) (-6.4 to -3.4) (-2.3 to -0.9) (-1.3 to -0.1)
Zero net GDP -9.3 -6.7 -2.5
N/A12 -3.9
inflows of EEA (-10.7 to -8.0) (-8.1 to -5.1) (-3.1 to -1.9)
workers
GDP per -8.1 -5.4 -1.2
N/A -2.7
capita (-9.5 to -6.8) (-6.9 to -3.9) (-1.9 to -0.7)
Central estimates and ranges in brackets. 13
10 Sensitivity analysis highlights the impact on GDP if NTBs are higher than estimated in the modelled White Paper
scenario. The sensitivity reflects 50 per cent of the difference in NTBs between the modelled White Paper scenario
and modelled average FTA scenario. Implicitly, the modelled White Paper scenario represents zero per cent on this
range, and the modelled average FTA scenario represents 100 per cent. This midpoint is illustrative only and does not
represent an expected outcome.
11 Sensitivity analysis highlights the impact on GDP if NTBs are higher than estimated in the modelled White Paper
scenario. The sensitivity reflects 50 per cent of the difference in NTBs between the modelled White Paper scenario
and modelled average FTA scenario. Implicitly, the modelled White Paper scenario represents zero per cent on this
range, and the modelled average FTA scenario represents 100 per cent. This midpoint is illustrative only and does not
represent an expected outcome.
12 Modelled EEA-type scenario is not shown because the illustrative zero net inflows of EEA workers migration scenario
does not apply to the modelled EEA-type scenario.
13 The central estimates are not necessarily the midpoint of the range. All ranges have been generated by a Monte Carlo
statistical process, which draws several thousand input values from their full distributions.8 EU Exit: Long-term economic analysis
These total impacts on GDP and GDP per capita are also shown in Figure E.1 and E.2 below. Figure
E.3 demonstrates the different factors that drive the total GDP impacts, including new rest of world
trade deals, additional regulatory flexibility, NTBs (at or behind the border) including customs costs,
tariffs and changes in migration. Figures E.1, E.2 and E.3 include the impact of the modelled
sensitivity from the White Paper scenario to illustrate that, if at-the-border or behind-the-border
frictions and costs were higher, the impact on the economy would be greater.
Figure E.1: Summary of total impacts on GDP compared to today's arrangements for the illustrative no change to
migration arrangements and zero net inflows of EEA workers scenarios.
Central estimates and ranges. 14
Under the illustrative zero net inflows of EEA workers scenario, migration impacts do not apply to a modelled EEA-type
scenario. As such, they are not shown on the right hand side of the chart above.
This considers trade, migration and regulatory flexibility effects.
14 The central estimates are not necessarily the midpoint of the range. All ranges have been generated by a Monte Carlo
statistical process, which draws several thousand input values from their full distributions.EU Exit: Long-term economic analysis 9
Figure E.2: Summary of total impacts on GDP per capita compared to today's arrangements for the illustrative no
change to migration arrangements and zero net inflows of EEA workers scenarios.
Central estimates and ranges. 15
Under the illustrative zero net inflows of EEA workers scenario, migration impacts do not apply to a modelled EEA-type
scenario. As such, they are not shown on the right hand side of the chart above.
This considers trade, migration and regulatory flexibility effects.
15 The central estimates are not necessarily the midpoint of the range. All ranges have been generated by a Monte Carlo
statistical process, which draws several thousand input values from their full distributions.10 EU Exit: Long-term economic analysis Figure E.3: Decomposition of total impacts on GDP compared to today's arrangements for the illustrative no change to migration arrangements and zero net inflows of EEA workers scenarios. Central estimates only. *NTB estimates for the modelled no deal and modelled average FTA scenarios are derived from econometric modelling, which does not isolate individual NTB components. Customs costs for these scenarios are shown illustratively in line with the modelled EEA-type scenario estimates. This considers trade, migration and regulatory flexibility effects. There are a number of external assessments comparable to the modelled no deal, average FTA and EEA-type scenarios. The Government's estimates sit within the range of external estimates, noting that key differences between studies relate primarily to assumptions on changes to trade costs and how economic models simulate the economy's adjustment to these. Few studies have sought to model the stated government policy.
EU Exit: Long-term economic analysis 11

Section 1 - Introduction
1.1 Context
1.     The UK's exit from the EU represents a change in its relationships both with the EU and the rest
       of the world. The UK will be leaving the Customs Union and Single Market, which determine
       how goods, capital, services and people move between the UK and the EU. The UK will also be
       implementing an independent global trade policy which allows the UK to sign new Free Trade
       Agreements (FTAs) with non-EU countries.
2.     The Government has undertaken long-term economic analysis of EU exit, with the objective of
       providing Parliament and the public with an assessment of the possible long-term economic
       impacts of the UK's future relationship with the EU.
3.     The analysis compares potential future policy scenarios against today's arrangements, holding
       all other factors constant.
4.     The UK and the EU have now agreed the Political Declaration which sets the framework for the
       UK's future relationship with the EU. This will now be followed by negotiations on the legal text.
       The UK and the EU recognise that this means there could be a spectrum of different outcomes,
       and both have agreed that we should be as ambitious as possible. The UK has put forward
       proposals that would enable frictionless trade to be achieved outside the Customs Union and
       Single Market. This is not something that is accepted by everyone in the EU, but the UK has the
       ability in the future negotiations to continue to work for its objective of achieving frictionless
       trade. Given the spectrum of outcomes and ahead of the detailed negotiations on the legal text,
       an appropriate analytical approach is to present a range of possible impacts of the Political
       Declaration.
5.     The analysis considers the potential long-term impacts from changes to specific trade policies,
       including analysis of EU trade costs and opportunities from an independent UK trade policy.
       The long-term can be interpreted as around 15 years after the UK's new relationship with the
       EU comes into effect.
6.     Free movement of people will end as the UK leaves the EU. Future migration arrangements will
       be determined in the UK's national interest, and will be set out in a White Paper, in line with the
       Government's overall policy to reduce net migration to sustainable levels. For the purposes of
       this analysis, decisions on trade and migration are assumed to be largely separate. However,
       ending free movement of people between the UK and the EU has economic consequences that
       are important to consider in analysing the impact of EU exit. Two illustrative variants for long-
       term migration arrangements have been used to estimate the wide range of possible impacts,
       reflecting the range of policy options. These are represented as no change to migration
       arrangements and zero net inflows of EEA workers. These scenarios illustrate a very wide
       range of impacts and are not intended to indicate any future migration arrangements. The
       analysis does not assume any changes to non-EEA migration. Potential migration impacts are
       then combined with trade impacts and an illustrative impact of regulatory flexibility to show the
       overall impact on the UK economy.
7.     Changes affecting UK trade and migration will influence the size and shape of the UK economy.
       The UK is a large, developed economy, ranked the fifth largest in the world in 2017, 16 with

16   'Gross domestic product 2017', GDP ranking, World Bank, September 2018.
12 EU Exit: Long-term economic analysis
around 80 per cent of economic activity coming from services activities. 17 The UK is an open
economy and is highly integrated into global supply chains. Trade has become increasingly
important, rising from 36 per cent of GDP in 1967, to 62 per cent in 2017. 18 There were 3.5
million EU (excluding Irish) nationals living, working and studying in the UK in 2017. 19
8. EU exit is just one factor that could influence the UK economy in the long run. Wider global
trade and investment trends, such as growth in emerging markets, as well as new technologies,
will also have an impact. These factors have not been modelled as part of this analysis, and are
discussed in more detail in Section 2.6.
9. Theory and evidence 20 indicate that higher trade 21 increases economic output and prosperity
over the long term through multiple channels. For example, trade allows countries to specialise
more in their areas of comparative advantage and allows businesses to sell their goods and
services to a larger market. To serve a larger market, firms scale up their workforce and
production, increasing overall demand in the economy. Trade can increase productivity, a key
driver of economic growth, by exposing firms to competition, best practice, new technologies
and through investment. This can contribute to higher wages, employment and households'
living standards.
1.2 Structure of the publication
10. The analytical approach and assumptions underpinning the analysis are explained in Section 2.
This sets out the methodology the Government has taken, summarising the overall analytical
framework, the scenarios modelled, key assumptions and the variety of tools and evidence that
have been used. It also provides further explanation and context around domestic policy, wider
global trends and opportunities outside of EU exit that have not been explicitly modelled.
11. Section 3 details the potential changes in trade arrangements with the EU for different sectors
of the UK economy under the modelled scenarios. The section includes assessments of
possible changes to trade costs for five sector groups: manufactured goods, agri-food 22,
services, financial services and networks. These sectors have been defined for this publication
in order to present the sectoral assessments and the analytical results in a consistent,
accessible way. This section presents estimates of tariff and non-tariff barriers (NTBs) for each
sector group.
17 'GDP output approach - low-level aggregates', ONS, September 2018.
18 'UK national accounts, The Blue Book 2018', Aggregate of imports and exports, ONS, July 2018.
19 'Population of the UK by country of birth and nationality', Tables 2.1 and 2.3, ONS, May 2018.
20 Frankel, J and D. Romer, 'Does trade cause growth?' The American Economic Review, June 1999.
21 Specifically higher levels of trade intensity - increases in exports and outputs relative to the size of the economy.
22 Agri-food includes agriculture, forestry and fisheries as well as beverages, tobacco and food.EU Exit: Long-term economic analysis 13
12. The sectoral assessments set out an analysis of potential changes that different industries may
face. These estimates can also be brought together as an input into the Government's long run
trade and macroeconomic modelling. Section 4 sets out the results of this analysis for the
modelled trade scenarios. This estimates how economic output may change in the long run in
response to the estimated changes in trade costs, through trade flows, sectoral economic
activity, and real wages. The analysis also considers potential regional impacts. The potential
effects of illustrative migration scenarios are set out separately from the trade effects. These are
then combined with the trade analysis and the illustrative impacts of greater flexibility over UK
regulations, to estimate the total impacts of EU exit. Finally, this section sets out the potential
fiscal implications of these scenarios. This section also presents additional sensitivity analysis
and provides guidance on interpreting the results.
13. Section 5 presents the Government's assumptions, methodology and results in the context of a
range of external studies. This demonstrates that the Government's analysis of the modelled
precedent scenarios falls within the range of other comparable studies. Few studies have
sought to model the stated government policy.14 EU Exit: Long-term economic analysis
Section 2 - Analytical approach
The analysis makes use of the latest evidence, insight and analytical tools. The analysis
considers four trade scenarios: the modelled White Paper scenario, a modelled no deal
scenario (trading on EU Most Favoured Nation (MFN) terms), a modelled average FTA
scenario and a modelled EEA-type scenario. Given the spectrum of outcomes, and ahead of
the detailed negotiations on the legal text, the appropriate analytical approach to modelling
the impact of the Political Declaration is to present a range of possible outcomes. To do this,
the analysis applies a sensitivity to illustrate the potential impact of higher non-tariff barriers
(NTBs), including checks at or behind the border and other regulatory costs. Opportunities for
ambitious new trade deals with new partners in the rest of the world are also assessed. The
Government then uses a macroeconomic model to assess the potential long-term impact on
trade flows and the UK economy. Potential impacts of migration arrangements and flexibility
over UK regulations are also considered in addition to trade impacts. Other sensitivity
analysis illustrates the potential impact of changes to both policy and analytical assumptions.
In practice a number of wider external drivers of economic performance not related to EU exit
will affect UK economic performance in the long run, including policy choices of the UK
Government and devolved administrations. This analysis does not seek to assess these
factors and, as such, should not be interpreted as an economic forecast. Similarly, the
analysis does not seek to model short-term impacts. The Government's macroeconomic
model is a standard tool for modelling trade arrangements, but results must be interpreted
with caution given the inherent uncertainties around trade cost estimates and how the
economy may adjust to these.
2.1 Trade analysis overview
14. Trade analysis is used worldwide by national governments, international institutions and
academics to inform trade policy and negotiations. Economic modelling provides a rigorous,
consistent and quantitative means by which to assess options, complementing wider qualitative
and quantitative analysis of trade policy choices.
15. Trade analysis can be used to assess prospective trade deals or provide a backward-looking
assessment of the impact of previous trade policies.
16. The most common approach to evaluating trade deals uses real world trade data to estimate
differences and changes in average trade barriers between different trading partners. This takes
into account a range of other factors which affect trade. 23 For example, countries sharing a
common border, language or history tend to trade more with one another. Countries with large
economies and populations also tend to trade more with all partners.
17. There are two broad approaches to forward looking trade analysis: sectoral, focusing on a
particular segment or sector of the economy; or macroeconomic, taking a broader look at the
whole economy, recognising linkages and interdependencies between sectors. 24
18. For this analysis, the Government has brought together both of these approaches and a variety
of evidence. Trade costs are estimated within each of five sector groups for each modelled
23 'The Gravity Equation in International Trade: An Explanation', NBER Working Paper, August 2013.
24 'Demystifying Modelling Methods for Trade Policy', WTO Discussion Paper, 2005.EU Exit: Long-term economic analysis 15
scenario. These trade costs and assumptions then feed into a macroeconomic model to
estimate the potential whole economy impacts in the long run, holding other factors constant. As
is common to trade modelling, this analysis does not consider wider external drivers of
economic performance and, as such, should not be interpreted as an economic forecast.
19. Migration effects are assessed separately. The Government's migration analysis first
establishes the potential future flows of EEA workers independent of any policy changes. The
analysis shows two illustrative variants for long-term migration arrangements. 25 This is
represented as a range between no change to migration arrangements and zero net inflows of
EEA workers. These scenarios illustrate a very wide range of impacts and are not intended to
indicate any future migration arrangements. The analysis does not assume any changes to non-
EEA migration. The migration effects are combined with the impact of the change in trade policy
and the economic impact of some flexibility over UK regulations to estimate the overall
economic impact on the whole economy.
20. The following sections describe the main scenarios included, as well as the overarching
methodology, assumptions and analytical tools used. Further details on the Government's
analytical approach can be found in the accompanying EU Exit Long-Term Analysis: Technical
Reference Paper.
Figure 2.1: Simplified illustration of the Government's analytical approach.
2.2 Scenarios
21. The UK and the EU have now agreed the Political Declaration which sets the framework for the
UK's future relationship with the EU. This will be followed by negotiations on the legal text that
will set out in detail the UK's future trading arrangements. The UK and the EU recognise that
this means there could be a spectrum of different outcomes, and both have agreed that we
should be as ambitious as possible. Given the spectrum of outcomes and ahead of the detailed
negotiations on the legal text, the analytical approach presents a range of possible outcomes of
the Political Declaration.
25 Long-term migration is defined as workers intending to stay more than one year in duration.16 EU Exit: Long-term economic analysis
22. The Government's policy was set out in the July 2018 White Paper, “The future relationship
between the United Kingdom and the European Union”. 26
23. In line with external studies and analysis previously undertaken by the Government, the work
considers four analytical scenarios:
a. The policy position set out in the July 2018 White Paper, “The future relationship between
the United Kingdom and the European Union” (“modelled White Paper”);
b. A hypothetical FTA, with zero tariffs, reflecting average NTB costs such as standard
customs arrangements with the EU, regulatory and other costs (“modelled average FTA”);
c. An EEA-type scenario, which reflects the UK being outside of the Customs Union, reflecting
the average NTB costs, such as of standard customs arrangements with the EU. Zero tariffs
are applied (“modelled EEA-type”); 27 and
d. A no deal scenario, based on an assessment of average NTB costs between countries
trading on non-preferential World Trade Organization (WTO) terms and applying EU Most
Favoured Nation (MFN) tariffs (“modelled no deal”).
24. The modelled average FTA, EEA-type and no deal scenarios do not deliver on the
Government's objectives, and have been included for analytical purposes only. The EEA would
mean staying in the Single Market, implementing new EU legislation automatically and in its
entirety, and continued free movement. An average FTA, EEA-type scenario or trading with the
EU on WTO terms would not meet the Government's commitment to ensure no hard border
between Northern Ireland and Ireland.
2.2.1 Explanation of scenarios
25. The analysis of options uses a consistent baseline of an approximation of today's economic
arrangements with the EU and the rest of the world. 28 This 'status quo' (“today's
arrangements”) comparison is consistent with most external studies and enables a meaningful
assessment of the economic impacts of different scenarios to be made relative to a common
baseline, as well as to each other. This analytical 'baseline' provides a snapshot of current
market access and regulatory arrangements with the EU. It does not consider how UK or EU
policy will change in the future including, for example, how EU regulation may evolve.
26. Consistent with previous Government analysis and external studies, the analysis has
considered a variety of trading relationships (“scenarios”) as an illustration of the sensitivity of
results to different policy assumptions. 29
27. A modelled no deal scenario is considered as an approximation of the UK's relationship with
the EU in absence of an agreement. In these conditions, it is assumed that the UK and EU
would trade on non-preferential WTO terms with tariffs set at EU applied Most Favoured Nation
(MFN) rates. 30 The Government has analysed how countries trade on non-preferential WTO
terms (both with each other, and the EU), and then has used global trade data on these trading
relationships to estimate potential UK-EU trade costs.
26 'The future relationship between the United Kingdom and the European Union', HM Government, July 2018.
27 From the perspective of this modelling approach, the baseline of the UK’s current trading arrangements is equivalent
to membership of both the EEA and the Customs Union.
28 While not a specific projection of future membership of the EU, this baseline can be interpreted as the status quo
comparison as committed to Parliament on 19 November 2018.
29 The four scenarios, and the policy assumptions underpinning them, were approved by ministers.
30 This is a modelling assumption only. The Government would be free to set its own tariff schedule post-EU exit.EU Exit: Long-term economic analysis 17
28. This is not representative of possible government policy, as it would not meet UK objectives
including avoiding a hard border between Northern Ireland and Ireland. Care should be taken in
the interpretation of results, as the modelled no deal scenario does not perfectly reflect how the
UK and EU might trade on WTO terms. The results could over- or under-state the impact of a no
deal scenario in some areas. For example, the UK and EU start from a position of regulatory
alignment, meaning that differences in regulation could be smaller than in typical trading
relationships on WTO terms. 31 Conversely, many countries trading on WTO terms also have a
range of side agreements for different products or sectors, which may be captured in the
analysis and may therefore overstate the benefits of trading on WTO terms should the UK not
achieve these. Modelling of the no deal scenario also focuses only on trading relationships, and
as such, does not reflect any impacts of changes to wider aspects of the UK-EU relationship, for
example cooperation on science and innovation.
29. A modelled average Free Trade Agreement (FTA) 32 scenario represents a hypothetical FTA,
with zero tariffs, based on estimates of average NTBs between relevant FTA partners. These
are used as a proxy for how the UK could trade with the EU under this type of arrangement. As
such, it does not seek to define or model a bespoke agreement. This scenario is not indicative
of government policy, as it would not meet UK objectives including avoiding a hard border
between Northern Ireland and Ireland.
30. A modelled EEA-type agreement scenario represents membership of the Single Market,
reflecting that non-EU EEA states are not part of the Customs Union 33 and there is free
movement of people. For modelling purposes, in this scenario the UK is modelled as striking a
deal with the EU with zero tariffs. This includes zero tariffs on agri-food products. This
assumption differs from current EEA arrangements, where agri-food is excluded. Therefore,
additional sensitivity analysis considers the impact of applying EU applied MFN tariffs to agri-
food sectors. This scenario is not consistent with government policy as it would mean staying in
the Single Market, implementing new EU legislation automatically and in its entirety, and would
also mean continued free movement. It would also not meet the Government's commitment to
ensure no hard border between Northern Ireland and Ireland. The analysis does not seek to
project any changes to future EU regulation and how this might impact the UK.
31. A modelled White Paper scenario uses trade cost estimates based on policy assumptions set
out in the Government's July 2018 White Paper, “The future relationship between the United
Kingdom and the European Union”. 34 Trade costs are estimated based on assumptions set out
in the White Paper. Details of the relevant economic factors within this policy for each sector
group of the economy are set out in section 3, with further information provided in section 2 of
the Technical Reference Paper.
32. Sensitivity analysis illustrates the potential impact of different levels of trade costs, including
checks at or behind the border and other regulatory costs. Ahead of detailed negotiations on the
legal text, the analytical approach presents a range of possible outcomes of the Political
Declaration. The analysis applies a sensitivity to illustrate the potential impact of higher NTBs,
including checks at or behind the border and other regulatory costs. This illustrative sensitivity
31 An adjustment is made for this in the analysis. Further details are set out in section 2.3.3 of the Technical Reference
Paper.
32 This scenario assumes a zero tariff agreement and uses estimates of average NTBs. This does not represent
government policy and is for modelling simplicity. Historically, agri-food tariffs have been difficult to eliminate in FTAs,
so an additional sensitivity with EU-applied MFN tariffs is considered (see section 4.9).
33 Costs are assumed to arise from a customs border and the administrative requirements to trade under zero tariffs with
the EU (rules of origin).
34 'The future relationship between the United Kingdom and the European Union', HM Government, July 2018.18 EU Exit: Long-term economic analysis
point reflects the midpoint in the difference of NTBs to trade between the modelled White Paper
at one end, and the modelled average FTA scenario at the other and does not represent an
expected outcome. For more details, see section 2.3.2.
2.3 Assessing changes and associated costs of new economic
relationships
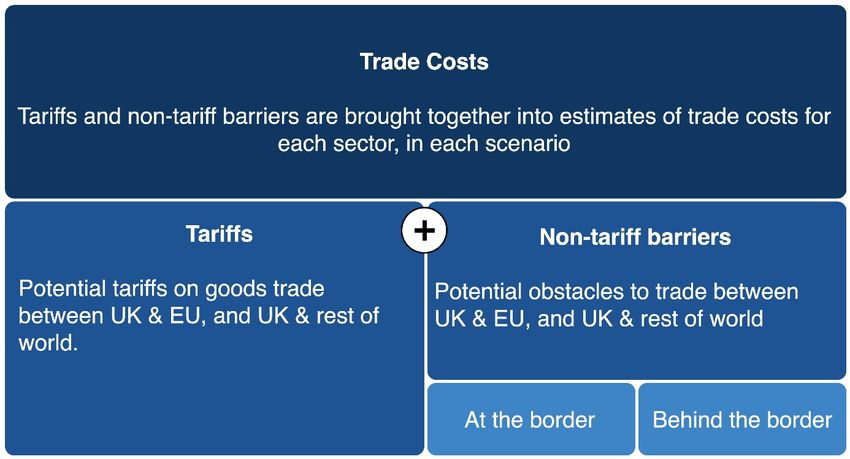
2.3.1 UK-EU tariff and non-tariff barriers methodology
33. All economic models are a simplified representation of reality, and therefore rely on inputs and
assumptions to generate results. The inputs and methodological assumptions for this analysis
are set out below. Further details and examples of potential trade barriers and associated costs
to EU trade for key sectors are set out in section 3.
34. The Government has used a wide range of evidence and approaches to consider how trade
costs differ in each scenario. These costs will be affected by changes in trade barriers resulting
from new arrangements with the EU and new trade agreements with third countries (see section
2.3.4). Two principal trade barriers are estimated: tariffs and non-tariff barriers.
35. Tariffs are a tax or duty to be paid on a particular product that is imported or exported. These
add directly to the costs of trade, increasing the price of traded goods. This analysis estimates
the tariffs in each scenario. For EU member states, this analysis considers current “default” EU
tariffs, and the agreed approach to tariffs set out in the Political Declaration.
36. Non-tariff barriers (NTBs) are administrative, technical and regulatory obstacles to trade.
Some NTBs, such as customs procedures, can be incurred at the border, while others can be
incurred “behind the border”, such as costs associated with the recognition of professional
qualifications. NTBs are particularly important in influencing businesses' ability and willingness
to trade, and are therefore crucial for understanding the potential impacts of changes in the
UK's trading relationships.
37. The analysis considers the following full range of potential drivers of NTBs that could arise in
different scenarios, and where the presence and scale of these barriers and costs differs across
scenarios: 35
i. Customs and Rules of Origin (RoO) requirements including assessment of the
application of tariff rates, customs administrative costs such as documentary requirements,
and associated delays at the border. RoO are the rules that traders must satisfy to qualify
for tariff preferences under the EU's FTAs with third countries (i.e. regional content
requirements). The associated administrative burden and supply chain impacts may impose
extra costs on firms trading with the EU. In the event of no deal, UK firms exporting to the
EU would not have to provide this proof as there would be no FTA with the EU and UK
firms would therefore not be able to benefit from these tariff preferences.
ii. Regulatory burdens and barriers to market entry including the loss of mutual recognition
of testing authorities, which might require goods to be re-approved before sale, divergent
regulations meaning that there are different requirements for goods in different markets and
the loss of mutual recognition of qualifications, which might require lengthier recognition
processes or requalification before certain service providers can provide their services.
Other barriers to market entry include restrictions on the provision of other services,
35 Further detail is set out in Table 3A of the Technical Reference Paper.EU Exit: Long-term economic analysis 19
national requirements, and the loss of “passporting” in financial services. 36 These could
increase costs for service providers, or lead to additional barriers to trade.
iii. Movement of people including temporary mobility for business purposes. Temporary
mobility covers business travel to another country, including to provide a service in that
country. In the absence of such arrangements, these barriers could affect businesses who
provide services alongside goods exports, and all service exporters.
iv. Other, including trade costs affecting multiple sectors. Examples include data protection
regulations, government procurement, cross-border VAT and intellectual property rights.
38. The Government's approach to estimating NTB costs is rooted in an analysis of global trade and
validated against a variety of external evidence. Using robust methods common to international
trade modelling and academic studies, real world data from existing trading relationships are
used to estimate changes to trade costs in different sectors for different modelled scenarios.
Estimating non-tariff barrier (NTB) costs
The analysis has used a range of evidence and approaches to consider how UK-EU trade costs differ
in each of the modelled scenarios including: econometric modelling, external literature, stakeholder
evidence, Government policy experts’ inputs and direct cost evidence (see Figure 2.2 and Technical
Reference Paper, Section 3).
The analysis is anchored in econometric modelling to estimate NTBs for the modelled no deal and
modelled average FTA scenarios, where there is appropriate trade data available. This is based on
real world data from existing trading relationships and an approach that is well-rooted in international
trade analysis. The advantage of this approach is that it captures all the NTBs that have an impact on
trade. The unprecedented nature of the modelled White Paper scenario means it is not possible to
model it directly using the econometric approach described. The analysis uses the modelled no deal
estimates as an 'anchor' and complements this with a variety of evidence on trade costs in each
sector to assess the potential changes in those costs in the modelled White Paper scenario. For the
modelled EEA-type scenario, NTB costs predominantly arise from customs and rules of origin,
reflecting the fact that EEA states are not part of the Customs Union. The Government's analysis
estimates customs costs directly using UK-specific evidence from HMRC (see Technical Reference
Paper, Box 2.A), to which cost estimates from the external literature are added (notably for rules
of origin).
36 'Passporting', Bank of England, accessed 13 November 2018. Passporting: “A firm authorised in an EEA state can
carry on activities that it has permission for in its home state and any other EEA state by either establishing a branch
or agents in an EEA state or providing cross-border services. This is known as 'passporting'.”20 EU Exit: Long-term economic analysis
Figure 2.2: Simplified illustration of the Government's approach to assessing trade costs.
2.3.2 UK-EU trade: assumptions
Tariffs
39. The analysis produces a set of estimates for potential changes to UK-EU import tariff costs for
each sector group in each scenario, expressed as a percentage of the value of UK-EU trade. It
assumes that, compared to today's arrangements:
a. Under the modelled no deal scenario, the UK and EU are assumed to apply the current
EU-applied Most Favoured Nation (MFN) tariff schedule. These are the tariffs that EU
countries charge other members of the WTO in the absence of preferential arrangements,
and can differ significantly across both sectors and products. 37 For example, on average,
additional tariffs for manufactured goods are equivalent to 3 per cent of the value of trade,
and for agri-food 20 per cent of the value of trade. 38 A sensitivity analysis assuming UK
tariffs are set to zero is also included. 39
b. Under the modelled average FTA scenario, the UK is assumed to strike a deal with the
EU with zero tariffs. Additional sensitivity analysis considers the impact of applying EU MFN
tariffs to agri-food sectors, accounting for the fact that historically, agri-food tariffs have
been difficult to eliminate as part of FTAs.
c. Under the modelled EEA-type scenario, the UK is assumed to strike a deal with the EU
with zero tariffs. For modelling purposes this includes zero tariffs on agri-food products.
37 Within certain sectors, the EU allows improved market access to WTO members at below EU-applied MFN tariff rates
for set quantities through the use of tariff-rate quotas (TRQs). However, these have not been considered for the
purposes of this modelling.
38 EU applied MFN tariffs are trade-weighted using 2014-16 UK-EU trade data from TradeMap at the HS-8 level to the
base GTAP 57 sectors. Tariffs for all GTAP 57 goods sectors are subsequently weighted to the modelling sectors
using 2011 GTAP data. 'UK-EU trade 2014-16', Trade Map, accessed on 20 November 2018; 'EU applied MFN tariffs'
Macmap, accessed on 20 November 2018; 'GTAP 57 2011', GTAP, accessed on 20 November 2018.
39 Sensitivity analysis included in section 4.9.EU Exit: Long-term economic analysis 21
Agri-food is excluded from current EEA arrangements, so additional sensitivity analysis
considers the impact of assigning EU applied MFN tariffs to agri-food sectors.
d. Under the modelled White Paper scenario, the UK is assumed to maintain tariff-free trade
with the EU, resulting in no new tariff costs.
40. The Government would be free to decide UK MFN tariff policy under all modelled scenarios.
The assumptions set out above have been made for the purposes of this analysis and, as such,
do not make assumptions about future government policy. Additional sensitivity analysis
considers the impact of a range of potential policy measures. 40
Non-tariff barriers
41. The analysis estimates that NTBs differ between the modelled scenarios. Section 3 considers
these differences in more detail for each of the five sector groups.
42. The analysis produces a set of estimates for potential changes to UK-EU NTB trade costs for
each sector in each scenario, expressed as a percentage of the value of UK-EU trade. Based
on the NTB assumptions set out in section 3, it finds that, on average, compared to today's
arrangements:
a. Under the modelled no deal scenario, additional NTBs are estimated to be equivalent to,
for goods 6 to 15 per cent of the value of trade, and for services 4 to 18 per cent of the
value of trade.
b. Under the modelled average FTA scenario, additional NTBs are estimated to be
equivalent to, for goods 5 to 11 per cent of the value of trade, and for services 3 to 14 per
cent of the value of trade.
c. Under the modelled EEA-type scenario, additional NTBs are estimated to be equivalent
to, for goods 3 to 7 per cent of the value of trade, and for services 1 to 3 per cent of the
value of trade.
d. Under the modelled White Paper scenario, additional NTBs are estimated to be
equivalent to, for goods, 0 to 1 per cent of the value of trade, and for services 2 to 10 per
cent of the value of trade.
43. Ahead of detailed negotiations on the legal text, the most appropriate analytical approach is to
present a range of possible impacts of the Political Declaration. A sensitivity point is assessed,
reflecting different trade barriers that could exist between the modelled White Paper and
modelled average FTA scenarios. Specifically, this sensitivity point reflects the midpoint of the
difference in NTBs between the modelled White Paper and modelled average FTA scenarios.
This sensitivity point has been chosen for analytical purposes and as such does not represent
an expected outcome.
44. The analysis assumes that NTBs are the same in the UK and the EU. This is a simplification for
modelling purposes, and does not prejudge future government policy. In reality, UK and EU
exporters may face differing costs depending on future regulation in each market. Similarly, the
modelling assumes that NTBs are the same across EU member states. In reality, differences
between member states (regulatory or otherwise) mean there is likely to be some variation in
NTBs encountered by businesses exporting to EU markets.
40 Sensitivity analysis included in section 4.9.22 EU Exit: Long-term economic analysis
45. An adjustment is made to the NTBs to reflect the potential difference between joining and
exiting a trade agreement, reflecting the UK's unique starting point. Further details are set out in
section 2.3.3 of the Technical Reference Paper.
2.3.3 UK-Rest of World trade: methodology
46. As with UK-EU trade costs, the Government's approach to estimating UK-Rest of World (RoW)
trade costs is rooted in an analysis of global trade. Real world data from existing trading
relationships are used to estimate the average trade costs faced by importers and exporters in
different sectors in each country, including how these costs could be reduced following the
agreement of new FTAs.
2.3.4 UK-Rest of World trade: assumptions
47. The analysis considers an ambitious, illustrative scenario for future trade deals with new
partners, recognising that there are a range of potential outcomes in the UK's pursuit of a global
trade policy.
48. The analysis assumes that all EU trade agreements with third countries are transitioned in their
current states to UK-specific arrangements, including those EU agreements that are
provisionally applied or agreed but not yet ratified. 41 Therefore, the modelling does not capture
any potential short run changes in the UK's trading relationships with these countries as a result
of the UK leaving the EU.
49. In keeping with the Government's ambitious free trade agenda, the analysis also assumes that,
in the long run, the UK secures new trade agreements with international partners. These
agreements are assumed to cover a broad range of potential trading partners, including the
United States, Australia, New Zealand, and other members of the Comprehensive and
Progressive Agreement for Trans-Pacific Partnership. 42 Assumptions for the illustrative range of
new partnerships are set out in terms of changes to tariffs and non-tariff barriers. The
Department for International Trade will provide country-specific assessments as appropriate in
the negotiation of individual future FTAs. For modelling purposes, the analysis makes no
assumptions about any additional agreements that the EU may strike with third countries.
50. The analysis assumes that the UK will be free to pursue new independent trade deals with the
rest of the world following EU exit. Other factors could support or constrain the UK's trade with
the rest of the world, which are not modelled. These include commitments under the modelled
White Paper.
Tariffs
51. The analysis assumes an ambitious scenario in which tariffs between the UK and potential third-
country trade agreement partners are eliminated by FTAs following EU exit, under all modelled
scenarios. For new trade partners, all tariffs are set to zero, while EU applied MFN tariffs are
41 Only those EU agreements that existed up to 2011 are included in the base data for modelling. This includes EU trade
agreements with Canada, Japan and Vietnam. See Technical Reference Paper for more details.
42 For the purposes of EU exit modelling, the UK is assumed to pursue successful trade negotiations with the United
States, Australia, New Zealand, Malaysia, Brunei, China, India, Mercosur (Brazil, Argentina, Paraguay and Uruguay)
and the Gulf-Cooperation Council (UAE, Saudi Arabia, Oman, Qatar, Kuwait and Bahrain). For more details please
see section 3.1 of the Technical Reference Paper.You can also read