NAVAL POSTGRADUATE SCHOOL - DTIC
←
→
Page content transcription
If your browser does not render page correctly, please read the page content below
NAVAL
 POSTGRADUATE
 SCHOOL
 MONTEREY, CALIFORNIA

 THESIS

 SUBMUNITION DESIGN FOR A LOW-COST SMALL
 UAS COUNTER-SWARM MISSILE

 by

 Keith B. Lobo

 December 2018

Thesis Advisor: Christopher M. Brophy
Co-Advisor: Robert G. Wright
Second Reader: Christopher A. Adams
 Approved for public release. Distribution is unlimited.
THIS PAGE INTENTIONALLY LEFT BLANK
Form Approved OMB
 REPORT DOCUMENTATION PAGE No. 0704-0188
 Public reporting burden for this collection of information is estimated to average 1 hour per response, including the time for reviewing
 instruction, searching existing data sources, gathering and maintaining the data needed, and completing and reviewing the collection of
 information. Send comments regarding this burden estimate or any other aspect of this collection of information, including suggestions
 for reducing this burden, to Washington headquarters Services, Directorate for Information Operations and Reports, 1215 Jefferson
 Davis Highway, Suite 1204, Arlington, VA 22202-4302, and to the Office of Management and Budget, Paperwork Reduction Project
 (0704-0188) Washington, DC 20503.
 1. AGENCY USE ONLY 2. REPORT DATE 3. REPORT TYPE AND DATES COVERED
 (Leave blank) December 2018 Master's thesis
 4. TITLE AND SUBTITLE 5. FUNDING NUMBERS
 SUBMUNITION DESIGN FOR A LOW-COST SMALL UAS
 COUNTER-SWARM MISSILE
 6. AUTHOR(S) Keith B. Lobo

 7. PERFORMING ORGANIZATION NAME(S) AND ADDRESS(ES) 8. PERFORMING
 Naval Postgraduate School ORGANIZATION REPORT
 Monterey, CA 93943-5000 NUMBER
 9. SPONSORING / MONITORING AGENCY NAME(S) AND 10. SPONSORING /
 ADDRESS(ES) MONITORING AGENCY
 N/A REPORT NUMBER
 11. SUPPLEMENTARY NOTES The views expressed in this thesis are those of the author and do not reflect the
 official policy or position of the Department of Defense or the U.S. Government.
 12a. DISTRIBUTION / AVAILABILITY STATEMENT 12b. DISTRIBUTION CODE
 Approved for public release. Distribution is unlimited. A
13. ABSTRACT (maximum 200 words)
 The emergence of high-performance, consumer-grade, and low-cost drones (under $1000), combined
 with artificial intelligence and low-cost computer processing power, has provided the tools and platforms on
 which to build drone swarms. In the context of recent weaponization of commercially available unmanned
 aerial systems (UAS) such as quadcopters, these trends present two major challenges: the possibility of
 defenses getting overwhelmed and the large cost asymmetry between currently available defenses and the
 cost of these threats.
 Survivability methodology was used to study the susceptibility and vulnerability of threat vehicles. This
 analysis was then used to design and develop a submunition possessing a low-cost kill mechanism, such that
 multiple units could be delivered by a low-cost delivery vehicle. Vulnerability analysis revealed that a
 fouling mechanism would be highly effective and was therefore chosen as the kill mechanism. The
 submunition’s aerodynamics were modeled and used to develop a concept of operations involving the
 deployment of multiple submunitions from a single delivery vehicle. The kill mechanism, submunition, and
 delivery vehicle were manufactured using commercially available components and additive manufacturing.
 Experimental testing has demonstrated the viability of these designs and the ability to provide a defense
 against small UAS swarms with low-cost technologies.

 14. SUBJECT TERMS 15. NUMBER OF
 counter-swarm, UAV, UAS, low-cost, weapon, payload, submunition, design PAGES
 81
 16. PRICE CODE
 17. SECURITY 18. SECURITY 19. SECURITY 20. LIMITATION OF
 CLASSIFICATION OF CLASSIFICATION OF THIS CLASSIFICATION OF ABSTRACT
 REPORT PAGE ABSTRACT
 Unclassified Unclassified Unclassified UU

NSN 7540-01-280-5500 Standard Form 298 (Rev. 2-89)
 Prescribed by ANSI Std. 239-18

 i
THIS PAGE INTENTIONALLY LEFT BLANK

 ii
Approved for public release. Distribution is unlimited.

 SUBMUNITION DESIGN FOR A LOW-COST SMALL UAS
 COUNTER-SWARM MISSILE

 Keith B. Lobo
 Captain, Royal Canadian Air Force
 BEng, Ryerson University, 2003

 Submitted in partial fulfillment of the
 requirements for the degrees of

 MASTER OF SCIENCE IN MECHANICAL ENGINEERING

 and

 MASTER OF SCIENCE IN ASTRONAUTICAL ENGINEERING

 from the

 NAVAL POSTGRADUATE SCHOOL
 December 2018

Approved by: Christopher M. Brophy
 Advisor

 Robert G. Wright
 Co-Advisor

 Christopher A. Adams
 Second Reader

 Garth V. Hobson
 Chair, Department of Mechanical and Aerospace Engineering

 iii
THIS PAGE INTENTIONALLY LEFT BLANK

 iv
ABSTRACT

 The emergence of high-performance, consumer-grade, and low-cost drones (under
$1000), combined with artificial intelligence and low-cost computer processing power,
have provided the tools and platforms on which to build drone swarms. In the context of
recent weaponization of commercially available unmanned aerial systems (UAS) such as
quadcopters, these trends present two major challenges: the possibility of defenses getting
overwhelmed and the large cost asymmetry between currently available defenses and the
cost of these threats.

 Survivability methodology was used to study the susceptibility and vulnerability
of threat vehicles. This analysis was then used to design and develop a submunition
possessing a low-cost kill mechanism, so that multiple units could be delivered by a
low-cost delivery vehicle. Vulnerability analysis revealed that a fouling mechanism
would be highly effective and was therefore chosen as the kill mechanism. The
submunition’s aerodynamics were modeled and used to develop a concept of operations
involving the deployment of multiple submunitions from a single delivery vehicle. The
kill mechanism, submunition, and delivery vehicle were manufactured using
commercially available components and additive manufacturing. Experimental testing
has demonstrated the viability of these designs and the ability to provide a defense
against small UAS swarms with low-cost technologies.

 v
THIS PAGE INTENTIONALLY LEFT BLANK

 vi
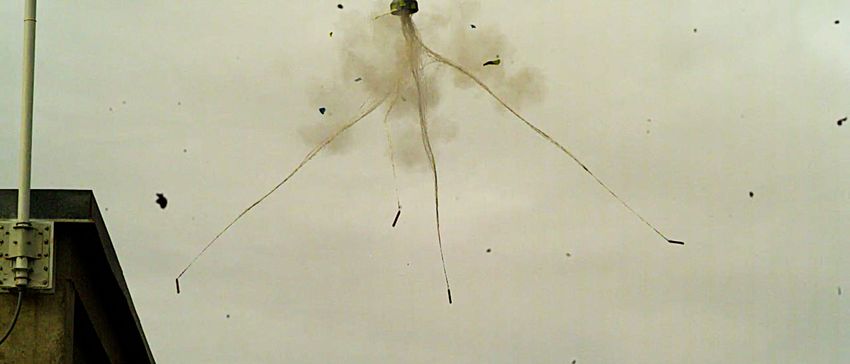
TABLE OF CONTENTS

I. INTRODUCTION..................................................................................................1
 A. EMERGING COST ASYMMETRY IN WARFARE ............................1
 B. UNDERSTANDING THE THREAT .......................................................2
 1. Categorizing Unmanned Aerial Systems .....................................2
 2. Autonomy........................................................................................2
 3. Weaponization ................................................................................3
 4. Cost ..................................................................................................3
 5. Swarm Characteristics ..................................................................4
 C. OBJECTIVES ............................................................................................4

II. THE SURVIVABILITY DISCIPLINE AND METHODOLOGY ....................7
 A. UNDERSTANDING THE KILL CHAIN ...............................................7
 B. APPROACH AND METHODOLOGY ...................................................8
 C. DEFINING A REPRESENTATIVE SYSTEM ......................................8
 D. DEVELOPING A COUNTER-SWARM WEAPON............................10

III. SUSCEPTIBILITY ANALYSIS .........................................................................11
 A. ELECTROMAGNETIC SIGNATURES...............................................12
 1. Radio Detection and Ranging (RADAR) ...................................12
 2. Infrared (IR) .................................................................................16
 3. Light Detection and Ranging (LIDAR)......................................18
 4. Visual Signature ...........................................................................18
 B. ACOUSTIC SIGNATURE......................................................................20
 C. SENSOR EMPLOYMENT CONCEPT ................................................21

IV. AIRCRAFT VULNERABILITY ANALYSIS ..................................................23
 A. CRITICAL COMPONENTS AND KILL MODES .............................23
 1. Fault Tree Analysis and Vulnerability Reduction ....................26
 B. VULNERABLE AREA ANALYSIS ......................................................29
 1. PK|H Determination Using Fragmentation ................................29
 C. KILL MECHANISM ANALYSIS .........................................................31
 1. Severing Communications Links ................................................31
 2. Electromagnetic Energy Exposure (EMP) ................................31
 3. Heat and Blast Exposure (Thermobaric)...................................32
 4. Directed Energy Weapons...........................................................32
 5. Fouling and Entanglement Obstacles.........................................32
 6. PK|H Determination for a Fouling Mechanism ........................33
 vii
V. SUBMUNITIONS AND KILL MECHANISM DEVELOPMENT ................35
 A. CONCEPT OF OPERATIONS (CONOPS)..........................................35
 1. Detection .......................................................................................35
 2. Acquisition and Targeting...........................................................35
 3. Launch and Delivery....................................................................35
 4. Intercept ........................................................................................36
 5. Twin Engagement Scenarios .......................................................36
 B. SUBMUNITION DESIGN ......................................................................38
 1. Submunition Aerodynamic Analysis ..........................................38
 2. Bomblet Design.............................................................................43
 C. KILL MECHANISM DESIGN ..............................................................44
 D. DELIVERY VEHICLE ...........................................................................46

VI. TESTING CAMPAIGN ......................................................................................47
 A. KILL MECHANISM TESTING ............................................................47
 1. Proof of Concept (First Generation) ..........................................47
 2. Flight Test Rig (Second Generation) ..........................................47
 B. BOMBLET TESTING.............................................................................51

VII. CONCLUSIONS ..................................................................................................55
 A. SUMMARY ..............................................................................................55
 B. FUTURE WORK .....................................................................................55

APPENDIX. ......................................................................................................................57

LIST OF REFERENCES ................................................................................................59

INITIAL DISTRIBUTION LIST ...................................................................................63

 viii
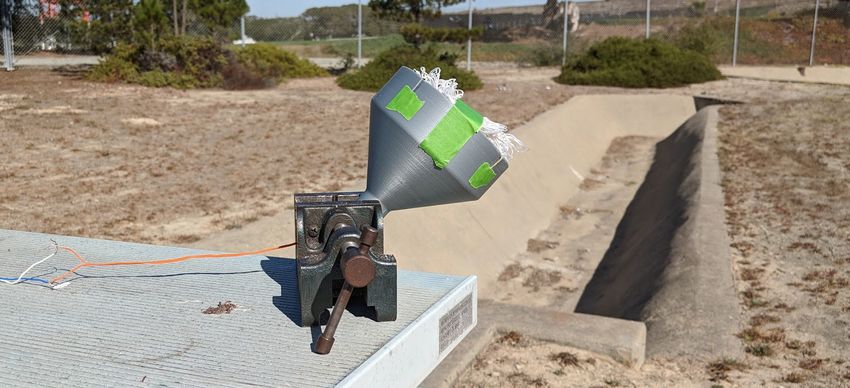
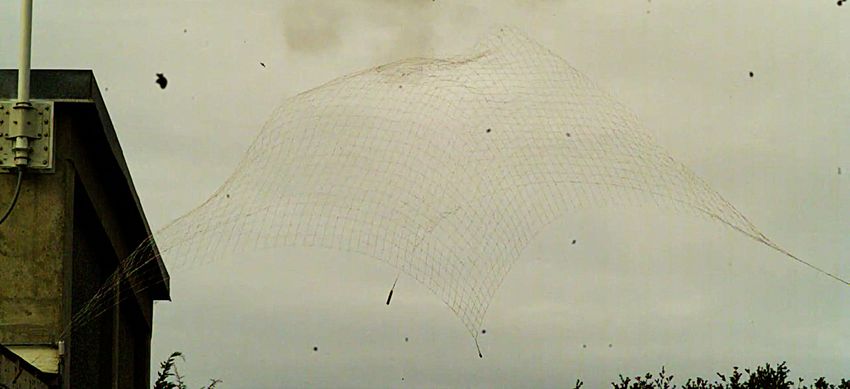
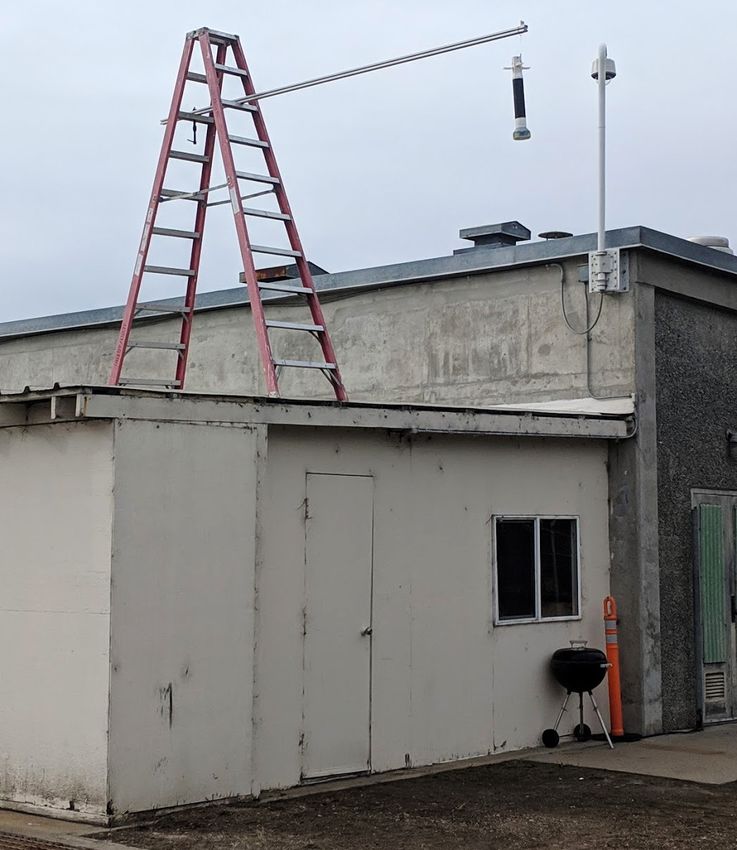
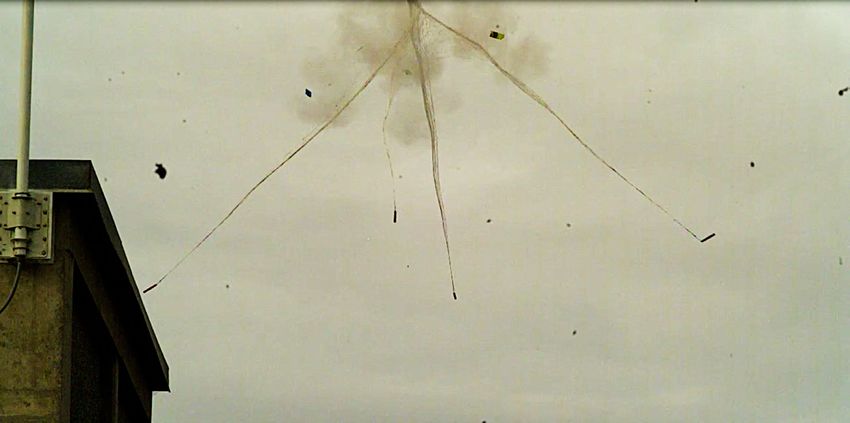
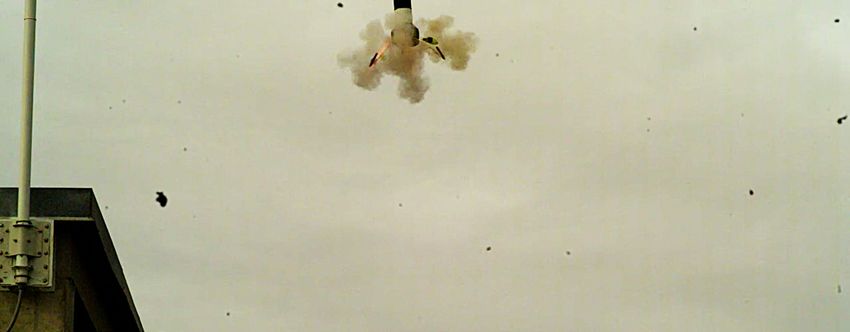
LIST OF FIGURES

Figure 1. Kill Chain. Source: [14]. ..............................................................................7

Figure 2. Impedance as a function of index of refraction at a medium interface. .....14

Figure 3. Fault tree for attrition kill on a weaponized low-cost commercial
 UAS............................................................................................................26

Figure 4. Fault tree for mission kill on a weaponized low-cost commercial
 UAS............................................................................................................26

Figure 5. Fault tree for combined mission and attrition kills for a low-cost
 commercial UAS. .......................................................................................27

Figure 6. Skywalker Technologies X-6 FPV Wing EPO 1500mm. Source:
 [27]. ............................................................................................................29

Figure 7. Engagement geometry. ..............................................................................36

Figure 8. Vertical and horizontal profiles of minimum range intercept. ...................37

Figure 9. Grid fin modelling in SolidWorks Flow. ...................................................40

Figure 10. Lift forces on fin design .............................................................................41

Figure 11. Drag forces on fin design. ..........................................................................41

Figure 12. Initial submunition design used for SolidWorks Flow analysis. ...............42

Figure 13. Lift force on submunition body. ................................................................42

Figure 14. Drag forces on submunition body. .............................................................43

Figure 15. SolidWorks model of bomblet designed by Robert Wright at NPS
 Rocket Lab .................................................................................................43

Figure 16. Initial kill mechanism design fitted with brass weights and packaged
 Dyneema net ..............................................................................................45

Figure 17. Second kill mechanism design fitted with drop test rig .............................46

Figure 18. Second kill mechanism with net packaged in stowage space and held
 with tape. ....................................................................................................48

Figure 19. Nose-down deployment test configuration. ...............................................49

 ix
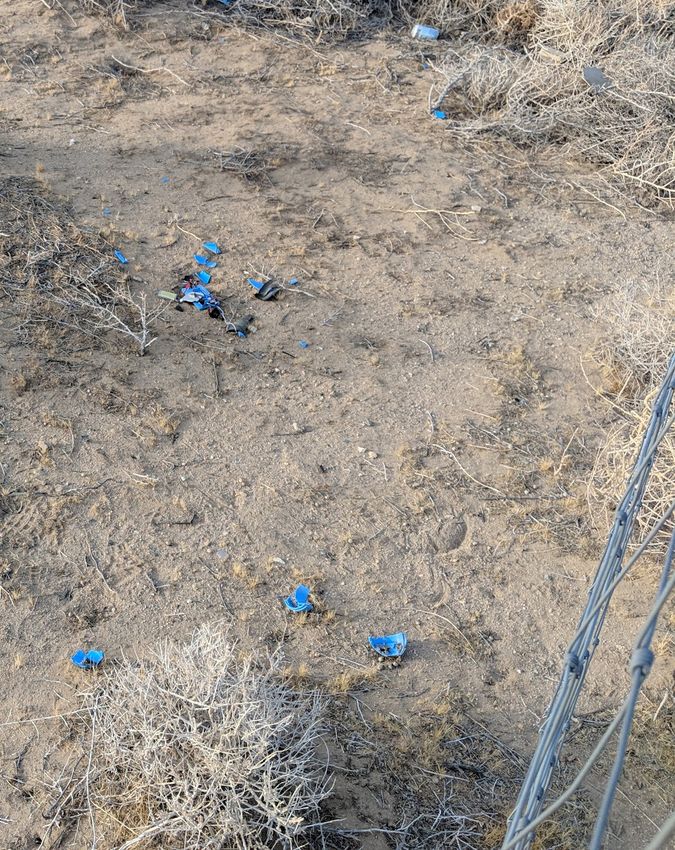
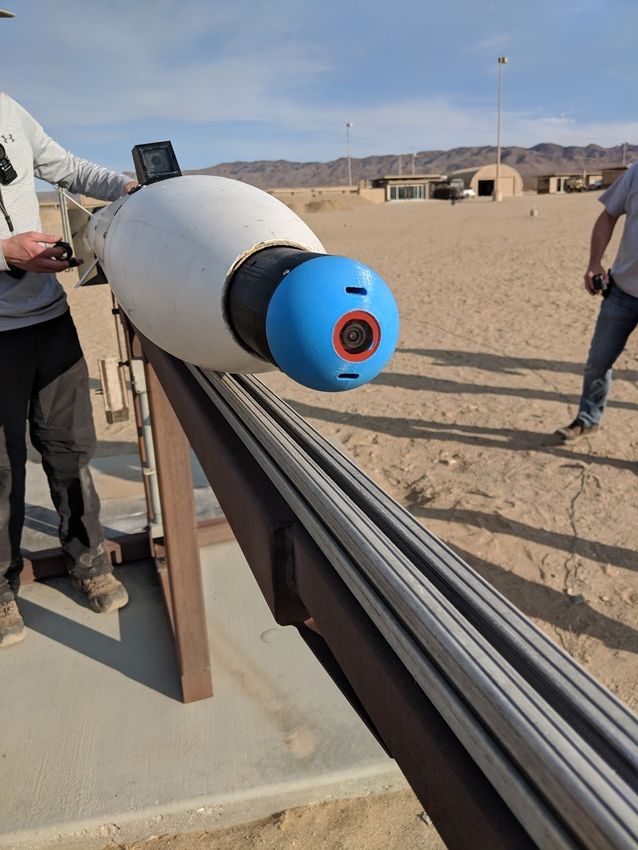
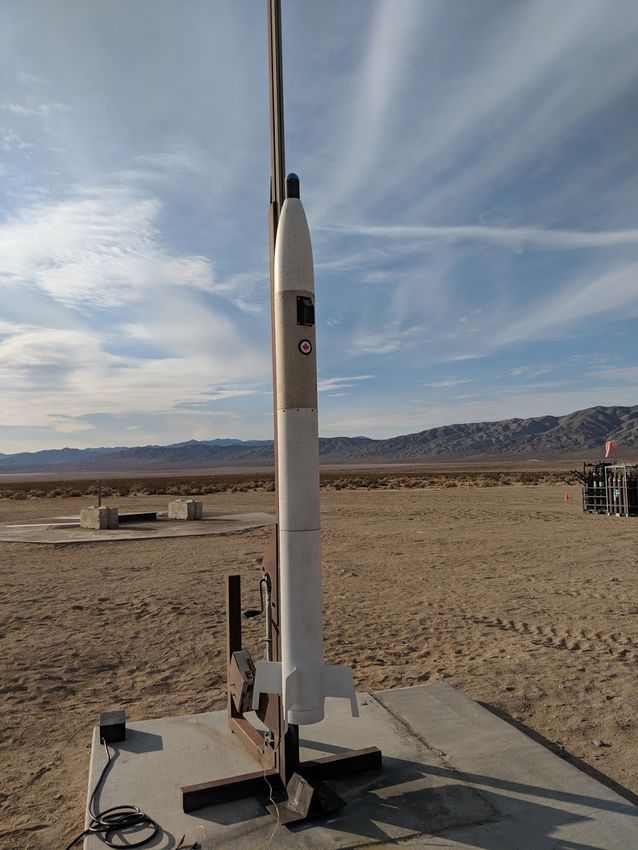
Figure 20. Flight test rig net firing 1. ..........................................................................49

Figure 21. Flight test rig net firing 2. ..........................................................................50

Figure 22. Flight test rig net firing 3. ..........................................................................50

Figure 23. Flight test rig net firing 4 ...........................................................................50

Figure 24. Nose-mounted submunition .......................................................................51

Figure 25. Nose-mounted submunition on rocket in launch configuration. ................52

Figure 26. Servo section with partially deployed fins, remaining on the rocket,
 as seen from the submunition camera. .......................................................53

Figure 27. Front half of the bomblet falling away from rocket as seen by rear-
 facing camera mounted on rocket. .............................................................53

Figure 28. Gouging caused in the submunition stowage tube by the departing
 bomblet. .....................................................................................................54

Figure 29. Bomblet front half debris field at impact location. ....................................54

 x
LIST OF TABLES

Table 1. U.S. DoD classification summary table. Source: [3]. ..................................2

Table 2. Performance goals of a representative threat system. Source: [16]. ............9

Table 3. Assessed performance of designed representative threat system.
 Source: [16]................................................................................................10

Table 4. Assumptions made for RADAR range analysis.........................................15

Table 5. Assessed RADAR detection range results. ................................................15

Table 6. Assessed IR detection range results for frontal profile for various
 focal lengths and probability of detection. .................................................17

Table 7. Assessed IR detection range results for side profile for various focal
 lengths and probability of detection. ..........................................................18

Table 8. Subsystem functional grouping..................................................................23

Table 9. Summary of critical components and assessed kill modes ........................25

Table 10. Summary of Vulnerability Reduction Principles applied to low-cost
 UAS............................................................................................................28

Table 11. Vulnerable Area Determination of the Representative Threat system. .....30

Table 12. Engagement scenarios and tactics. .............................................................38

Table 13. Submunition terminal velocity determination using SolidWorks
 Flow. ..........................................................................................................39

Table 14. Bill of Materials (BOM) for bomblet with approximate costs ..................44

Table 15. Parts list for representative threat system designed by Capt. Kai
 Grohe..........................................................................................................57

 xi
THIS PAGE INTENTIONALLY LEFT BLANK

 xii
LIST OF ACRONYMS AND ABBREVIATIONS

AGL Above Ground Level
BDA Battle Damage Assessment
BOM Bill of Materials
CAD Computer Aided Design
CONOPS Concept of Operations
COTS Commercial-off-the-shelf
CRUSER Consortium for Robotics and Unmanned Systems Education and
 Research
DoD Department of Defense
EM Electromagnetic
E3A Essential Events and Elements Analysis
EMP Electromagnetic Pulse
FDM Fused Deposition Modelling
FL Flight Level
FOV Field of View
IDF Israeli Defence Forces
IED Improvised Explosive Device
IR Infrared
LIDAR Light Detection and Ranging
LWIR Long-Wave Infrared
MAE Mechanical and Aerospace Engineering
MGTOW Maximum Gross Take-off Weight
MWIR Medium-Wave Infrared
NATO North Atlantic Treaty Organization
NPS Naval Postgraduate School
RADAR Radio Detection and Ranging
RCAF Royal Canadian Air Force
RCS Radar Cross-Section
sUAS Small Unmanned Aerial System
SWIR Short-Wave Infrared
 xiii
TRADOC U.S. Army Training and Doctrine Command
UAS Unmanned Aerial System
USN United States Navy
X-MADIS Expeditionary Mobile Aerial Defense Integrated System

 xiv
ACKNOWLEDGMENTS

 I am sincerely grateful for the opportunity rendered to me by the Royal Canadian
Air Force to attend the Naval Postgraduate School for over two years in pursuit of a
graduate education for my professional development and betterment. My academic
endeavors have been made fruitful and enjoyable because of the incredible faculty and
staff at NPS. From the staff at the International Graduate Programs Office to the
Mechanical and Aerospace Engineering departmental staff (Cdr. Todd Greene, Professor
Garth Hobson, and the education technicians), the exceptional support provided has
allowed me to pursue academic endeavors beyond what I envisioned at the start of my
journey at NPS.

 I would like to thank Professor Christopher Brophy, my advisor, and the rest of
the staff at the NPS Rocket Lab (Lee Van Houtte, Dave Dausen, and Dr. Josh Codoni) for
their support with funding, advice, and labor toward my thesis project. Among the staff at
the Rocket Lab, the support of my co-advisor Robert (Bobby) Wright stands out. Bobby
has spent countless hours designing and building parts, guiding the various design and
testing efforts, and providing technical and academic advice to bring this thesis project to
its successful completion. I would also like to thank Professor Christopher Adams, my
second reader, for introducing me to the subject of survivability and for the support
provided in applying this field of knowledge to this thesis topic. My gratitude also goes to
Capt. Kai Grohe (RCAF), on whose thesis work this project was furthered, and fellow
students at the NPS Rocket Lab, particularly LT Matthew Busta (USN), without whose
shared effort the test launches would not be possible.

 The innumerable challenges that must be overcome during a graduate education
would be insurmountable without the tremendous support of colleagues, friends, and
family. Particular among these were my fellow international students from my refresher
quarter and my fellow students in the Mechanical and Space Systems Engineering
programs. Above all else, I owe my success to the love and support of a dedicated
military spouse and a loving child. Mena and Penny, I share this accomplishment with
you.
 xv
THIS PAGE INTENTIONALLY LEFT BLANK

 xvi
I. INTRODUCTION

A. EMERGING COST ASYMMETRY IN WARFARE

 Throughout history, combatants have always sought to exploit asymmetric
advantages, as a way to maximize damage to their opponents while minimizing harm to
themselves. The strategic goal of such warfare is rarely to defeat the enemy’s forces in
the battlespace [1]. Often, the goal is simply to bleed resources, damage the enemy’s
morale and to create tactical opportunities. Whereas until recently such attacks have
primarily consisted of traditional guerilla warfare, the confluence of various
technological developments in the last decade has brought about the advent of a new
asymmetric threat: autonomous vehicle swarms.

 Several key technologies have converged to make this threat a reality. Swarms of
vehicles conducting an attack requires low-cost vehicle platforms, artificial intelligence,
and low-cost computer processing power. The emergence of consumer-grade low-cost
drones (under $1000) combined with the aforementioned trends has provided the
platforms on which to build large drone swarms. The cost asymmetry becomes obvious
by solely considering the cost to defeat a single remotely piloted drone. In the most
extreme case, the cost to defeat a single threat can exceed the wildest imaginations. In
March 2017, Gen. David Perkins, Commander of the U.S. Army Training and Doctrine
Command (TRADOC) detailed how the Israeli Defence Forces (IDF) defeated an enemy
drone valued at approximately $200 with a Patriot surface-to-air missile with a unit cost
greater than $3 million [2]. Extending this incident, it is possible to imagine a scenario
where defenses can be easily overwhelmed, from both tactical and economic
perspectives. As such, it is incumbent on modern military forces to consider and develop
technologies which will be capable of defeating emerging low-cost threats at a cost match
or near-match.

 1
B. UNDERSTANDING THE THREAT

 1. Categorizing Unmanned Aerial Systems

 The U.S. Department of Defense (DoD) broadly categorized unmanned aerial
systems (UAS) into five groups based on maximum gross take-off weight (MGTOW),
nominal operating altitude, and nominal operating speed [3] as detailed in Table 1.

 Table 1. U.S. DoD classification summary table. Source: [3].

 Maximum Gross Nominal
UAS Representative
 Take-off Weight Operating Speed (m/s)
Group UAS
 (MGTOW) (kg) Altitude (m)
Group 1 0–9 < 366 AGL < 51 RQ-11 Raven
Group 2 9.5 - 25 < 1067 AGL ScanEagle
 < 129
Group 3 < 599 RQ-7B Shadow
 < FL 180 MQ-8B Fire Scout
Group 4
 MQ-1A/B Predator
 > 599 Any airspeed
 MQ-9 Reaper
Group 5 > FL 180
 RQ-4 Global Hawk

 Low-cost systems generally fall into Group 1 or Group 2. However, even systems
in these categories can carry tactically relevant payloads. For example, the DJI MG-1
AGRAS is an agricultural spraying drone, and can carry and disperse 10 kg of liquids [4]
and retails for approximately $15,000. Conversely, at the opposite end of the cost
spectrum, are drones like the Syma X-8C. This is a drone that retails for approximately
$100 and can carry a payload of 0.2 kg. This equates to half the weight of an M67
fragmentation grenade. Fixed wing drones, ranging in price from a few hundred to
several thousand dollars, with capabilities including advanced sensors or aerial spraying
are also emerging from the agricultural community [5].

 2. Autonomy

 Autonomy can range from single features to swarm control. At the most basic
level, commercially available drones can be programmed to follow pre-determined paths
 2
and execute pre-determined actions, employing onboard sensors, (such as GPS receivers,
IR, stereovision, etc.) and inertial navigation systems (INS) which normally incorporate a
compass, accelerometers and gyroscopes.

 In December 2017, China put on a record setting aerial display using 1,180 drones
to exhibit an aerial light show as part of the welcoming ceremony for the Guangzhou
Fortune Forum. The exhibit was controlled by a single console and operator, developed
by Chinese start-up eHang [6] using commercially available technologies with some of
their own innovations. In July 2018, Intel conducted a similar demonstration with 500
drones, at Travis AFB, for Independence Day celebrations [7].

 The evolution of artificial intelligence, will, in due course, enable an extremely
high level of autonomy. A demonstration of a high level of autonomy, while operating as
a swarm, was shown by DoD’s Strategic Capabilities Office. The drone swarm
demonstrated “collective decision-making, adaptive formation flying and swarm self-
healing.” [8] The Perdix drones used for the demonstration were 16.5 cm (6.5”) in length,
30 cm (11.8”) in wingspan, with 6.6 cm (2.6”) propellers, weighing 290g [9].

 3. Weaponization

 Commercially available quadcopters are already being employed by various
opposing forces in Iraq and Afghanistan. In early 2017, reports emerged of the Islamic
State in Iraq and Syria (ISIS) using quadcopters to drop various explosive devices, from
grenades and IEDs to fused mortar rounds [10]. These videos show drone operators
engaging in careful target selection (with a preference for lightly armored vehicles),
descent to a release point, and post-release egress maneuvers and camera slewing for
possible Battle Damage Assessments (BDA). These videos offer evidence that
weaponization of commercially available quadcopters is becoming regularized as an
option for asymmetric warfare.

 4. Cost

 The costs of a drone can vary substantially according to capability. There is,
however, some consistency in the relative pricing of components. The major cost drivers

 3
for drones are often the “brains” of the system, or the chipsets used to control the vehicle,
communicate with other vehicles, maneuver and exercise collective decision-making.
These include the microcontroller chipsets, onboard sensors, communications systems
and motors [11]. With development of artificial intelligence chipsets, largely driven by
commercial information technology requirements, it is predicted that costs of these
chipsets can be driven down to $25 by 2022 [12]. Structural components and batteries are
relatively cheap. And in the case of drones developed without re-use considerations, the
costs for the latter components can be even lower.

 5. Swarm Characteristics

 With increasing autonomous capabilities, UAS swarms are adapting certain
characteristics of resilient systems, in response to disruptions [13]:

 • heterogeneity—the uniformity of response to a specific disruption

 • modularity—the ability of the swarm to compartmentalize sub-elements;
 and

 • randomness—the predictability of the response to a given disruption.

 Resilient systems demonstrate these qualities in response to disruptive events.
These events can range from systemic, external or human-triggered. The range and
quality of response can be used to characterize the level of resilience, itself a proxy
measure of autonomy.

C. OBJECTIVES

 Defeating future swarm threats at costs approaching parity requires the design and
development of several key technologies at relatively low cost. The objectives of this
research project are to:

 • analyze and assess a representative threat system using an appropriate
 methodology to inform the development of systems that could counter
 small UAS (sUAS) swarms;

 4
• develop a delivery system consisting of a single platform or employing a
 collection of submunitions, capable of intercepting multiple targets in a
 swarm;

 • design a conceptual framework for the employment of these counter-UAS
 systems against a swarm; and,

 • develop a compact terminal defeat mechanism for sUAS that can be
 employed in conjunction with the delivery system to neutralize the
 platforms being employed in the swarm.

 Reducing cost asymmetry will require that these systems use commercial-off-the-
shelf (COTS) components and non-specialized, commercially available fabrication
techniques. As such, these technologies need to be designed and developed using
software and tooling regularly available at NPS.

 5
THIS PAGE INTENTIONALLY LEFT BLANK

 6
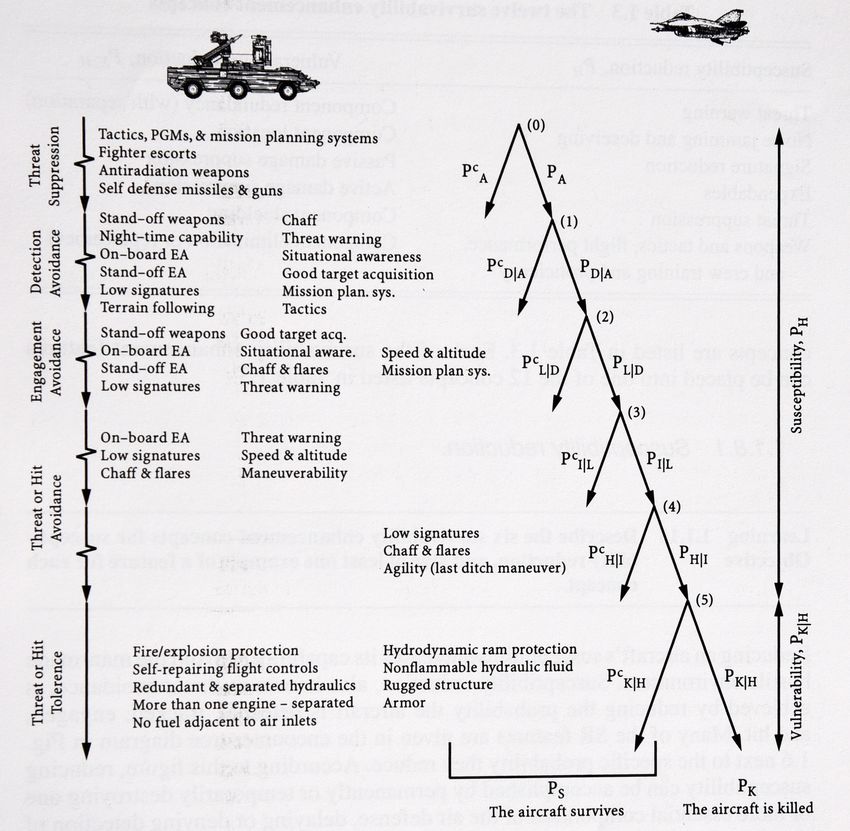
II. THE SURVIVABILITY DISCIPLINE AND METHODOLOGY

A. UNDERSTANDING THE KILL CHAIN

 Weapon systems achieve a mission kill (failure of the threat system to achieve its
objectives) or attrition kill (destruction or incapacitation of the threat system) through a
sequence of events known as the kill chain. This kill chain, as depicted in Figure 1, is the
product of the probabilities of those events.

 A successful kill requires success on a chain of events, which have individual
 probabilities. These combine to form a “Kill Chain.”

 Figure 1. Kill Chain. Source: [14].
 7
The probability of an incoming threat UAS being killed is a function of the
readiness of the air defence system, detection of the UAS, successful engagement by
defensive countermeasures or weapons and damage from an engagement:

 = ∙ | ∙ | ∙ | ∙ | ∙ | (1)

 A successful defensive engagement requires all components of the kill chain to
have a high probability of success. When designing a weapon system, designers have
some control over the detection, intercept, hit and kill phases of the kill chain. The
remaining phases are operationally defined. Optimization of the kill chain requires
analysis of both the threat and response systems over these design phases.

B. APPROACH AND METHODOLOGY

 The Survivability Discipline, significantly codified by Robert E. Ball in The
Fundamentals of Aircraft Combat Survivability Analysis and Design [14], can essentially
be applied by considering two major subordinate fields of study: susceptibility and
vulnerability. Susceptibility is concerned with the likelihood of the platform being
successfully targeted and hit by a weapon (expressed as the Probability of Hit (P H )).
Vulnerability is concerned with the likelihood of the platform being immobilized or
destroyed or degraded (to a point of negating it as a threat), following impact by a
weapon (expressed as the Probability of Kill given a Hit (P K|H ). The product of these two
analyses will provide the likelihood of a target being killed:

 = ∙ | (2)

 To assess the likelihood of a successful kill chain, analysts normally combine a
susceptibility analysis and a vulnerability analysis. This methodology can be used to
develop a system that will be successful in engaging and eliminating small UAS threats.

C. DEFINING A REPRESENTATIVE SYSTEM

 Development of a low-cost counter-swarm weapon requires the study of a
representative threat system. As detailed earlier, a representative threat system would be a
low-cost system capable of lethal swarm attacks.

 8
The development of a system with such performance characteristics can be
accomplished using commercial-off-the-shelf components with instructions from
hobbyist websites. The instructables.com website offers guidance for hobbyists on
building drones with a list of design steps (first 6 of 20 steps) [15] :

 1. Find a purpose for your aircraft.

 2. Pick your electronics.

 3. Estimate the total weight of your aircraft.

 4. Determine wing loading.

 5. Decide on a wingspan.

 6. Design your fuselage and tail section.

 Applying the steps to the design of a small self-designed drone, the outline of a
self-designed drone can be defined. The target performance criteria, listed in Table 2,
were defined as:

 Table 2. Performance goals of a representative threat system.
 Source: [16].

 Performance Criteria Desired value
 Velocity 20 m/s
 Payload 2-3 kg
 Endurance 20-60 mins
 Unit Cost < $1000

 The goal of the criteria in Table 2, was to define a small UAS capable of
delivering a payload with a similar weight to that of a fragmentation or High Explosive
Anti-Tank warhead employed with an RPG-7. Following these steps, a representative
aircraft was defined with a parts list and appears in the Appendix. Analysis of the above
system, by Capt. Kai Grohe (Royal Canadian Air Force (RCAF)), using various online

 9
hobbyist calculators and basic aerodynamics calculations predicted performance, is listed
in Table 3.

 Table 3. Assessed performance of designed representative threat
 system. Source: [16].

 Performance Predicted Value
 Criteria
 Velocity 23.3 m/s
 Payload 1.9 kg
 Endurance 20 mins
 Estimated cost < $1000 / unit

 This defined system represents a threat that could be employed at low-cost in a
swarm configuration to overwhelm potential defenses. Assessing the survivability
characteristics of such a system will allow for the definition of potential kill mechanisms.

D. DEVELOPING A COUNTER-SWARM WEAPON

 This report will use the methodology laid out by Dr. Ball to perform a
susceptibility analysis (Chapter III) and vulnerability analysis (Chapter IV) on the
representative threat system, and other sUAS. These analyses rely on literature surveys of
existing technologies, applied to the problem of countering small UAS threats.

 These analyses will then be used to design a submunition and a kill mechanism,
and to develop a concept of operations to deploy these systems against the representative
threat (Chapter V), using an existing low-cost delivery vehicle. Test campaign results will
be detailed in Chapter VI.

 10
III. SUSCEPTIBILITY ANALYSIS

 Susceptibility refers to “the probability of a platform being impacted by one or
more damage/kill mechanisms in the pursuit of its mission.” [14] The susceptibility of a
platform in an encounter with a countering system is dependent upon three factors: the
performance and lethality of the countering system, the characteristics of the platform
itself and the engagement scenario. From the kill chain, susceptibility (defined as
Probability of Hit (P H )) is a combination of several factors captured in the susceptibility
equation:

 = ∙ | ∙ | ∙ | ∙ | (3)

where,

 • P A is the probability that the defensive system is active;

 • P D|A is the probability that the defensive system detects the threat;

 • P L|D is the probability that the defensive system launches a
 countermeasure weapon against the threat;

 • P I|L is the probability of an intercept given a launched countermeasure;
 and,

 • P H|I is the probability of a hit by the countermeasure weapon given an
 intercept trajectory.

 All of these factors are largely dependent on the engagement scenario including
the operational posture and tactics employed by the defensive system at the time of
engagement. The greatest variability, which can be qualitatively assessed using open
source literature, is the probability of detection (P D|A ). As such, a threat platform
susceptibility assessment based on the signatures of commercially available drones could
inform on the detectability of a threat UAS.

 11
A susceptibility assessment is “a modelling and quantification of the sequence of
events and elements in the encounter between the aircraft and the threat against it, until
one or more hits on the aircraft occurs.” [14] Normally referred to as an “Essential Events
and Elements Analysis” (E3A). An effective susceptibility study would consider the
platform’s observables or detectable signatures, aerodynamic performance and self-
protection capabilities. Scenario modeling would normally include the physical
environment in which the encounter occurs, multi-platform deployment patterns and
activity including flight paths, tactics and any supporting forces. With low-cost small
UAS systems as detailed in the representative threat system, the susceptibility assessment
must necessarily focus on observability. Swarms employing low-cost UAS are unlikely to
employ self-protection measures on individual platforms due to cost considerations, and
aircraft size and performance limitations. The swarm would likely rely on large numbers
overcome the disadvantage of reduced self-protection.

 One of the key events in susceptibility assessments is the probability of detection
(P D|A ) which depends heavily on the aircraft’s signature. The lower the aircraft signature,
the lower the probability of detection and hence lower probability of kill (i.e., lower
susceptibility). There are several signatures that could be considered including those
across the electromagnetic (EM) spectrum, and aural signature. Quantitative assessments
would be challenging given the breadth of the field and the paucity of granular data.
However, it is possible to do a qualitative assessment on the different signatures and
consider a conceptual framework for the employment of sensors to maximize the
probability of detection.

A. ELECTROMAGNETIC SIGNATURES

 The electromagnetic emissions of a target can range from active transmissions to
reflections of energy across the electromagnetic spectrum, including in the radio, infrared
and visible light portions of the spectrum.

 1. Radio Detection and Ranging (RADAR)

 Radar is an object-detection system that uses radio waves to detect, identify and
classify objects. Radar antennas radiate EM pulses in the direction of the target. When the
 12
signal passes over the target, some of the incident energy in the EM pulse is absorbed as
heat, some is reflected, and some passes through the material it contacts. The ability of
the radar to detect the target depends on energy that is reflected or re-radiated from the
target back toward the radar receiver.

 There are two schemes of radar operation: active and semi-active. Active radars
rely on co-located transmitters and receivers to detect and triangulate a threat’s position.
Semi-active radars combine, either an off-board transmitter or a transmitter located
separately on the weapon, which illuminates the target, with on-board receivers which
only receive the signals. The range of detection is governed by the radar range equation:

 1�
 2 2 4
 = �(4 )3 � (4)

where,

 • P is the peak output power;

 • G is the antenna gain;

 • is the wavelength;

 • is the Radar Cross-Section (RCS);

 • N is the noise power; and,

 • SNR is the minimum signal to noise ratio.

 The variables in the equation change depending on the environment and
equipment involved. The amount of energy returned is highly dependent on the radar
cross section (RCS) of the target. The RCS is a function of absolute size, material,
incident angle, and reflected angle. Two of these are a function of the aircraft’s design
and can be studied using approximate characteristics of the representative threat:

 • Size. The representative threat UAS is assumed to have a length of 1m and
 a wingspan of 1.5m and a side profile height of 0.25m.

 13
• Material. The representative UAS is presumed to have wings made of a
 light-weight foam material which has a relative permittivity (ε r ) and
 permeability (μ r ) of approximately 1.0. This is the approximate impedance
 of air. Since foam and air are fairly close in impedance, there is likely to
 be very little reflection or re-radiation of the electromagnetic wave from
 the target. This is shown in Figure 2, where the surface reflectance is zero
 when the impedance of the target is equal or close to the impedance of air.
 Hence, the material of the UAS is considered ‘radar absorbent’ and very
 little energy is reflected back to the radar which makes it very hard to
 detect.

 Figure 2. Impedance as a function of index of refraction at a medium
 interface.

 Due to their small size and the common use of radar absorbent material, low-cost
UAS often have small RCS/ radar signature and are therefore, difficult for any radar to
detect at ranges that would be tactically useful. For example, experimental results
obtained by C. J. Li and H. Ling for the RCS measurements of three popular
commercially available quadcopters (DJI Phantom 2, DJI Inspire 1 and 3DR Solo) varied
from -9.3 dBsm to -19.4 dBsm in the 12–15 GHz frequency band depending on the angle
of incidence and surface area presented by these drones. The authors note no significant

 14
change in signature with spinning blades and a reduction in the range of 10–11.6 dB in
the 3–6 GHz band [17].

 Using this data and several assumptions for the radar range equation, a basic
estimate of detection ranges can be constructed for an active system on board. These
assumptions, detailed in Table 4, were based on work done during the ME4704 Missile
Design course, with input from Dr. David Jenn at NPS.

 Table 4. Assumptions made for RADAR range analysis.

 Radar Characteristic Assumed Specification
 Transmitted Power 5W
 Antenna Diameter (Missile) 17.78 cm (7”)
 Antenna Diameter (Ground) 60.96 cm (24”)
 Antenna Efficiency 0.7
 Frequency 13.5 GHz
 Signal-to-Noise Ratio (SNR) 15 dB
 Bandwidth 100 MHz
 Equivalent Noise Temperature 290 K

 Using these assumptions, the gains for the semi-active and active antennas
(missile and ground were) were calculated:

 4
 = (5)
 2

 These gains were then used with the radar range equation to determine the
maximum detection ranges using the radar cross sections provided by Li and Ling. The
results for an onboard active radar, ground based active radar and a semi-active radar
employing a ground-based transmitter and an aerial receiver are presented in Table 5.

 Table 5. Assessed RADAR detection range results.

 RCS Active (Airborne) Active (Ground Based) Semi-Active
 -19.4 dBsm 0.121 km 1.57 km 0.88 km
 -9.3 dBsm 0.218 km 2.81 km 1.57 km

 15
These results demonstrate the challenges with employing radars for detecting and
targeting small commercial UAS. Effective detection ranges require higher power ground
based active radars. However, even these can be negated with efforts aimed at reducing
the radar cross section. This can range from using low impedance materials to flight
profiles which minimize the cross-section presented.

 2. Infrared (IR)

 IR signature is composed of radiation emitted and reflected from the aircraft
typically in the 1 to 3 μm (Short Wave Infrared band [SWIR]), 3 to 5 μm (Medium Wave
Infrared band [MWIR]) and 8 to 12 μm (Long Wave Infrared band [LWIR]). The general
sources of this signature are:

 • radiation emitted by the airframe and propulsion system,

 • radiation emitted by the exhaust gas or plume from the engine and

 • reflected radiation incident on the aircraft.

 Relative to a typical aircraft, a low-cost UAS has an extremely low infrared
signature. Especially if propelled by a non-combusting propulsion system (electric
motors). Aside from the magnitude of the emission, the spectrum also determines which
sensors can be most effective at detecting a UAS. Research from the Naval Air Weapons
Centre indicates that sensors in the MWIR region are most effective at picking up
emissions such as reflected sunlight [18]. Zheng et al. also found that the peak spectral
intensity for UAS using a turbine occurred in the Medium Wave IR range [19]. Sensors
using focal plane arrays consisting Mercury Cadmium Telluride (HgCdTe) or Indium
Antimonide (InSb) photovoltaic detectors would offer high detectivity for the mid-wave
IR spectrum. Compact commercial systems that could be placed onboard an airborne
platform or surface surveillance system are available. These systems, however, come at a
high cost. An example of such a system is the Zafiro HD Cooled Camera Module by
Leonardo DRS Technologies with a spectral response of 3.7 to 5.1 microns [20]. To
translate this into an effective probability of detection and range, criteria developed by

 16
John Johnson, translated into equations by John Love from DRS Technologies, was used
[21]:

 ( ) = � ℎ ( ) ∗ ℎ ( ) (6)

 ℎ ( )
 ( ) = ℎ ( ) (7)

 ( )
 (2 ∗ No. per Johnson criteria)
 =

 (8)

 1000
 ( ) = ∗

 (9)

 Using these equations and assuming a detector pixel pitch of 12 μm, with the
number of cycles in the Johnson criteria as 0.75 for 50% probability of detection and 1.34
for 90% probability, yields the following detection ranges for the representative threat,
with a maximum presented area of 1.5m by 1m.

 Table 6. Assessed IR detection range results for frontal profile for
 various focal lengths and probability of detection.

 Focal Length FOV Maximum Detection Maximum Detection
 Range (50%) Range (90%)

 28 mm 30.7° 1.80 km 1 km

 65 mm 13.5° 4.16 km 2.33 km

 However, when considering a minimum presented area (side profile),
approximated by a profile of 1m by 0.25m, detection ranges drop considerably, as seen in
Table 7.

 17
Table 7. Assessed IR detection range results for side profile for
 various focal lengths and probability of detection.

 Focal Length FOV Maximum Detection Maximum Detection
 Range (50%) Range (90%)

 28 mm 30.7° 0.73 km 0.41 km

 65 mm 13.5° 1.70 km 0.95 km

 The range of detection in the case of IR sensors is largely a function of the size of
the focal plane array and the trade between focal length and field of view. Larger arrays
with finer pixel sizes, increase both the range and the probability of detection. And longer
focal lengths increase the range of detection while reducing the field of view.

 3. Light Detection and Ranging (LIDAR)

 Light detection and ranging systems are active emitting systems which combine
the benefits of passive infrared red system with active illumination of the target to boost
detectability. These systems use lasers emitting in the SWIR range, with similar arrays to
IR receivers. Expected detection ranges should exceed those for passive IR systems as a
minimum, with signal gains for combined SWIR LIDAR and passive MWIR, rising up to
30 dB [22]. Such gains can overcome significant limitations with passive systems such as
responses at range, during periods of inclement weather or where the threat UAS may be
using coatings to minimize reflections. Commercial systems, such as the OPAL 3D
LiDAR developed by Neptec Technologies, claim ranges up to 1000m [23].

 4. Visual Signature

 The visual detectability of a target is dependent on various factors, including its
size and the contrast presented between the background and the target. The ability to
visually detect an object can be simply summarized by the visual acuity of the observer:

 =
 (10)

 18
where,

 • d is the distance from the object to the observer;

 • w is the width of the object; and,

 • is the visual angle in radians

 Average visual acuity is broadly 1 arcminute for most humans (commonly
referred to as “20/20 vision”). As such, for a target with a profile diameter of 1m, the
maximum distance at which the target can be discerned would be approximately 3448m.
However, this theoretical limit is substantially reduced in reality by atmospheric effects,
lighting, target shape, relative contrast against the background, position in the human
observer’s field of view and relative motion [24] [25]. For example, Lappin et al. note
that visual acuity for moving objects was limited below 0.5°/s - 1°/s for observers
employing peripheral vision or low vision observers. Under such conditions where visual
acuity worsens to 5 arcminutes, the range of sight would decrease to 688m for a 1m
diameter target. Designs employing smaller visual profiles and lower contrast paint
schemes coupled with flight profiles which minimize visual signatures, it can be
concluded, would limit a human observer’s ability to effectively detect and discern a
threat UAS at significant ranges. Moreover, detection can degrade to virtually negligible
in low-light conditions.

 Electro-optical systems employing optical sensors and computer vision can
overcome many of these limitations. Recently fielded systems offer insight into the
performance of such systems. The CM202U Gimbal electro-optical turret is a system that
is integrated with the X-MADIS (Mobile Air Defense Integrated System), developed by
Ascent Vision, for the U.S. Marine Corps. The system asserts a detection range for UAS
based on size and motion of 2–3 km, with the ability to identify and classify small
multicopters at up to 382m [26]. These passive systems can have their performance
substantially improved through supplementation with IR or LIDAR systems.

 19
B. ACOUSTIC SIGNATURE

 Aside from electromagnetic signatures, aircraft can also emit noise that would
impact their detectability. The acoustic signatures of sUAS offer substantial potential for
detectability. Acoustic sensors are composed of passive sensors, usually arrays of
microphones, which can be deployed to detect the minute mechanical displacements of
air caused by pressure variations from rotating, oscillating or vibrating bodies. For most
small, commercial UAS this would be the propeller or rotors used to propel or lift the
aircraft [25]. Acoustic sensing has advantages over exploitation of the electromagnetic
spectrum. Acoustic sensors are passive, not dependent on ambient light (making them
insensitive to diurnal variations) and are typically omnidirectional allowing for the
attainment of complete spherical sensing coverage to be achieved [25].

 Research conducted on the acoustic detection of small commercial UAS indicates
an approximate range of detection of approximately 600m. Harvey and O’Young’s
research at the Memorial University of Newfoundland employed a Delta X-8, a small
electrically powered drone equipped with acoustic sensors mounted on vibration
absorbing mounts, to attempt detection of a gasoline fueled, single engine, 1.5m
wingspan, fixed wing drone [25]. They employed three methods. The “single trial
method” resulted in the longest absolute maximum detection range of 678m with a mean
maximum detection range of 302 m. This method also resulted in a 63% false detection
rate. The other two methods were forms of binary integration which reduced the false
detection rate to under 1%, but also reduced the absolute maximum detection range to
593m and the mean maximum detection range to 258m [25].

 Research was conducted by the U.S. Army Research Lab using man-portable
arrays. Employing algorithms and filtering to discount false detections, the tetrahedral
array employed achieved a 99% probability of detection, at ranges up to 600m, with a 3%
false detection rate [26]. However, the researchers also noted that their tests were
impacted by other aircraft and that acoustic sensing was unlikely to fare well in a
populated environment with several UAS operating at similar frequencies. Interference
could result in rendering the signals incoherent resulting in difficulties tracking the UAS
[26].
 20
C. SENSOR EMPLOYMENT CONCEPT

 To boost the probability of detection, sensors have to be employed in a manner
that favors maximum detection. However, there remain various other factors that drive
design of the sensor employment concept:

 • Cost. Sensors with sufficient resolution to effectively target a small UAS
 through environmental clutter would be expensive.

 • Processing power. Smaller packaged weapons or submunitions have limits
 to how much processing power and battery power can be placed onboard,
 owing to space and thermal considerations.

 • Capability. Smaller weapon or submunitions are limited by antenna or the
 size of the sensor window. By contrast, the nose cone of a missile, or its
 body, has substantially more space for a larger sensor unit. This would
 allow a larger single sensor or the placement of multiple sensors in the
 sensor window, or longer and multiple antennas.

 These factors drive the selection of a sensor employment concept that chooses
between distributing sensors on individual kill vehicles, investing in larger sensors on the
ground or a single centralized airborne platform that could guide several kill vehicles
through to a successful intercept, (e.g., a “targeting hub’). Centralized sensors are
preferred largely because of their favorability on these factors. Centralized sensors, by
virtue of fewer restrictions on size can offer higher capability, greater processing power,
and the opportunity to limit costs by concentrating investment into fewer large sensors.

 Fewer sensors also allows for layering and combination of various sensor systems
into networks to maximize detection under various conditions (lighting, weather, terrain,
distribution, etc.). The combination of fixed or mobile radars with portable passive
electro-optical/IR sensors or LIDARs allows for maximum detection of small UAS
swarms. To effectively target small UAS with individual submunitions while considering
these factors, it is suggested that a targeting hub positioned over the engagement area
would be most suited to intercept a small swarm of low-cost UAS. The small size of

 21
commercial UAS and the materials used to construct them suggest that a LIDAR or
MWIR system onboard would be able to take advantage of secondary emissions from
these aircraft.

 22
IV. AIRCRAFT VULNERABILITY ANALYSIS

 Vulnerability concerns the likelihood of a platform surviving an impact from a
kill mechanism designed to destroy the platform itself or impede its function [14]. In the
survivability equation, vulnerability is denoted as P K|H . To assess vulnerability, a fault
tree analysis and a vulnerable area assessment can be employed (as prescribed by Dr.
Ball). A fault tree analysis lays out the kill chain of critical subsystems which, if broken,
would render the system vulnerable to an attrition kill [14]. In order to determine a
numerical value for vulnerability, a vulnerable area assessment can be employed.

A. CRITICAL COMPONENTS AND KILL MODES

 The subsystems of a UAS can be grouped into two functional groups, detailed in
Table 8, with one group encompassing all systems essential to flight and a second group
essential to the performance of the mission.

 Table 8. Subsystem functional grouping.

 Flight Essential Functions Mission Essential Functions
 Weaponized Payload
 Aerostructure
 Video or data links
 Control Systems
 Targeting systems
 Propulsion
 Battery
 Communications links

 These subsystems have specific technical or functional vulnerabilities,
summarized in Table 9, which represent kill modes that can be used to effect the failure
of flight (resulting in an attrition kill) or mission (representing a mission kill):

 • Aerostructure. Most low-cost commercial UAS are made of low-density
 materials, with the outer structure bearing very limited aerodynamic
 loading. As such, low grain kinetic impacts are unlikely to result in
 catastrophic failure of the aerostructure. Instead, the likely outcome is a
 steady degradation of lift generation, resulting in deterioration of aircraft
 23
manoeuvrability, altitude sustainment and speed sustainment. In further
 analysis, the aerostructure is treated as less critical and considered as the
 total area against which other critical areas were measured.

• Control Systems. The Control Systems functions are accomplished by
 various subsystems including the guidance and navigation systems, flight
 control surfaces and their actuators, and processor systems for autonomous
 operations and flight control. Damage that substantially degrades or
 destroys any of these subs-systems is likely to lead to an attrition kill
 through a loss of control of the aircraft.

• Battery. Power for low-cost drones is most often provided by a battery.
 The battery group usually consists of a battery and its connections to the
 motors. On more sophisticated aircraft, there may be additional electronics
 which provide thermal management of the battery. Interruption of power,
 either by cutting the battery link to the motor or by damage or destruction
 of the battery will result in an immediate attrition kill through loss of
 thrust and/or loss of control of the aircraft.

• Propulsion. The propulsion group usually includes the electric motor,
 driveshaft and propeller. Most of these components are not redundant.
 And damage to any of these components will result in loss of thrust and a
 subsequent attrition kill.

• Communications, Video and Data Links. Backhaul communications links
 may be required for control of the aircraft or to initiate payload release or
 counter enemy defensive actions. Severing communications links will
 only result in an attrition kill if the aircraft is wholly dependent on remote
 control for direction. Aircraft can however, be outfitted and programmed
 to operate autonomously. This would render any loss of communications
 less relevant. Severing communications links could result in an attrition
 kill, but a mission kill is far more likely. In the event that the aircraft is

 24
You can also read