Municipal Solid Waste Collection: Challenges, Strategies and Perspectives in the Optimization of a Municipal Route in a Southern Mexican Town
←
→
Page content transcription
If your browser does not render page correctly, please read the page content below
sustainability

Article
Municipal Solid Waste Collection: Challenges, Strategies and
Perspectives in the Optimization of a Municipal Route in a
Southern Mexican Town
Viridiana Del Carmen-Niño 1 , Ricardo Herrera-Navarrete 2 , Ana Laura Juárez-López 2, *,
María Laura Sampedro-Rosas 2 and Maximino Reyes-Umaña 2

                                          1   School of Sustainable Development, Autonomous University of Guerrero, Carretera Nacional
                                              Acapulco-Zihuatanejo km 106+900, Colonia Las Tunas, Tecpan de Galeana 40900, Guerrero, Mexico
                                          2   PhD in Environmental Sciences, Regional Development Sciences Center, Autonomous University of Guerrero,
                                              Calle Privada de Laurel No. 13, Colonia El Roble, Acapulco 39640, Guerrero, Mexico
                                          *   Correspondence: aljuarez@uagro.mx

                                          Abstract: Solid waste management represents a challenge for municipalities, particularly at the
                                          collection stage. The high costs involved in its operation make it difficult to provide the service
                                          in all its communities, which results in bad practices (burning, burying, or dumping into a river)
                                          and the proliferation of open dumps. Collection efficiency is aggravated by poor route planning,
                                          narrow road networks, and irregular scheduling. This research proposes and develops the following
                                          objectives: (1) an analysis of the technical and logistical conditions of a town, (2) an improved
                                          municipal route for waste collection, and (3) the practical implications identified in the optimization
Citation: Del Carmen-Niño, V.;
                                          of the service (challenges, strategies, and perspectives). During the study period (2018, 2019 and
Herrera-Navarrete, R.; Juárez-López,      2021), the following steps were carried out: (1) field trips to monitor the formal and informal routes,
A.L.; Sampedro-Rosas, M.L.;               georeferencing each stop with a global positioning system, (2) semi-structured interviews to route
Reyes-Umaña, M. Municipal Solid           personnel to learn about technical and logistical aspects, (3) the downloading of cartographic data for
Waste Collection: Challenges,             digitization, and (4) a network analysis aimed at designing an optimal route for formal collection
Strategies and Perspectives in the        and the spatial scope of the informal routes. The current technical and logistical analysis detected
Optimization of a Municipal Route in      inefficiency in collection due to weak municipal operational planning and the irregular frequency
a Southern Mexican Town.                  of visits to the locality. The locality produces an average of 2.8 tons per day and its largest volume
Sustainability 2023, 15, 1083. https://
                                          is organic waste (68.3%), followed by non-recyclable inorganic waste (21.2%), and recyclable waste
doi.org/10.3390/su15021083
                                          (10.5%). In terms of results for the optimization of the municipal collection route, it is estimated
Academic Editors: Marco Ragazzi,          that there will be an improvement in the time of the day of approximately 2 h less, going through
Ioannis Katsoyiannis, Elena Magaril,      95 points when its schedule is 60 collection points, while the distance factor does not suffer changes
Elena Rada, Gabriela Ionescu,             due to the fact that there are no alternate routes between the departure and destination route. Among
Marco Schiavon, Paolo Viotti,
                                          the main challenges faced by the municipalities are the limited budgets for basic sanitation services,
Hussain H. Al-Kayiem and
                                          which is why technological strategies and trained human resources are required for better municipal
Natalia Sliusar
                                          solid waste management. From a technical perspective, geographic information systems are a current
Received: 3 November 2022                 trend to model and optimize service routes, with which a better scenario can be proposed. From a
Revised: 26 December 2022                 social perspective, community participation works as a key factor to carry out activities focused on
Accepted: 3 January 2023                  finding solutions to the problems related to municipal solid waste management.
Published: 6 January 2023

                                          Keywords: town; municipal collection; GIS; route optimization; network analysis

Copyright: © 2023 by the authors.
Licensee MDPI, Basel, Switzerland.
                                          1. Introduction
This article is an open access article
distributed under the terms and                The worldwide population growth and production and consumption activities in-
conditions of the Creative Commons        crease the generation of municipal solid waste (MSW), so its collection represents a serious
Attribution (CC BY) license (https://     socio-environmental problem [1,2]. In this sense, Saja et al. [3] point out that municipal solid
creativecommons.org/licenses/by/          waste management (MSWM) is a challenge for municipal authorities, mainly in developing
4.0/).                                    countries due to the constant increase in waste generation, the high costs of operation, the

Sustainability 2023, 15, 1083. https://doi.org/10.3390/su15021083                                     https://www.mdpi.com/journal/sustainability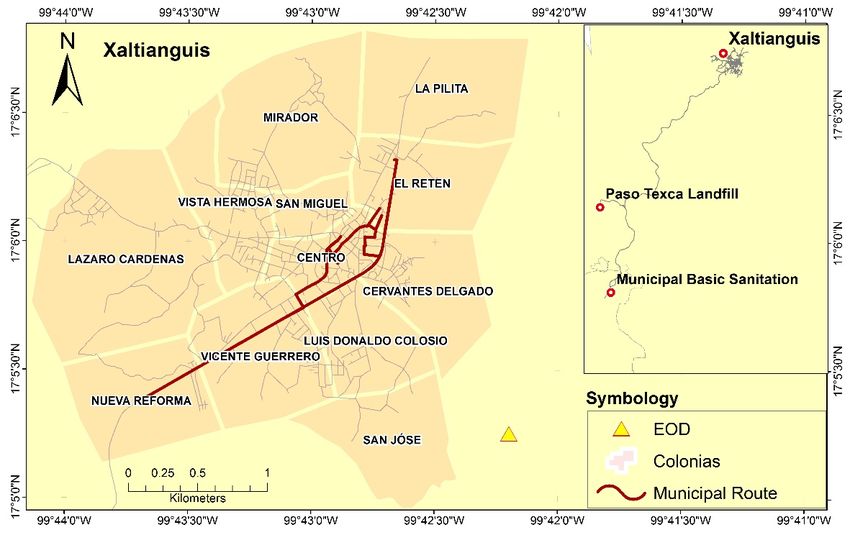
Sustainability 2023, 15, 1083                                                                                             2 of 15

                                lack of understanding of the technicalities involved in the process, and a low level of citizen
                                participation. It is important to note that MSWM is linked to the regulations and actions of
                                each region to achieve environmental benefits and resource optimization [4].
                                      According to United Nations data [5], Latin America and the Caribbean generates
                                approximately 10% of global waste. Although its final disposal has improved in recent
                                decades, approximately 145,000 t/day is still destined for open-air dumps, burning, or
                                other inadequate practices. In Mexico alone, up to the year 2000, 30 million tons were
                                produced; in 2015, the amount rose to 53.1 million, an increase of more than 70% in the span
                                of 15 years [6]. On the other hand, municipal governments present budget limitations, in
                                addition to a lack of reliable information, which limits decision-making and the formulation
                                of stricter public policies [7].
                                      Mexican legislation establishes in Article 115 of the Mexican Constitution that munic-
                                ipalities are responsible for the collection of urban solid waste. The General Law for the
                                Prevention and Integral Management of Waste and the General Law for Ecological Equilib-
                                rium and Environmental Protection derive from this law, which establishes actions related
                                to waste management that must be adapted to the conditions and needs of each place and
                                allow compliance with Mexican Official Standards to achieve the objectives of valorization,
                                and sanitary, environmental, technological, economic and social efficiency [8,9].
                                      It is important to note that, in addition to the formal MSWM system, there is an
                                informal system that operates as an essential part of the service, whose operation can be
                                beneficial. Despite being considered a competitor that carries out activities that are not
                                financed, recognized, supported, or organized by the formal authorities in charge of the
                                public service [10], this sector plays an important role in the recovery of waste, which
                                contributes to mitigating the negative environmental impacts [11].
                                      This type of problem becomes more severe the farther away the localities are from
                                the municipal capital. In these areas, which can even go to the extreme of completely
                                lacking the service, open dumps are formed, generally in ravines or land surrounded by
                                agricultural crops; it is also common for waste to be buried in pits made by the community
                                or burned in the open air [8,12]. On the other hand, in the case of the towns that do have a
                                collection service, the operational problems they face are different: narrow roads restrict
                                the possibility of large vehicles passing, and, for this reason, manual operations must be
                                carried out, an activity that increases costs [13].
                                      In this context, it is feasible to use a geographic information system (GIS) as a strategy
                                to optimize collection times and reduce costs on routes. GIS is a powerful tool for handling,
                                storing, managing, and analyzing large spatial data sets from a variety of sources [14]. For
                                example, Gallardo et al. [15] used GIS to design MSW collection routes and generate a
                                municipal management plan. Araiza and José [16] showed, in their study, the importance
                                of spatial analysis for the improvement in the waste collection stage in two localities
                                in Chiapas, Mexico, using GIS. According to Hoke and Yalcinkaya [17], several studies
                                have opted for route optimization through GIS models for optimal routing and container
                                reallocation, as well as non-homogeneous vehicle-routing models for the optimization of
                                MSW collection.
                                      In this regard, technology is a complement to achieve efficient MSW management.
                                Therefore, this research analyses the technical and logistical conditions of a town and
                                proposes an improved municipal route for waste collection while identifying the practical
                                implications in the optimization of the service (challenges, strategies and perspectives).
                                Although the issue of optimizing waste collection routes in urban complexes has already
                                been studied, its analysis is considered relevant in contexts far from municipal centers,
                                where open-air dumps commonly proliferate. While other studies present scenarios of
                                the best alternative route, this one seeks to improve service times due to the lack of
                                alternative roads.
                                      While it must be recognized that a high number of years of accumulated experience
                                and knowledge produces benefits in MSWM, it is also important to emphasize that there
                                is still much to be done to increase the performance of the system and reduce costs [17].
best alternative route, this one seeks to improve service times due to the lack of alternative
roads.
While it must be recognized that a high number of years of accumulated experience
Sustainability 2023, 15, 1083 and knowledge produces benefits in MSWM, it is also important to emphasize that there 3 of 15
is still much to be done to increase the performance of the system and reduce costs [17].
However, there is a need at the national level to compile the existing information of this
type and produce new data, but a major gap in MSWM in Mexico is the lack of reliable
However, there is a need at the national level to compile the existing information of this
information [7]. This research is of great relevance because the method allowed us to an-
type and produce new data, but a major gap in MSWM in Mexico is the lack of reliable
alyze, from a spatial perspective, the technical and logistical conditions of both formal and
information [7]. This research is of great relevance because the method allowed us to
informal routes, which could help to improve MSWM, mainly in localities far from the
analyze, from a spatial perspective, the technical and logistical conditions of both formal
municipal capital,
and informal where
routes, the collection
which could helpservice is not very
to improve MSWM,efficient dueintolocalities
mainly unreliablefarmu-
from
nicipal management.
the municipal capital, where the collection service is not very efficient due to unreliable
municipal management.
2. Materials and Methods
2. Materials andhas
This research Methods
a mixed design (quantitative and qualitative) and includes a spatial
analysis andresearch
This a series has
of interviews. To carry
a mixed design out the spatial
(quantitative analysis, theand
and qualitative) following
includes supplies
a spatial
were used:and
analysis topographic
a series ofcharts from the
interviews. database
To carry out ofthethe National
spatial Institute
analysis, of Statistics
the following and
supplies
Geography
were used:intopographic
Mexico [18],chartsvalue-added
from the data fromofthe
database theOpen Spatial
National Data Infrastructure
Institute of Statistics and
[19], referenceinpoints
Geography Mexicofrom [18],avalue-added
global positioning
data from system (GPS),
the Open and Data
Spatial the network analysis
Infrastructure [19],
tool of the ArcGIS software version 10.5. It should be noted that this
reference points from a global positioning system (GPS), and the network analysis tooltool has been useful
forofthe
theoptimization
ArcGIS software of transportation
version 10.5. routes
It shouldandbeenables the generation
noted that this tool hasofbeen
optimal
usefulsce-for
narios. ArcGIS has proven
the optimization to be effective,
of transportation routeseasy
andtoenables
use, and time-saving
the generationinofthe field ofscenarios.
optimal traffic
engineering
ArcGIS hasand transportation
proven planning
to be effective, [20].
easy toInuse,
addition, network analysis
and time-saving in thequantifies ac-
field of traffic
engineering
cessibility, flow, andor transportation planning
efficiency to predict [20]. phenomena,
multiple In addition, network analysis quantifies
such as transportation be-
accessibility,
havior, land-useflow, or efficiency
change and healthto[21].
predict multiple phenomena, such as transportation
behavior, land-use change and health [21].
2.1. Description of the Study Area
2.1. Description of the Study Area
The research was conducted in Xaltianguis, a town located about forty kilometers
away fromThe research
its municipalwas conducted in Xaltianguis,
administrative a towndelocated
capital, Acapulco Juárez,about forty(Figure
Guerrero kilometers
1).
away from its municipal administrative capital, Acapulco de Juárez, Guerrero
It is classified as urban because of its population size of 6564 inhabitants [22]. It is located (Figure 1). It
is classified
northwest as urban between
of Acapulco because parallels
of its population
17°05′58″ size
northof latitude
6564 inhabitants [22]. Itwest
and −99°42′51″ is located
lon-
northwest of Acapulco between parallels 17 ◦ 050 5800 north latitude and −99◦ 420 5100 west
gitude of the prime meridian and at an altitude of 533 m above sea level [22]. It is consid-
longitude
ered of with
a locality the prime
a low meridian and at an altitude
social backwardness of 533measures
index, which m above four
sea level
main[22].indica-It is
considered
tors: educationala locality with a low
backwardness, social
access to backwardness
health services,index,accesswhich measures
to basic services four main
in hous-
indicators: educational backwardness, access to health services, access to basic services in
ing, and housing quality and space [23].
housing, and housing quality and space [23].
Figure 1. Location of the study area divided into twelve colonias.
Figure 1. Location of the study area divided into twelve colonias.
According to Del Carmen-Niño et al. [24], the municipality is made up of twelve
colonias: Centro, Cervantes Delgado, El Retén, El Mirador, Lázaro Cárdenas, Luis Donaldo
Colosio, Nueva Reforma, Vicente Guerrero, Vista Hermosa, La Pilita, San José and San
Miguel (Figure 1). It is important to mention that the waste collection service depends on
Acapulco, which is a popular beach resort with high and low tourist seasons. Due to the
city’s economic dependence on this activity, there is a policy of prioritizing the provision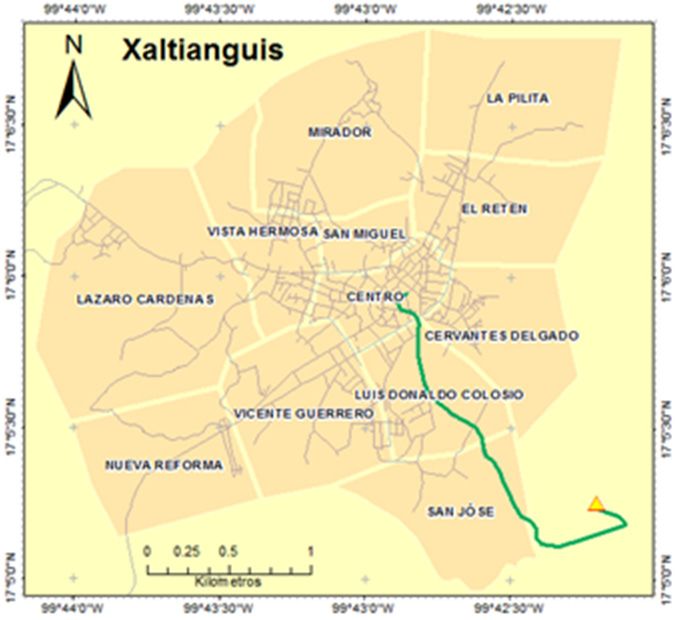
According to Del Carmen-Niño et al. [24], the municipality is made up of twelve co-
lonias: Centro, Cervantes Delgado, El Retén, El Mirador, Lázaro Cárdenas, Luis Donaldo
Colosio, Nueva Reforma, Vicente Guerrero, Vista Hermosa, La Pilita, San José and San
Miguel (Figure 1). It is important to mention that the waste collection service depends on
Sustainability 2023, 15, 1083 Acapulco, which is a popular beach resort with high and low tourist seasons. Due to the 4 of 15
city’s economic dependence on this activity, there is a policy of prioritizing the provision
of public services to visitors, although this situation may lead to a decrease in attention to
certain areasservices
of public of the municipality [25].
to visitors, although this situation may lead to a decrease in attention to
certain areas of the municipality [25].
2.2. Data Collection
2.2.The
Data Collection
first step was to conduct several field trips during 2018 and 2019 along the formal
and informal
The firstroutes to identify
step was the several
to conduct collection points,
field calculate
trips during theand
2018 number of stops
2019 along and
the formal
estimate the service
and informal routestime. Next, between
to identify November
the collection andcalculate
points, Decemberthe2021,
number the of
collection
stops and
points of thethe
estimate formal
service route
time.were updated
Next, between through a global
November andpositioning
Decembersystem
2021, the(GPS Gar-
collection
min Etrexof10).
points theAt the same
formal route time,
weresemi-structured
updated through interviews were applied
a global positioning to both
system informal
(GPS Garmin
and municipal
Etrex 10). Atvehicle
the same operators to learn about technical
time, semi-structured interviews andwere
logistical aspects.
applied to bothA total of
informal
142and
collection
municipal points wereoperators
vehicle identifiedtoduring 2018 and
learn about 2019 and
technical surveys, and 270
logistical collection
aspects. A total
points
of 142were identified
collection in 2021.
points wereThe optimization
identified duringwas 2018performed on the latter
and 2019 surveys, and points (Fig-
270 collection
urepoints
2). Subsequently,
were identified topographic
in 2021. information
The optimizationwas obtained from theon
was performed INEGI platform,
the latter points
(Figure 2). Subsequently, topographic information was obtained from
which contains the coordinates of the study area, points of interest, and main and second- the INEGI platform,
arywhich
roadscontains the coordinates
of the locality of the
in Shapefile study[18].
format area,The
points
fieldofinformation
interest, andand
main theand secondary
digitaliza-
roads
tion of the
of the locality ininformation
topographic Shapefile formatallowed[18].us
The
to field information
obtain andwhich
vector data, the digitalization
formed the of
the topographic
database, and was information
the main input allowed
for theusnetwork
to obtainanalysis.
vector data, which formed the database,
and was the main input for the network analysis.
Figure 2. Waste collection points obtained by GPS.
Figure 2. Waste collection points obtained by GPS.
2.3. Network Analysis Using a GIS
2.3. Network Analysis Using
GIS technology has abeen
GIS widely adopted as a promising approach to automate the
planning process in
GIS technology waste
has beenmanagement, as itas
widely adopted can contain spatial
a promising attribute
approach data that the
to automate allow
digitizing the object and its attributes effectively with geographic accuracy
planning process in waste management, as it can contain spatial attribute data that allow [26]. In this
context, ArcGIS with its network analysis extension is a GIS that allows users to
digitizing the object and its attributes effectively with geographic accuracy [26]. In this dynamically
modelArcGIS
context, realisticwith
network conditions,
its network including
analysis turning
extension is a restrictions, speed
GIS that allows limits,
users and traffic
to dynami-
conditions [20].
cally model realistic network conditions, including turning restrictions, speed limits, and
Network analysis
traffic conditions [20]. is a complex process that must combine social, environmental, and
technical aspects [27], as well as consider the travel restrictions and geographical conditions
in some areas. This important task involves processing a large amount of geospatial data
that, in some cases, must be digitized for proper operation. To carry out this network
analysis, the attributes considered by Yachai et al. [28] were taken into account, adding
others that were considered essential for the process:
• Impedance. The measurement, which may include distance, time, or speed of multiple
trips per distance. The optimal path should be the one with the lowest impedance,
which results in the lowest cost route in time or distance.
data that, in some cases, must be digitized for proper operation. To carry out this network
analysis, the attributes considered by Yachai et al. [28] were taken into account, adding
others that were considered essential for the process:
• Impedance. The measurement, which may include distance, time, or speed of multi-
Sustainability 2023, 15, 1083 ple trips per distance. The optimal path should be the one with the lowest impedance, 5 of 15
which results in the lowest cost route in time or distance.
• Capacity. The maximum number of people or units that the facility can attend, con-
• tain, or assign.
Capacity. The maximum number of people or units that the facility can attend, contain,
• Solid
or waste departure and destination. The location of the starting point and desti-
assign.
• nationwaste
Solid of thedeparture
solid wastesandwill allow a more
destination. The defined
locationroute
of thetostarting
be drawn andand
point takedesti-
into
account the times of attention for their departure.
nation of the solid wastes will allow a more defined route to be drawn and take into
• Start andthe
account end of day.
times It allowsfor
of attention thetheir
programming
departure. of the first visit after the start time
• established
Start and end forofthe
day.activity;
It allowshowever, the end ofofdaytime
the programming the firstdoes
visit not
afterrepresent a re-
the start time
striction to continue the activity.
established for the activity; however, the end of daytime does not represent a restriction
to continue the activity.
2.3.1. Create Network Dataset
2.3.1.The
Create Network
dataset Dataset from the road network, which contains the links, path-
was generated
ways,The dataset
and was generated
junction points. Thefromnetwork
the road dataset
network,waswhich contains
created the links,
with pathways,
geodatabase in
and junction points. The network dataset was created with geodatabase in
ArcCatalog. The distance of the road network for this analysis is 69.50 km. The road net- ArcCatalog.
The
work distance of the
considers theroad network
location of thefor this analysis
town, is 69.50
final disposal km.
site, andThe roadwhere
depot network theconsiders
units are
the
keptlocation of the
overnight andtown,
from final
wheredisposal site, and
they depart depot
(Figure 3).where
All datathewere
unitsprojected
are kept in
overnight
Univer-
and from whereMercator
sal Transverse they depart (Figure
(UTM) zone3).14N
Allusing
data were projected
the Web in Universal
Mercator Coordinate Transverse
System,
Mercator
WGS 1984. (UTM) zone 14N using the Web Mercator Coordinate System, WGS 1984.
Figure 3. Solid waste management system: Xaltianguis operation model. Source: own elaboration.
2.3.2.
2.3.2. GIS
GIS constraints
constraints and
and analysis
analysis
The
The software has the capability
software has the capability to
to determine
determine constraints
constraints through
through barriers
barriers along
along the
the
path.
path. However, this study excluded critical constraints to the waste collection routes;
However, this study excluded critical constraints to the waste collection routes; it
it
only
only considered
considered the
the following
following criteria:
criteria:
1.
1. All roads
All roads are
are two-way.
two-way. However,
However,some somestreets
streetsinin
thethe communities
communities areare difficult
difficult to
to access.
access.
2. The travel speed is slower in the community, ranging between 40 and 60 km/h.
2. The travel speed is slower in the community, ranging between 40 and 60 km/h.
3. The official final disposal site (landfill) has a slow internal access (dirt road); therefore,
3. The official final disposal site (landfill) has a slow internal access (dirt road); there-
entry and unloading times take approximately 45 min and are considered in the
fore, entry and unloading times take approximately 45 min and are considered in the
route times.
route times.
3. Results
3.1. Waste Management System
Figure 3 shows the operation of MSW management in Xaltianguis. It is restricted to
the collection and disposal of the waste generated; a simple management system, usually
applied at the locality level in accordance with Mexican regulations [9]. Other management
practices for waste disposal were also identified, such as waste burning, the collection of
recyclable inorganic waste, and composting of organic waste, as well as the potential for
population participation in waste management. It is estimated that Xaltianguis generates
2.8 t/d of waste, of which 68.3% is organic and the rest is inorganic [29].
It is important to note that in this town, there is an Ejidal open dump (EOD) where
waste is disposed of by an informal collection system and by some inhabitants without any
type of environmental control or regulation. In addition, there are other open dumps thattial for population participation in waste management. It is estimated that Xaltianguis
generates 2.8 t/d of waste, of which 68.3% is organic and the rest is inorganic [29].
It is important to note that in this town, there is an Ejidal open dump (EOD) where
waste is disposed of by an informal collection system and by some inhabitants without
any type of environmental control or regulation. In addition, there are other open dumps
Sustainability 2023, 15, 1083 6 of 15
that operate clandestinely, (located on the banks of the Xaltianguis River. This river runs
across the town and supplies the population with drinking water. There are also open
dumps in ravines or on land surrounded by agricultural crops, where the intentional
operate clandestinely,
burning (located
of waste by the on the persists,
population banks of generating
the Xaltianguis River. and
pollution Thisaffecting
river runshuman
across
the town
health. and supplies the population with drinking water. There are also open dumps
in ravines or on land surrounded by agricultural crops, where the intentional burning of
waste by the population
3.2. Collection Service persists, generating pollution and affecting human health.
3.2.1. Formal Service
3.2. Collection Service (Municipal)
3.2.1.InFormal
2018 and 2019,(Municipal)
Service the provision of a formal service for the collection of solid waste in
the locality was carried
In 2018 and 2019, the out provision
by municipalof a basic
formal sanitation
service formanagement
the collection(BSM). Thiswaste
of solid servicein
performs mixed collections of solid waste, that is, without any separation.
the locality was carried out by municipal basic sanitation management (BSM). This service The operation
of this formal
performs mixedroute combined
collections the methods
of solid waste, thatof is,
fixed stopsany
without on secondary
separation.streets and side-
The operation of
walks on main
this formal routestreets.
combinedAnother important
the methods of point is thatonthe
fixed stops arrival ofstreets
secondary tourists
andduring the
sidewalks
holiday
on mainseasons
streets. also
Anotheraffects the service,
important pointgiven
is that that,
the under
arrivalthese conditions,
of tourists duringthey can be
the holiday
removed from the locality for two or even three weeks to cover the
seasons also affects the service, given that, under these conditions, they can be removed tourist area.
fromOn thethe otherfor
locality hand,twothe assignment
or even of trucks
three weeks for the
to cover theroutes
touristdoes
area.not consider the ter-
rain conditions
On the other or hand,
type ofthevehicle. A side-loading
assignment of trucks for truck
the without
routes doescompaction withthe
not consider a capac-
terrain
ity of six tons
conditions (t) is of
or type used on a A
vehicle. single established
side-loading truck route. The compaction
without staff consists of aa driver
with capacityandof
one or two
six tons helpers
(t) is used on who are tipped
a single USD 0.25–0.50
established route. The bystaff
families. Waste
consists of a collection
driver andrarely
one ortook
two
place
helpers in who
the mornings;
are tipped USD it usually began
0.25–0.50 at 2:00 PM
by families. Wastewhen most ofrarely
collection the educational
took place inand the
health
mornings;institutions
it usually had already
began closed
at 2:00 their most
PM when doors, ofsotheplaces with high
educational and concentrations
health institutions of
people hardlyclosed
had already ever received the service.
their doors, The
so places municipal
with collection service
high concentrations disposes
of people of waste
hardly ever
received
in the service.
the municipal The landfill
sanitary municipal collection
(Figure service
4), which disposes
is the of waste
only official sitein the municipal
available to the
sanitary landfill (Figure 4), which is the only official site available to the municipality.
municipality.
Figure 4. Current coverage of the municipal waste collection route.
The 2021 collection method was similar to that of 2018 and 2019, that is, sidewalks and
fixed stops, but the collection frequency was sometimes twice a week, while in 2018 and
2019, it was once a week. It should be noted that such a frequency is complied with as long
as the municipal collection vehicle does not present mechanical failures or is designated to
the tourist area. In 2021, the collection was performed on Mondays and Thursdays, on a
schedule from 8:00 to 17:00 h (9.0 h), with an average of 60 stops per day. This frequency
may decrease for the aforementioned reasons, then the town remains unattended. The
collection service for Xaltianguis is carried out by two trucks and two different drivers, one
for each day. On Mondays, the following colonias are attended to: Nueva Reforma, Las
Flores, Vicente Guerrero, Cervantes Delgado, El Retén, Luis Donaldo Colosio and Centro;
on Thursdays, the following colonias are attended to: Nueva Reforma, Centro, San Miguel,
Vista Hermosa, Vicente Guerrero and Luis Donaldo Colosio (Table 1). Thus, nine colonias
are currently covered, while in 2019, only six of them were attended.Sustainability 2023, 15, 1083 7 of 15
Table 1. Coverage of waste collection service by colonias using formal and informal routes.
Informal Informal Informal Informal
Municipal
Colonia Route Route Route Route
Route
1 2 3 4
Centro X X X X X
Lázaro Cárdenas
El Reten X X X
Vista Hermosa X X
Vicente Guerrero X X X
La Pilita
Nueva Reforma X X X
San Miguel X
San José
Luis Donaldo
X X X
Colosio
Cervantes Delgado X X X
El Mirador
Total 6 6 3 8 1
Note: X = Presence of the route in the colonia. Source: own elaboration with data obtained in the field.
3.2.2. Informal Service
The informal collection service (IS) in Xaltianguis in 2018 and 2019 consisted of four
private vehicles, which were independent of each other (Table 2). Despite having particular
logistics, they conducted improvised collection routes. This sector provided the service
daily, prioritizing collection in the center of town, in contrast to the formal BSM collection,
which was twice a week. With reference to the information presented in Table 2, informal
routes 1, 2 and 3 carried out the intradomiciliary collection method (take and bring),
with the exception of informal route 4, which only collected from the central market of
the locality.
Table 2. Description and capacity of vehicles in the informal waste collection sector.
Vehicle Vehicle
Route Number Volume of Waste (m3 ) Quantity kg/vehicle
Characteristics Dimensions (meters)
1 Ford Ranger XLT Mod. 92 L 2.18 × W 1.50 × H 1.51 4.93 987.54 *
2 Mazda 2200 Mod. 88 L 1.89 × W 1.59 × H 1.27 3.81 763.28 **
3 Nissan Mod.93 L 1.92 × W 1.54 × H 1.00 2.95 591.36 ***
4 Ford Ranger Mod. 94 L 2.15 × W 1.42 × H 1.40 4.27 854.84 *
Total MSW collected (kg/day): 5143.02
Note: Mod. = model, L = length, W = width and H= height. * one trip/day, ** two trips/day, *** and three
trips/day. Source: own elaboration with data obtained in the field.
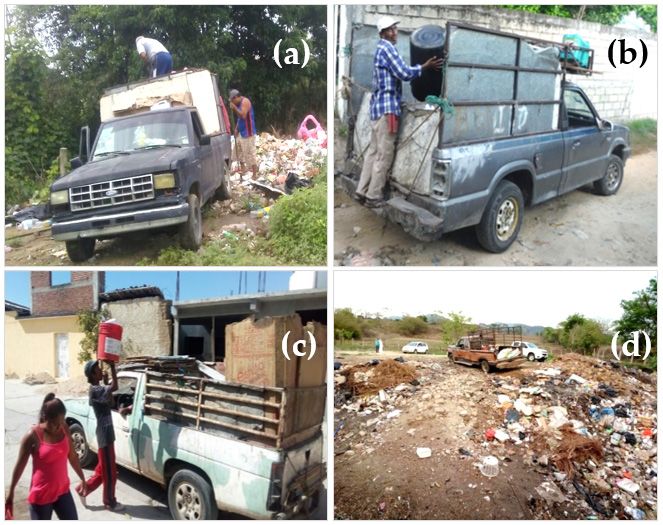
The IS vehicles had their own logistics but did not ensure total coverage due to the fact
that the colonias far from the center of the locality (Figure 5), such as Lázaro Cárdenas, La
Pilita, El Mirador and San José, represent higher fuel consumption and cost and, therefore,
less income, and some areas have streets that present an inaccessible topography. The
service fee was different for each route, ranging from USD 0.50 to 1. The vehicles are
non-conventional and without compaction, specifically the pick-up trucks (Figure 6). The
collection frequency of informal routes 1, 2 and 3 was daily; only route 4 was twice a week.
The informal collection routes covered only eight colonias, so four colonias did not have
MSW collection; these were Lazaro Cardenas, El Mirador, La Pilita and San Jose (Table 1).fact that the colonias far from the center of the locality (Figure 5), such as Lázaro Cárdenas,
La Pilita, El Mirador and San José, represent higher fuel consumption and cost and, there-
fore, less income, and some areas have streets that present an inaccessible topography.
The service fee was different for each route, ranging from USD 0.50 to 1. The vehicles are
non-conventional and without compaction, specifically the pick-up trucks (Figure 6). The
Sustainability 2023, 15, 1083 collection frequency of informal routes 1, 2 and 3 was daily; only route 4 was twice
8 of 15a week.
The informal collection routes covered only eight colonias, so four colonias did not have
MSW collection; these were Lazaro Cardenas, El Mirador, La Pilita and San Jose (Table 1).
(a) (b)
(c) (d)
Sustainability 2023, 15, x FOR PEER REVIEW Figure
Figure 5. Coverage 5. Coverage
of informal of informal
waste waste
collection collection
routes. (a) routes. (a) Informal
Informal route 1, route 9 of route
1, (b) informal
(b) informal route 16
2, 2,
(c) informal route 3, and (d) informal route 4.
(c) informal route 3, and (d) informal route 4.
Informalservice
Figure 6. Informal servicevehicles
vehiclesfor
forwaste
wastecollection.
collection.(a)(a) Informal
Informal route
route 1, 1,
(b)(b) informal
informal route
route 2, 2,
(c) informal route 3 and (d) informal route
route 4.
4.
The informal collection service currently consists of two pick-up trucks, with impro-
vised routes and schedules; they provide services to colonias that have been served since
2019. Such routes were not geo-referenced to the present because the IS indicated not to
modify the previous routes; these routes are shown in Figure 5.Sustainability 2023, 15, 1083 9 of 15
The informal collection service currently consists of two pick-up trucks, with impro-
vised routes and schedules; they provide services to colonias that have been served since
2019. Such routes were not geo-referenced to the present because the IS indicated not to
modify the previous routes; these routes are shown in Figure 5.
Figure 6 shows the informal collection of Xaltianguis, carried out in 2018 and 2019,
where four vehicles operated (a–d). In 2021, only two vehicles (a,b) continue to work due
to the increased frequency of the collection of the BSM.
3.3. Route Optimization
Figure 7 presents a proposal for waste collection to optimize the municipal route
service. The network analysis tool suggests an optimal scenario that consists of the design
of a logical and efficient route that allows a series of criteria set out for the needs of the
project to be met. In this case, time and distance were considered as impedance, in addition
Sustainability 2023, 15, x FOR PEER REVIEW 10 of 16
to the other criteria described in Table 3. The municipal route has little service coverage; it
has a reduced frequency of home visits, so the service is affected.
Figure 7.
Figure 7. Optimization of the
Optimization of the municipal
municipal route
route to
to the
the landfill.
landfill. Source:
Source: own
own elaboration.
elaboration.
Table 3.
Table 3. Attributes
Attributes of
of the
the optimized
optimized municipal
municipal route
route vs.
vs. current
current municipal
municipal route.
route.
Field Municipal Route Optimized Route
Field Municipal Route Optimized Route
ObjectID 1 1
ObjectID 1 1
Name
Name Route
Route0101 Route
Route0202
Description
Description Waste Collection
Waste Collection Waste
WasteCollection
Collection
StartDepotName
StartDepotName Municipal Basic
Municipal BasicSanitation
Sanitation Municipal
MunicipalBasic
BasicSanitation
Sanitation
EndDepotName
EndDepotName Paso Texca Landfill
Paso Texca Landfill Paso Texca Landfill
Paso Texca Landfill
StartDepotServiceTime 1 1
StartDepotServiceTime 1 1
EndDepotServiceTime 1 1
EndDepotServiceTime
CostPerUnitTime 1 1 11
CostPerUnitTime
MaxOrderCount 1 60 195
OrderCount
MaxOrderCount 60 60 9595
TotalCost
OrderCount 609.02 7.04
95
RegularTimeCost 9.02 7.04
TotalCost
TotalTime 9.029.02 7.04
7.04
RegularTimeCost
TotalOrderServiceTime 9.024.15 7.04
4.75
TotalDistance
TotalTime 19,450.00
9.02 19,477.95
7.04
Source: own elaboration.
TotalOrderServiceTime 4.15 4.75
TotalDistance 19,450.00 19,477.95
Source: own elaboration.
The trucks spend the night at the SBM’s facilities, 32 km from the town. The trucksSustainability 2023, 15, 1083 10 of 15
The trucks spend the night at the SBM’s facilities, 32 km from the town. The trucks
start at that point, where they will operate for an average of 7.04 h; this covers the workday
in accordance with Mexico’s current labor regulations. Once the truck reaches its load
capacity, it is driven to the municipal sanitary landfill, which has the conditions for the
treatment of MSW. Access to the facilities and the unloading maneuver takes about 45 min,
which is considered in the configuration of the tool, and finally, they go to the BSM where
all the units or trucks are placed.
4. Discussion
4.1. Technical and Logistical Conditions for Waste Collection
Regarding the technical and logistical conditions of waste collection in the locality,
two types of service are described: the formal or municipal route service and the informal
collection system. In this study, the formal route has areas of opportunity with the potential
for improvement, among which the service coverage stands out. However, technical and
logistical complications are also common, among which is the obsolescence of the collection
vehicle fleet, which has not been replaced in a timely manner; in fact, in almost a third of
the country, it is more than 20 years old [7].
As for the informal sector, it supports the municipal collection service, as in other
places such as India (Sharholy et al. [30]) and China (Wang et al. [31]), where informal
sectors positively influence MSWM and sustain its operation through variable tariffs just
as formal routes operate in the provinces of Italy [32]. However, they are rarely within
the legal framework, that is, they operate outside the law. Such is the case in Xaltianguis,
where most of the collection is not recognized by municipal authorities. Xaltianguis is a
town distant from the municipal capital (Acapulco, Mexico), where there is a collection
service. However, it is normal for localities farther away from the municipal capital to lack
the provision of different services [33].
In this regard, Salazar-Adams [8] points out that deficiencies in MSWM are an indi-
cator of other deficiencies in local administrations. Therefore, a municipality incapable of
carrying out effective MSWM will hardly be able to manage more complex public services
such as education, transport, or sanitation, as collection is an essential service that a local
authority is expected to offer to its inhabitants [8]. Although collection is part of MSWM,
the operation and maintenance of the vehicles are considered a process that involves a
higher cost compared to other stages of management [34]. Araiza and José [16] warn that
poor design in micro- and macro-routing can result in serious damage to the collection
system, deterioration of equipment, loss of time, reduced service coverage, increased costs,
and even the proliferation of open dumps.
The optimization of the municipal route improved the service time by 2 h and had
a greater number of stops (35 stops), while the distance had no improvement. Therefore,
time is a determining factor to be considered as a feasible proposal. The study locality
has road and geographic characteristics that affect optimization; a similar situation was
reported by Mukama et al. [35] in Uganda, where MSW collection is currently one of
the most critical public services because it is almost completely unprovided in marginal
areas, and in the cases where it is provided, its coverage is low, which has caused public
complaints. According to Oakley and Jimenez [36], another common practice is the burial
of waste in community pits or the intentional burning of MSW in the open air. The same
happens in Xaltianguis, where the inhabitants with a need to dispose of waste carry out
these inadequate practices without taking advantage of recyclable materials.
4.2. Optimization of the Municipal Waste Collection Route
In this research, a spatial analysis of the MSW collection stage in Xaltianguis was
carried out to formulate an adequate, relevant and viable proposal for waste management.
Among the main challenges that municipalities face, inadequate budgets for basic services
stand out [3], particularly in sanitation, which involves the collection, transport, and final
disposal of MSW. The services of MSW can account for up to 50% of the municipal budget,Sustainability 2023, 15, 1083 11 of 15
mainly this is related to the waste collection phase [5]. In MSWM issues, although the
population plays an essential role in terms of collection, the municipality is responsible for
the design and planning of the routes.
This is the case in the municipality of Acapulco de Juárez, where financial resources
are limited to cover the collection service from 227 localities, among which Xaltianguis is
included [22]. In this sense, Batista et al. [37] point out that few municipalities have an effi-
cient MSWM service, and this situation has become a turning point for local development
and a priority issue in tourist places. Two compactor vehicles have been assigned to the
town, and they alternate their use. They make one trip per day and have the collection area
sectioned for visits twice a week.
In the improvement of the efficiency of MSWM, it is necessary to reduce its associated
costs with the purpose of providing a better quality of service and complying with the
regulatory requirements established both globally and locally [38]. Although strategies
in waste collection and the optimization of a municipal route are perceived as a viable
alternative, Ferronato et al. [39] point out that the scientific literature lacks integrative and
holistic (environmental, economic and management) evaluations of waste collection routes
to increase the service coverage and reduce open dumping.
It has been suggested to use technologies that provide optimal scenarios to help
solve the problem of waste. For this purpose, there are several pieces of GIS software for
performing network analysis, but according to Cárdenas-Moreno et al. [27], ArcGIS is the
most widely used software for waste management studies. In this sense, a study conducted
in Ecuador showed that once the geo-routing proposal has been approved, it is imperative to
carry out a socialization campaign among the inhabitants before implementing it; therefore,
the commitment and work of the institutions related to MSWM and higher education
institutions are fundamental [40].
In Xaltianguis, much of the waste collection is carried out informally, with personnel
who work without salary or legal benefits provided by the municipality; these workers live
on the fees contributed by the population, as well as on the recycling activity, a common
practice carried out in other places to reduce poverty [41]. Future perspectives related to
the improvement of MSWM must be focused in such a way that they adhere to sustainable
practices to ensure a better urban living environment which will increase the economic
productivity of the region, promote direct benefits for public health, and facilitate safe,
dignified and legally protected employment opportunities [3]. It is crucial to note that
urban conditions cause differences in distance or time reduction and can also influence
modifications in weight, impedance or cost [21].
Network analysis can generate the shortest or fastest path of the selected impedance,
and the path of lowest impedance or cost can be interpreted as the best option [28]. On
this subject, Das et al. [20] point out that when distance is considered as impedance, in
many cases, the shortest path in distance does not always imply a reduction in time. It is
important to note that, in this study, steep and unpaved roads with difficult access were
found, and this allowed the expansion of the information obtained from the GIS. These
topographic conditions are part of the reality that generates a variation in the practice of
solid waste management [3].
GIS-based tools allow optimizing routes under a spatial analysis [15–17,34,42]; how-
ever, this study involved the social aspect revealing its current formal and informal man-
agement, in addition to taking into account the conditions of the territory far from the
municipal capital and without alternative routes; these characteristics that make it different
from other studies. This research has a limited scope, determined by the objective, by
proposing only the use of a tool such as GIS, but it can be improved when discussing
other criteria (containers, transfer stations, etc.) related to the waste management system
through mixed integer linear programming models (MILP) or deterministic and stochastic
models to develop an optimization in the municipal solid waste sustainable manage-
ment system [43,44], including models for an integrated supply chain network for MSW
management [45].Sustainability 2023, 15, 1083 12 of 15
4.3. Practical Implications of the Study (Challenges, Strategies and Perspectives)
The main challenges in this study are the lack of information from the responsible
authorities on the volume of waste generated in the study locality, in addition to the
limited financial, technical and logistical resources. Other challenges faced and described
in the literature are the awareness of environmental pollution, social inclusion, technical
knowledge and political will [46]. In this respect, Bernardes and Günther [33] point out
serious repercussions in rural localities due to the lack of essential basic services, which
can seriously affect the living conditions of the population. Such is the case of Xaltianguis,
where, being far from the municipal capital, the collection service implies greater investment
in the BSM’s budget. According to field visits for this case, the collection implies a set
of fixed stops which can last from two to four minutes each, and during the eight-hour
workday, it covers an average of 95 stops; however, the number of stops per day is uneven.
Although an increasing trend in waste generation is expected in the coming years, it
is necessary to integrate public policies that ensure the control of MSW from the source,
strengthened with regulatory mechanisms and directed towards the objectives of sustain-
able development. According to Del Carmen et al. [29], the locality produces an average of
2.8 tons per day, and its largest volume is organic waste (68.3%), followed by non-recyclable
inorganic (21.2%) and recyclable (10.50%) waste. In this regard, Banguera et al. [4] add
that the generation of MSW is exceeding the capacity of being recycled and reused, thus
turning a possible solution into an environmental problem. According to Saja et al. [3], the
waste generated in a community is categorized as agricultural, mining, construction, and
municipal solid. In this regard, it is recommended that integrated management that takes
into account the environmental regulatory framework and addresses strict monitoring
be implemented.
Therefore, a joint effort is sought with authorities, academia, and society to work on
participation at the community level, which makes it possible to avoid social conflicts,
improve the quality of life and develop sustainable practices in communities by proposing
actions for the care of the environment and enabling the search for economic incentives
to strengthen social relations in marginalized communities that require urgent attention
on the issue of solid waste management. In this sense, Liu and Liao [47] point out that
in practice, cooperation is required among recyclable waste collection and transportation
companies as this allows them to improve the management of their resources, meet the
needs of customers or citizens, and contribute to the improvement of environmental quality.
5. Conclusions
The optimization of the municipal waste collection route through the network analysis
tool allowed us to provide a proposal to improve the service in this locality. While in
the current schedule, nine hours are spent making 60 stops with the proposal, the travel
time is reduced to seven hours. The analysis also helped to identify the need to increase
the frequency of collection departures to provide greater coverage along the formal route,
which is currently scheduled for two days a week. If the daily generation is 2.8 tons per
day, a minimum frequency of three departures a week is required.
Regarding informal routes, it is concluded that they are necessary to complement the
collection system. However, it is important that the authorities monitor this service to
ensure that the collected waste actually reaches the place assigned for final disposal and
is not sent to open dumps. Additionally, coordinated collaboration among government
agencies, the informal sector and recycling companies can contribute to greater efficiency
in both the solid waste reduction and collection stages, which can help to improve quality
of life and lead to more environmentally responsible actions. From a social perspective,
involving the locality in activities related to MSWM requires active community participation
to carry out initiatives that provide solutions to MSW problems.Sustainability 2023, 15, 1083 13 of 15
Author Contributions: Conceptualization, V.D.C.-N. and A.L.J.-L.; data curation, V.D.C.-N.; formal
analysis, R.H.-N. and M.R.-U.; investigation, V.D.C.-N.; methodology, R.H.-N. and M.R.-U.; resources,
V.D.C.-N., A.L.J.-L. and M.L.S.-R.; supervision, V.D.C.-N.; validation, A.L.J.-L., M.L.S.-R. and M.R.-U.;
writing—original draft, V.D.C.-N. and R.H.-N.; writing—review and editing, V.D.C.-N., R.H.-N.,
A.L.J.-L., M.L.S.-R. and M.R.-U. All authors have read and agreed to the published version of
the manuscript.
Funding: This research received no external funding.
Institutional Review Board Statement: Not applicable.
Informed Consent Statement: Informed consent was obtained from all subjects involved in the study.
Data Availability Statement: Not applicable.
Conflicts of Interest: The authors declare no conflict of interest.
References
1. Adeleke, O.; Akinlabi, S.A.; Jen, T.C.; Dunmade, I. Application of artificial neural networks for predicting the physical composition
of municipal solid waste: An assessment of the impact of seasonal variation. Waste Manag. Res. 2021, 39, 1058–1068. [CrossRef]
2. Ciuta, S.; Apostol, T.; Rusu, V. Urban and Rural MSW Stream Characterization for Separate Collection Improvement. Sustainability
2015, 7, 916–931. [CrossRef]
3. Saja, A.M.A.; Zimar, A.M.Z.; Junaideen, S.M. Municipal Solid Waste Management Practices and Challenges in the Southeastern
Coastal Cities of Sri Lanka. Sustainability 2021, 13, 4556. [CrossRef]
4. Banguera, L.; Sepulveda, J.M.; Fuertes, G.; Carrasco, R.; Vargas, M. Reverse and Inverse Logistic Models for Solid Waste
Management. S. Afr. J. Ind. Eng. 2017, 28, 120–132. [CrossRef]
5. ONU. Perspectiva de la Gestión de Residuos en América Latina y el Caribe. Available online: https://www.unep.org/es/
resources/informe/perspectiva-de-la-gestion-de-residuos-en-america-latina-y-el-caribe (accessed on 13 September 2022).
6. SEMARNAT. Indicadores Básicos del Desempeño Ambiental-Residuos Sólidos. Available online: https://datos.gob.mx/busca/
dataset/indicadores-basicos-del-desempeno-ambiental--residuos-solidos (accessed on 20 September 2022).
7. SEMARNAT. Diagnóstico Básico para la Gestión Integral de los Residuos. Available online: https://www.gob.mx/cms/uploads/
attachment/file/554385/DBGIR-15-mayo-2020.pdf (accessed on 10 September 2022).
8. Salazar-Adams, A. The efficiency of municipal solid waste collection in Mexico. Waste Manag. 2021, 133, 71–79. [CrossRef]
9. DOF. Artículo 115. Constitución Política de los Estados Unidos Mexicanos. Diario Oficial de la Federación (DOF). Available
online: https://www.supremacorte.gob.mx/sites/default/files/cpeum/documento/2021-02/CPEUM-115.pdf (accessed on 21
November 2022).
10. Guibrunet, L. What is “informal” in informal waste management? Insights from the case of waste collection in the Tepito
neighbourhood, Mexico City. Waste Manag. 2019, 86, 13–22. [CrossRef]
11. Al-Khatib, I.A.; Al-Sari, M.I.; Kontogianni, S. Scavengers’ contribution in solid waste management sector in Gaza Strip, Palestine.
Environ. Monit. Assess. 2020, 192, 354. [CrossRef]
12. Ragazzi, M.; Catellani, R.; Rada, E.C.; Torretta, V.; Salazar-Valenzuela, X. Management of Municipal Solid Waste in One of the
Galapagos Islands. Sustainability 2014, 6, 9080–9095. [CrossRef]
13. Guerrini, A.; Carvalho, P.; Romano, G.; Cunha, R.; Leardini, C. Assessing efficiency drivers in municipal solid waste collection
services through a non-parametric method. J. Clean. Prod. 2017, 147, 431–441. [CrossRef]
14. Yalcinkaya, S.; Kirtiloglu, O.S. Application of a geographic information system-based fuzzy analytic hierarchy process model to
locate potential municipal solid waste incineration plant sites: A case study of Izmir Metropolitan Municipality. Waste Manag.
Res. 2021, 39, 174–184. [CrossRef]
15. Gallardo, A.; Carlos, M.; Peris, M.; Colomer, F.J. Methodology to design a municipal solid waste generation and composition map:
A case study. Waste Manag. 2014, 34, 1920–1931. [CrossRef]
16. Araiza, J.A.; José, M.E. Mejora del servicio de recolección de residuos sólidos urbanos empleando herramientas SIG: Un caso de
estudio. Ingeniería 2015, 19, 118–128.
17. Hoke, M.C.; Yalcinkaya, S. Municipal solid waste transfer station planning through vehicle routing problem-based scenario
analysis. Waste Manag. Res. 2021, 39, 185–196. [CrossRef]
18. INEGI. Topografía. Available online: https://www.inegi.org.mx/temas/topografia/#Descargas (accessed on 15 August 2022).
19. IDEA. Localidades/Localidades del Marco Geoestadístico/Colonias. Available online: https://www.gits.igg.unam.mx/idea/
descarga (accessed on 21 August 2022).
20. Das, D.; Ojha, A.K.; Kramsapi, H.; Baruah, P.P.; Dutta, M.K. Road network analysis of Guwahati city using GIS. SN Appl. Sci.
2019, 1, 906. [CrossRef]Sustainability 2023, 15, 1083 14 of 15
21. Cooper, C.H.V.; Chiaradia, A.J.F. sDNA: 3-d spatial network analysis for GIS, CAD, Command Line & Python. SoftwareX 2020, 12,
100525. [CrossRef]
22. INEGI. Catálogo Único de Claves de Áreas Geoestadísticas Estatales, Municipales y Localidades. Available online: https:
//www.inegi.org.mx/app/ageeml/ (accessed on 30 July 2017).
23. CONEVAL. Población Total, Indicadores, Índice y Grado de Rezago Social, Según Localidad. 2020. Available online: https:
//www.coneval.org.mx/Medicion/IRS/Paginas/Indice_de_Rezago_Social_2020_anexos.aspx (accessed on 10 October 2022).
24. Del Carmen-Niño, V.; Sampedro-Rosas, M.L.; Rodríguez, A.L.; Juárez-López, A.L.; Reyes-Umaña, M.; Silva-Gómez, S.E. Municipal
Solid Waste Management Course: A Case Study in Xaltianguis, Guerrero, México. Int. J. Appl. Environ. Sci. 2018, 13, 787–800.
25. Herrera-Navarrete, R.; Colin-Cruz, A.; Arellano-Wences, H.J.; Sampedro-Rosas, M.L.; Rosas-Acevedo, J.L.; Rodriguez-Herrera,
A.L. Municipal Wastewater Treatment Plants: Gap, Challenges, and Opportunities in Environmental Management. Environ.
Manag. 2022, 69, 75–88. [CrossRef]
26. Cheniti, H.; Cheniti, M.; Brahamia, K. Use of GIS and Moran’s I to support residential solid waste recycling in the city of Annaba,
Algeria. Environ. Sci. Pollut. Res. Int. 2021, 28, 34027–34041. [CrossRef]
27. Cárdenas-Moreno, P.R.; Piña-Guzmán, A.B.; Colomer-Mendoza, F.J.; Carlos Alberola, M.D.M.; Robles-Martínez, F. Evaluation of
Compliance with Regulatory Factors of Waste Disposal Sites by Using Geographical Information Systems, Case of Study: State of
Mexico. Rev. Int. Contam. Ambient. 2019, 35, 1025–1037. [CrossRef]
28. Yachai, K.; Kongboon, R.; Gheewala, S.H.; Sampattagul, S. Carbon footprint adaptation on green supply chain and logistics of
papaya in Yasothon Province using geographic information system. J. Clean. Prod. 2021, 281, 125214. [CrossRef]
29. Del Carmen, V.; Rodríguez, A.L.; Juárez, A.L.; Sampedro-Rosas, M.L.; Reyes-Umaña, M.; Silva-Gómez, S.E. La importancia de la
participación y corresponsabilidad en el manejo de los residuos sólidos urbanos. Acta Univ. 2019, 29, 1–16. [CrossRef]
30. Sharholy, M.; Ahmad, K.; Mahmood, G.; Trivedi, R.C. Municipal solid waste management in Indian cities—A review. Waste
Manag. 2008, 28, 459–467. [CrossRef]
31. Wang, J.; Han, L.; Li, S. The collection system for residential recyclables in communities in Haidian District, Beijing: A possible
approach for China recycling. Waste Manag. 2008, 28, 1672–1680. [CrossRef] [PubMed]
32. Rada, E.C.; Zatelli, C.; Cioca, L.I.; Torretta, V. Selective Collection Quality Index for Municipal Solid Waste Management.
Sustainability 2018, 10, 257. [CrossRef]
33. Bernardes, C.; Günther, W.M.R. Generation of Domestic Solid Waste in Rural Areas: Case Study of Remote Communities in the
Brazilian Amazon. Hum. Ecol. 2014, 42, 617–623. [CrossRef]
34. Putra, A.H.; Amalia, A.; Putro, R.K.H.; Darmayani, L.F. Waste Transportation Route Optimization in Malang using Network
Analysis. IOP Conf. Ser. Earth Environ. Sci. 2020, 506, 012033. [CrossRef]
35. Mukama, T.; Ndejjo, R.; Musoke, D.; Musinguzi, G.; Halage, A.A.; Carpenter, D.O.; Ssempebwa, J.C. Practices, Concerns, and
Willingness to Participate in Solid Waste Management in Two Urban Slums in Central Uganda. J. Environ. Public Health 2016,
2016, 6830163. [CrossRef]
36. Oakley, S.M.; Jimenez, R. Sustainable sanitary landfills for neglected small cities in developing countries: The semi-mechanized
trench method from Villanueva, Honduras. Waste Manag. 2012, 32, 2535–2551. [CrossRef]
37. Batista, M.; Goyannes, R.; Gonçalves, O.L.; Brito, G.; Leal, W.; Rocha, I.T. A framework for sustainable and integrated municipal
solid waste management: Barriers and critical factors to developing countries. J. Clean. Prod. 2021, 312, 127516. [CrossRef]
38. Llanquileo-Melgarejo, P.; Molinos-Senante, M.; Romano, G.; Carosi, L. Evaluation of the Impact of Separative Collection and
Recycling of Municipal Solid Waste on Performance: An Empirical Application for Chile. Sustainability 2021, 13, 2022. [CrossRef]
39. Ferronato, N.; Portugal, G.P.; Guisbert, E.G.; Torretta, V. Assessment of municipal solid waste collection in Bolivia: Perspectives
for avoiding uncontrolled disposal and boosting waste recycling options. Resour. Conserv. Recycl. 2021, 167, 105234. [CrossRef]
40. Herrera-Granda, I.D.; León-Jácome, J.C.; Lorente-Leyva, L.L.; Lucano-Chávez, F.; Montero-Santos, Y.; Oviedo-Pantoja, W.G.;
Díaz-Cajas, C.S. Subregion Districting to Optimize the Municipal Solid Waste Collection Network: A Case Study. In Information
and Communication Technologies of Ecuador (TIC.EC); Springer: Cham, Switzerland, 2019; pp. 225–237. [CrossRef]
41. Al Mamun, A.; Mohiuddin, M.; Ahmad, G.B.; Thurasamy, R.; Fazal, S.A. Recycling Intention and Behavior among Low-Income
Households. Sustainability 2018, 10, 2407. [CrossRef]
42. Kanchanabhan, T.; Abbas Mohaideen, J.; Srinivasan, S.; Lenin Kalyana Sundaram, V. Optimum municipal solid waste collection
using geographical information system (GIS) and vehicle tracking for Pallavapuram municipality. Waste Manag. Res. 2011, 29,
323–339. [CrossRef]
43. Saif, Y.; Griffiths, S.; Almansoori, A. Municipal solid waste supply chain management under an integrated optimization of
sustainability targets. Comput. Chem. Eng. 2022, 160, 107725. [CrossRef]
44. Shaban, A.; Zaki, F.-E.; Afefy, I.H.; Di Gravio, G.; Falegnami, A.; Patriarca, R. An Optimization Model for the Design of a
Sustainable Municipal Solid Waste Management System. Sustainability 2022, 14, 6345. [CrossRef]
45. Eghbali, H.; Arkat, J.; Tavakkoli-Moghaddam, R. Sustainable supply chain network design for municipal solid waste management:
A case study. J. Clean. Prod. 2022, 381, 135211. [CrossRef]You can also read