Mphasis Earnings Q1 FY 2022 - Continuity and Acceleration 23rd July 2021

Page created by Arthur Wallace
 
CONTINUE READING
Mphasis Earnings Q1 FY 2022 - Continuity and Acceleration 23rd July 2021
Mphasis Earnings Q1 FY 2022
Continuity and Acceleration

23rd July 2021

 Nitin Rakesh
 Chief Executive Officer and
 Executive Director

 Manish Dugar
 Chief Financial Officer

    © Mphasis 2021 Proprietary and confidential information I   7/23/2021   I   1   I
Mphasis Earnings Q1 FY 2022 - Continuity and Acceleration 23rd July 2021
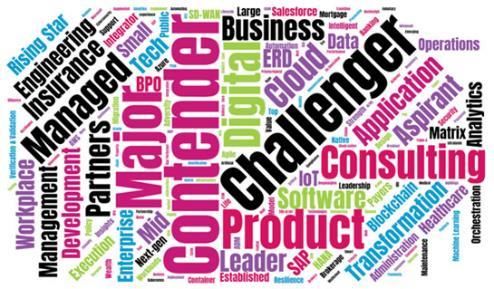
Safe Harbor

Certain statements mentioned in this presentation concerning our future growth prospects are forward looking
statements (the “Forward Statements”) and are based on reasonable expectations of the management, which involves a
number of risks, and uncertainties that could cause actual results to differ materially from those in such Forward
Statements. The risks and uncertainties relating to these Forward Statements include, but are not limited to, risks and
uncertainties regarding fluctuations in our earnings, fluctuations in foreign exchange rates, revenue and profits, our
ability to generate and manage growth, intense competition in IT services, wage increases in India, our ability to attract
and retain highly skilled professionals, time and cost overruns on fixed-price and fixed-time frame contracts, restrictions
on immigration, industry segment concentration, our ability to manage our international operations, our revenues being
highly dependent on clients in the United States of America, reduced demand for technology in our key focus areas,
disruptions in telecommunication networks or system failures, our ability to successfully complete and integrate potential
acquisitions, liability for damages on our service contracts, withdrawal of fiscal governmental incentives, political
instability, adverse impact of global pandemics (including COVID-19 impact), war, legal restrictions on raising capital or
acquiring companies, unauthorized use of our intellectual property(ies) and general economic conditions affecting our
businesses and industry. We may, from time to time, make additional written and oral Forward Statements . We do not
undertake to update any Forward Statements that may be made from time to time by us or on our behalf, unless
required under the law.

  © Mphasis 2021 Proprietary and confidential information I   7/23/2021                                                I   2   I
Mphasis Earnings Q1 FY 2022 - Continuity and Acceleration 23rd July 2021
Technology Consumption Mega Trends Shaping our Propositions and Growth

Enterprise Cloud Migration                                           Next Gen Data   Core Modernization   Customer Experience

   © Mphasis 2021 Proprietary and confidential information I   7/23/2021                                                 I   3   I
Mphasis Earnings Q1 FY 2022 - Continuity and Acceleration 23rd July 2021
Continuity and Acceleration … Driving Theme of Our Four-Pillar Strategy for FY22 and Beyond

• Tribes & Squads
  expansion
• Cloud Guild
                                          Capability
• Domain competency
                                                                                               Sales & Delivery Expansion                    Delivery Expansion

                                                                                          • UK                                     •   Mexico/ Latin America
                                                                     Geography            • Canada                                 •   Costa Rica
                                                                                                                                   •   Taiwan*
                                                                     expansion                                                     •   Estonia

     • ExCo expansion
                                         Leadership
     • Country heads

  • Quantum Lab                                                     Portfolio of IP
  • MLOps                                                           driven AI/ML      Vertical named account            Repeatable domain            Dedicated specialist sales
                                                                                          hunting motion                 context offerings           & delivery for vertical BU
    Low-code, No-code                                               Innovations

  © Mphasis 2021 Proprietary and confidential information I   7/23/2021               * Expansion                                                                     I   4   I
Mphasis Earnings Q1 FY 2022 - Continuity and Acceleration 23rd July 2021
Our Track Record Tells the Story : Consistency and Transformation

  Q1-FY22 Direct revenue grew 32.5% YoY in Constant Currency; Highest growth                                                                                       Accelerated growth with larger
                                  on record                                                                                                                                scale in Direct

                                                                                                                                                            363   YoY →        13.8%          10.0%   10.2%       34.7%

                                                                                                                                                      342                                                          323
                                                                                             CQGR        +2.9%
                                                                                                                                                334
                                                                                                                                          327
                                                                                            CAGR +12.3%                   318 320
                                                                                                                    305             305
                                                                                                              297
                                                                                                        292                                                                      CAGR        +16.8%
                                                                                                  283
                                                                                            276
                                                                                      269                                                                                                              240
                                                                                264

250            CAGR -4.4%                                                 252                                                                                                                 217
      240                                                           242
                      235 237                                                                                                                                                    198
                                229                           231
            227 228                   225 225 224 224
                                                        222
                                                                                                                                                                   174

 Q1 Q2 Q3 Q4 Q1 Q2 Q3 Q4 Q1 Q2 Q3 Q4 Q1 Q2 Q3 Q4 Q1 Q2 Q3 Q4 Q1 Q2 Q3 Q4 Q1 Q2 Q3 Q4 Q1                                                                           Q1’18        Q1’19         Q1’20    Q1’21       Q1’22
’15 ’15 ’15 ’15 ’16 ’16 ’16 ’16 ’17 ’17 ’17 ’17 ’18 ’18 ’18 ’18 ’19 ’19 ’19 ’19 ’20 ’20 ’20 ’20 ’21 ’21 ’21 ’21 ’22
  * Revenue in USD $M at average USD/INR rate for the respective years                                                                                            Direct Business revenues

  © Mphasis 2021 Proprietary and confidential information I   7/23/2021                                                                                                                                       I   5      I
Continuing Success of our Strategy in Numbers

         Revenue in USD Mn
                                                   Y-o-Y

                                                   19%
                                                                                                                  Direct                                              Direct
                                       363                                                        363     Y-o-Y                                   363     Y-o-Y
                         342                                                              342                     Y-o-Y                   342                         Y-o-Y
             305                                                                  305                                             305

                                                                                                                                          204     225     15%         30%
                                                                                                  277     18%     31%
                                       323         35%                                    258                              APPS   195
Direct       240         294                                     Americas         235

                                                                                                          21%     39%                      90      97     51%         51%
                                                                                                                           BPO     64
  DXC                                                                 EMEA         36      46      44
             61           41           34                                                                                                  48
Others                                                                 ROW         34      39      42     22%     98%       ITO    46              41     -12%        22%
          Q1’21        Q4’21         Q1’22                                        Q1’21   Q4’21   Q1’22                           Q1’21   Q4’21   Q1’22

         Direct performance in Q1’22
         •     Highest YoY Growth rate on record; YoY growth of 32.5% in CC
         •     Strong and Consistent growth across all vectors: Segment, Geography and Service type
         •     Broad based growth across client segments; Added 2 new clients each in $100M+ and $50M+ categories

         * Revenue in USD $M at average USD/INR rate for the respective years
          © Mphasis 2021 Proprietary and confidential information I   7/23/2021                                                                                   I   6     I
Broad-based Growth Across Verticals Sustained
    Revenue in USD Mn                                                                     363                  Overall   Direct   Direct   Direct
                                                                     342                                       Q-o-Q     Q-o-Q    Y-o-Y    CAGR*
                                       305

                                                                                          186                    8.4%    11.0%    29.3%    15.2%
                                                                     172
                 Banking &
                Capital Mkt            149

                                                                      34                   33                   -3.8%     -3.3%   16.9%    2.1%
                  Insurance             30
                                                                      50                   52
                         ITCE           43                                                                       3.7%    16.4%    168%     52.0%
Logistics & Transportation              43                            46                   51                    10.8%   14.4%    27.7%    38.8%
                      Others            40                            41                   41                                     31.6%    9.2%
                                                                                                                 2.2%     8.4%
                                     Q1’21                         Q4’21                Q1’22

          •    BCM: Consistent track record of double-digit YoY growth
               – Delivered growth of 20%+ YoY growth in past 4 quarters ; “Best in class performance”
               – All Top-10 Banks in the US are our clients today vs 5 three years ago
          •    With our tech-led positioning, we are replicating our performance in BCM into other verticals
               – ITCE: YoY growth of over 160% driven by recent large deal wins; the next US$100 million vertical
               – Logistics and Transportation: Strong YoY growth of 27.7%
               – Insurance: YoY growth of 16.9%; Growth likely to pick up based on deal closures and pipeline
  © Mphasis 2021 Proprietary and confidential information I   7/23/2021    * CAGR for the past 4-year period                                        I   7   I
All Constituents of Direct Growth Progressing Well; Key Clients Lead Growth
                    Accelerated Growth in Direct Revenue
     Q1’22: Highest YoY Growth Rate
                                                            YoY
                                                                                                                   Strong Q1’22 YoY (32.5% CC)
                                                      +34.7%                         323                 Overall   growth; Broad based growth across
                                                            294                                                    all vectors

                     240
                                                                                                                   Top 10 accounts grew 24.5%* YoY;
                                                                                                         Top 10    All US$50 mn+ accounts grew
                   Q1’21                               Q4’21                       Q1’22                           sequentially in Q1’22

                    Top Accounts leading growth in Direct                                                          Europe region delivering strong
                    LTM revenue ($ Mn) for top 10 accounts in Direct ( as per MDA disclosures)
                                                            YoY *                                Q1’22
                                                                                                         Europe    growth; Q1’22 revenue has grown
                                                      +24.5%                                      YoY              at 25.9% YoY on CC basis
                                                                                                 56%
                                                                                                                   NCA continues to contribute to
Top 6 - 10
                                                                                                          NCA      growth in Direct; YoY growth of
                                                                                                 17%               34.3%
 Top 1 - 5

                   Q1’21                               Q4’21                       Q1’22
Revenue in $M at average USD/INR rate for the respective quarters ; * Basis LTM revenue                                     NCA: New Client acquisitions
© Mphasis 2021 Proprietary and confidential information I    7/23/2021                                                                                     I   8   I
Record-breaking TCV Wins - Direct
                                                Direct TCV Wins                                         Direct: Revenue vs TCV – Strong Correlation

                                                            YoY

                                                         +95.1%                     505

                                      360
                 259                                       247              245             FY’21 Avg

 New Gen

Traditional
               Q1’21                 Q2’21                Q3’21             Q4’21   Q1’22
   TCV wins : $ Mn

                •     Highest ever TCV wins for a quarter at $505M ; YoY LTM growth of 62%; Already at 45% of FY’21 TCV in 1 quarter
                •     Includes a landmark deal of $250M in UK region in BFSI domain
                •     85% of deal wins in New Gen areas
                •     New Gen wins are witnessing increased deal sizes

    © Mphasis 2021 Proprietary and confidential information I   7/23/2021                                                                   I   9   I
Improving Client Mining and Large-deal Metrics - Direct
                                        Client Pyramid                                                               Focus on winning large-deals (>$20M TCV)
                                                                                                                 # of cumulative deal wins since Q1’18
                                                                                                        84
                                                                                                   79
                  Client Additions                                                            59
                                                                                         39                  LTM avg deal size
   Category                    Y-o-Y             Q-o-Q                                                                                  25                33      38      96
                                                                                                             (large deals)
    $100M +                     2                    2
     $50M +                     3                    2                              32                                                                                    27
      $5M +                     7                    2
      $1M +                     5                    -                         28

                                                                                                                                                                  21
   Healthy conversion of 60%-70% clients
   at each stage to the next

                                                                          18
                                                                     16

                                                                13                                                                                        11
        Q1’18
        Q1’21                                            9
        Q1’22                                                                                                                            7
                                            7    7 7
                           5
            4          4                4
                                    3                                                                                2
        2
    1              1

   >$100 M         >$75 M           >$50 M       >$20 M          >$10 M         >$5 M          >$1 M              Q1’18               Q1’19              Q1’20   Q1’21   Q1’22
Note: All metrics based on LTM revenues                                                                      Includes large deal of $250M won in Q1’22
    © Mphasis 2021 Proprietary and confidential information I   7/23/2021                                                                                                 I 10   I
Strong Performance on All Financial Metrics
 Revenue growth                                                                    Operating Profit growth
                                                  YoY                                                                                    YoY
                                                                          363                                                         +21.9%                            58
                                               +18.8%
                                                                                                                                          55
                                                  342

                  305                                                                                    48

                Q1’21                           Q4’21                     Q1’22                        Q1’21                           Q4’21                          Q1’22
Gross Revenue in $M at average USD/INR rate for respective periods                  EBIT in $M at average USD/INR rate for respective periods

 EPS growth                                                                        Consistent Operating Cash flow generation
                                                    YoY
                                                                            18.2                                                      OCF/PAT
                                                 +23.1%                                                                                                                 48
                                                                                                                                        >100%
                                                   17.0
                                                                                                                                          45

                  14.8                                                                                   42

                 Q1’21                            Q4’21                    Q1’22                       Q1’21                           Q4’21                          Q1’22
Basic EPS in INR for respective periods                                             Net Operating Cash flow as per MDA disclosures; Converted at average USD/INR for respective periods
© Mphasis 2021 Proprietary and confidential information I     7/23/2021                                                                                                              I 11   I
Why do we win? Pulling Together the Ingredients of Our Success

   Business of ONE                                                 Power of Tribes   Proactive Deal Origination    Deep Domain Expertise

  Customer at the center                                         Leading Pipeline       Large Deal motion            Lead with Architecture,
  of GTM – Personalized                                          Expansion              Archetypes                   Design & Engineering
  Services
  Hi-Tech, Hi-Touch & Hi-                                        Sparkle Labs for       Shift left consulting        Talent NEXT driving
  Trust engagement model                                         Innovation             through Tech Advisory        culture & skillsets
                                                                                        Group TAG
100M+ Clients          2→4                                    85% of our wins are     >80% of deals are           T- Shaped talent
50M+ Clients           4→7                                    tribe-led               proactive in nature         approach

  © Mphasis 2021 Proprietary and confidential information I   7/23/2021                                                               I 12     I
Summary

  •      Strong start to the year – Industry leading growth in Direct (32.5% Y/Y Constant Currency growth)

  •      KPIs moving in the right direction with our tribe-based propositions paying off

           o Track record in winning large deals consistently improving marked by increasing-sized, longer-tenure deals
             (US$100 mn → US$200 mn → US$250 mn); LTM TCV up 65% Y/Y with all-time high TCV of $0.5 billion

           o Broad-based nature of growth sustained with Europe & multiples verticals (Hi Tech, Travel and
             Transportation) aiding growth besides anchor vertical (BCM) and geography (US)

           o Continued share gains with key clients; Strong Top-5/Top-10/Top-20 client LTM growth, with additions to
             US$50/100 mn+ revenue bucket; Client mining metrics across revenue buckets continue to strengthen
  •      Growth-accretive margin stance ensures predictable margin performance while providing room to make
         essential investments and managing supply headwinds

© Mphasis 2021 Proprietary and confidential information I   7/23/2021                                           I 13   I
Reiterating FY22 Outlook

     • Sustained investments in tune with our “Continuity and Acceleration” theme – geography footprint
            expansion, greater leadership breadth and depth, build-up of digital competencies, NCA

               o Industry-leading growth in Direct

               o Target operating (EBIT) margin band of 15.5%-17%

© Mphasis 2021 Proprietary and confidential information I   7/23/2021                                I 14   I
Q&A

          Link to financial data for the past three years: https://www.mphasis.com/home/corporate/investors.html

© Mphasis 2021 Proprietary and confidential information I   7/23/2021                                              I 15   I
Industry Awards and Analysts/Advisors Recognitions

                                                                        STAR          Recognized in IT Services
                                                                        PERFORMER     Vendors in Insurance : 2021           GARTNER
                                                                        & MAJOR       Life & Health Edition
                                                                        CONTENDER                                       Fastest growing BPS provider in Gartner
                                                                                                                        Market Share Analysis: Business Process
                                                     Financial Crime and Compliance
                                                     (FCC) Operations – 2021
                                                                                       CELENT | 2021                    Services, Worldwide, 2020

 HFS POINT OF VIEW
        Mphasis Next Act
    – Applied innovation in the
         digital dog years

                                                                                                                                     Nitin Rakesh won a Bronze

 FORRESTER
                                                                                                                                        Stevie in the Services
                                                                                                                                     category for Tech Innovator
                                                                                                                                         of the Year in 2021
                   Automated Life                                                                                                    American Business Awards
                                                                           LEADER
    NOW            Insurance
    TECH           underwriting
                   systems, Q1
    2021           2021

                      MAJOR
                                                                                          Recognized in IT Services
                                                                                          Vendors in Insurance : 2021
                                                                                                                              FORRESTER        Salesforce
                      CONTENDER                                                           Property & Casualty                   NOW            Consulting
                                                                                                                                TECH           Partners in Asia
IT Managed Security Services
Provider – 2021
                                                                                            CELENT | 2021                       2021
                                                                                                                                               Pacific, Q1 2021

© Mphasis 2021 Proprietary and confidential information I   7/23/2021                                                                                              I 16   I
THANK YOU
                                                                        About Mphasis
                                                                        Mphasis (BSE: 526299; NSE: MPHASIS) applies next-generation technology to help enterprises transform businesses globally.
                                                                        Customer centricity is foundational to Mphasis and is reflected in the Mphasis’ Front2Back™ Transformation approach.
                                                                        Front2Back™ uses the exponential power of cloud and cognitive to provide hyper-personalized (C=X2C2 TM=1) digital
                                                                        experience to clients and their end customers. Mphasis’ Service Transformation approach helps ‘shrink the core’ through the
                                                                        application of digital technologies across legacy environments within an enterprise, enabling businesses to stay ahead in a
                                                                        changing world. Mphasis’ core reference architectures and tools, speed and innovation with domain expertise and
                                                                        specialization are key to building strong relationships with marquee clients. Click here to know

                                                                        Important Confidentiality Notice
                                                                        This document is the property of, and is proprietary to Mphasis, and identified as “Confidential”. Those parties to whom it is distributed shall exercise the
                                                                        same degree of custody and care afforded their own such information. It is not to be disclosed, in whole or in part to any third parties, without the
                                                                        express written authorization of Mphasis. It is not to be duplicated or used, in whole or in part, for any purpose other than the evaluation of, and
                                                                        response to, Mphasis’ proposal or bid, or the performance and execution of a contract awarded to Mphasis. This document will be returned to Mphasis
                                                                        upon request.

© Mphasis 2021 Proprietary and confidential information I   7/23/2021                                                                                                                                                       I 17        I
You can also read