MATERNAL-FETAL IMMUNE RESPONSES IN PREGNANT WOMEN INFECTED WITH SARS-COV-2
←
→
Page content transcription
If your browser does not render page correctly, please read the page content below
ARTICLE
                  https://doi.org/10.1038/s41467-021-27745-z                 OPEN

                  Maternal-fetal immune responses in pregnant
                  women infected with SARS-CoV-2
                  Valeria Garcia-Flores1,2, Roberto Romero 1,3,4,5,6 ✉, Yi Xu1,2, Kevin R. Theis1,2,7, Marcia Arenas-Hernandez                                        1,2,

                  Derek Miller 1,2, Azam Peyvandipour1,2,5, Gaurav Bhatti1,2, Jose Galaz1,2, Meyer Gershater1,2,
                  Dustyn Levenson1,2, Errile Pusod1,2, Li Tao1,2, David Kracht1,2, Violetta Florova1,2, Yaozhu Leng1,2,
                  Kenichiro Motomura 1,2, Robert Para1,2, Megan Faucett1,2, Chaur-Dong Hsu1,2,8, Gary Zhang 5,
                  Adi L. Tarca 1,2,9, Roger Pique-Regi1,2,5 ✉ & Nardhy Gomez-Lopez 1,2,7 ✉
1234567890():,;

                  Pregnant women represent a high-risk population for severe/critical COVID-19 and mortality.
                  However, the maternal-fetal immune responses initiated by SARS-CoV-2 infection, and
                  whether this virus is detectable in the placenta, are still under investigation. Here we show
                  that SARS-CoV-2 infection during pregnancy primarily induces unique inflammatory
                  responses at the maternal-fetal interface, which are largely governed by maternal T cells and
                  fetal stromal cells. SARS-CoV-2 infection during pregnancy is also associated with humoral
                  and cellular immune responses in the maternal blood, as well as with a mild cytokine
                  response in the neonatal circulation (i.e., umbilical cord blood), without compromising the
                  T-cell repertoire or initiating IgM responses. Importantly, SARS-CoV-2 is not detected in the
                  placental tissues, nor is the sterility of the placenta compromised by maternal viral infection.
                  This study provides insight into the maternal-fetal immune responses triggered by SARS-
                  CoV-2 and emphasizes the rarity of placental infection.

                  1 Perinatology Research Branch, Division of Obstetrics and Maternal–Fetal Medicine, Division of Intramural Research, Eunice Kennedy Shriver National

                  Institute of Child Health and Human Development, National Institutes of Health, US Department of Health and Human Services (NICHD/NIH/DHHS),
                  Bethesda, MD 20892 and Detroit MI 48201, USA. 2 Department of Obstetrics and Gynecology, Wayne State University School of Medicine, Detroit, MI
                  48201, USA. 3 Department of Obstetrics and Gynecology, University of Michigan, Ann Arbor, MI 48109, USA. 4 Department of Epidemiology and
                  Biostatistics, Michigan State University, East Lansing, MI 48824, USA. 5 Center for Molecular Medicine and Genetics, Wayne State University, Detroit, MI
                  48201, USA. 6 Detroit Medical Center, Detroit, MI 48201, USA. 7 Department of Biochemistry, Microbiology and Immunology, Wayne State University
                  School of Medicine, Detroit, MI 48201, USA. 8 Department of Physiology, Wayne State University School of Medicine, Detroit, MI 48201, USA. 9 Department
                  of Computer Science, Wayne State University College of Engineering, Detroit, MI 48201, USA. ✉email: prbchiefstaff@med.wayne.edu; rpique@wayne.edu;
                  nardhy.gomez-lopez@wayne.edu

                  NATURE COMMUNICATIONS | (2022)13:320 | https://doi.org/10.1038/s41467-021-27745-z | www.nature.com/naturecommunications                               1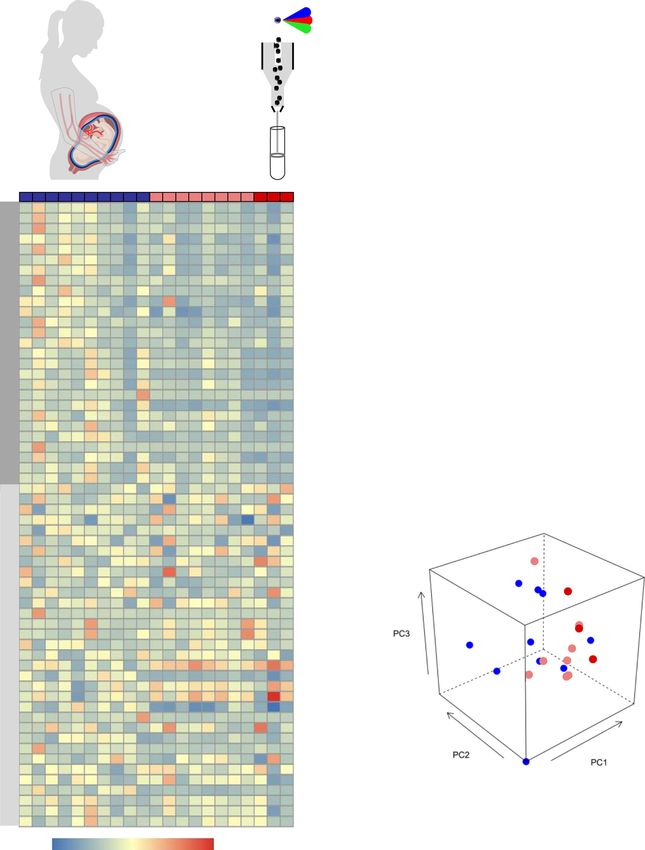
ARTICLE                                                                  NATURE COMMUNICATIONS | https://doi.org/10.1038/s41467-021-27745-z

T
       o date, more than 150,000 pregnant women in the United                 fetal immune responses in the maternal and neonatal circulation as
       States have been infected with SARS-CoV-21, the virus                  well as at the maternal–fetal interface in the absence of viral
       responsible for the coronavirus disease 2019 (COVID-19).               detection in the placenta. This study highlights the deleterious
During pregnancy, SARS-CoV-2 infection can lead to variable                   effects of SARS-CoV-2 infection during pregnancy on the mother
outcomes, which range from experiencing no symptoms to                        and the offspring.
developing severe/critical disease2,3. Most pregnant women with
SARS-CoV-2 infection are asymptomatic or only experience mild                 Results
symptoms4,5. Regardless, in the first 6 months of the COVID-19                 Characteristics of the study population. A total of 23 pregnant
pandemic, it was documented that pregnant women with SARS-                    women were enrolled in our study. The demographic and clinical
CoV-2 were at an increased risk for hospitalization, mechanical               characteristics of the study population are displayed in Supple-
ventilation, intensive care unit admission, and preterm birth2,3,6,7,         mentary Table 1. Maternal blood samples were collected upon
but rates of maternal mortality were reported to be similar                   admission, prior to administration of any medication. Twelve
between pregnant and non-pregnant women6. More recently, it                   pregnant women tested real-time polymerase chain reaction (RT-
has been clearly shown that pregnant women are at high risk for               PCR) positive (nasopharyngeal swab) for SARS-CoV-2; eight were
severe/critical disease and mortality as well as preterm birth8–11.           asymptomatic, one had mild symptoms (e.g., fever and tachy-
Therefore, investigating host immune responses in pregnant                    cardia), and three were diagnosed as having severe COVID-19
women infected with SARS-CoV-2, even if they are asymptomatic,                (requiring oxygen supplementation). One of the women with
is timely.                                                                    severe disease underwent emergency preterm cesarean section due
   Most neonates born to infected women test negative for SARS-               to worsening respiratory function, which is consistent with pre-
CoV-2, and the majority of those testing positive for the virus               vious studies reporting that COVID-19 is associated with higher
present symptoms that are not severe7,12. For the latter group, the           rates of indicated preterm birth10. Yet, the rest of the SARS-CoV-
timing of mother-to-child transmission (i.e., vertical transmis-              2-positive women delivered term neonates, as did most of the
sion) of SARS-CoV-2 is still unclear, since this can occur in utero,          non-infected controls. Neonates were not RT-PCR tested for
intrapartum, or early in the postnatal period13. Yet, while rare13,           SARS-CoV-2; thus, infection status throughout the manuscript
there is already evidence of SARS-CoV-2 in utero vertical                     refers solely to the mother. No differences in demographic and
transmission14,15, which is likely to occur through the hemato-               clinical characteristics were found between the study groups,
genous route (i.e., bloodstream infection)16. In such cases, the              including Apgar scores and placental histopathological lesions.
virus must cross the maternal–fetal interface by infecting the
syncytiotrophoblast layer of the placenta to gain access to the fetal
circulation. The mechanisms whereby SARS-CoV-2 infects pla-                   Pregnant women with SARS-CoV-2 infection and their neo-
cental cells are still under investigation; however, it is well               nates exhibit distinct IgM responses. Previous studies have
accepted that coronaviruses can enter host cells via two main                 shown that maternal IgG antibodies are transferred across the
canonical mechanisms17,18: (1) the direct pathway, in which host              placenta in both symptomatic and asymptomatic women infected
cells are required to express both the angiotensin-converting                 with SARS-CoV-226. In addition, there is evidence showing that
enzyme 2 (ACE-2) receptor19 and the serine protease                           neonates born to mothers with COVID-19 can have detectable
TMPRSS220; and (2) the endosomal route, in which cell entry can               SARS-CoV-2 IgM as well as IgG15,27. The presence of IgG is likely
be mediated by ACE-2 alone. Using both single-cell and single-                due to the passive transfer of this immunoglobulin from the
nuclear RNA sequencing, we have previously shown that the co-                 mother to the fetus across the placenta. However, detectable levels
expression of ACE-2 and TMPRSS2 is negligible in first, second,                of IgM suggest that the fetus was infected with SARS-CoV-2,
and third trimester placental cells21. Subsequent investigations              given that this immunoglobulin cannot cross the placenta due to
demonstrated that the ACE-2 protein was polarized to the stro-                its large molecular weight. Therefore, we first determined the
mal (fetal) side of the syncytiotrophoblast and TMPRSS2 was                   concentrations of SARS-CoV-2-specific IgM and IgG in the
limited to the villous endothelium22,23. Yet, placental cells can             maternal and umbilical cord blood (hereafter referred to as “cord
express non-canonical cell entry mediators such as cathepsin L                blood”). As expected, pregnant women with SARS-CoV-2 infec-
(CSTL), FURIN, and sialic acid-binding Ig-like lectin 1                       tion had higher serum levels of IgM and IgG than controls
(SIGLEC1), among others21. Furthermore, SARS-CoV-2 infection                  (Fig. 1a). The IgM and IgG levels of the pregnant women with
can be associated with vascular damage in pregnant women, in                  severe COVID-19 were similar to those without symptoms. In
whom ischemic injury of the placenta may facilitate viral cell                addition, IgG was increased in the cord blood of neonates born to
entry24. Therefore, SARS-CoV-2 can infect placental cells, as has             women infected with SARS-CoV-2 infection but IgM was unde-
already been reported25; however, placental infection alone is not            tected, similar to control neonates (Fig. 1a). Therefore, serological
considered confirmatory evidence of in utero vertical                          data imply that in our study population, which is largely
transmission13. Nonetheless, it is possible that the maternal                 asymptomatic for COVID-19, none of the neonates seemed to be
inflammatory response induced by SARS-CoV-2 infection has                      infected with SARS-CoV-2.
deleterious effects on the offspring. Therefore, investigating the
host immune response in the umbilical cord blood as well as at                Pro-inflammatory cytokine responses are displayed in the cir-
the site of maternal–fetal interactions (i.e., the maternal–fetal             culation of pregnant women with SARS-CoV-2 infection and
interface) may shed light on the adverse effects of SARS-CoV-2                their neonates. The pathophysiology of SARS-CoV-2 infection
infection during pregnancy.                                                   includes a cytokine storm in the systemic circulation, which can
   Herein, we utilize a multidisciplinary approach that includes the          lead to multi-organ damage28,29. Hence, we next determined the
detection of SARS-CoV-2 IgM/IgG, multiplex cytokine assays,                   systemic cytokine response in mothers and neonates by mea-
immunophenotyping, single-cell RNA-sequencing (scRNA-seq),                    suring the concentrations of 20 cytokines in maternal and cord
bulk transcriptomics, and viral RNA and protein detection, together           blood plasma. Pregnant women infected with SARS-CoV-2 had
with the assessment of the microbiome diversity and histopathology            increased systemic concentrations of IL-8 (5.9-fold change (FC)),
of the placenta, to characterize the maternal–fetal immune                    IL-10 (2.3-FC), and IL-15 (1.5-FC) compared to control mothers
responses triggered by SARS-CoV-2 during pregnancy. We report                 (Fig. 1b, Supplementary Table 2); such changes were not driven
that SARS-CoV-2 during pregnancy initiates unique maternal and                solely by the severe COVID-19 cases. Neonates born to women

2                 NATURE COMMUNICATIONS | (2022)13:320 | https://doi.org/10.1038/s41467-021-27745-z | www.nature.com/naturecommunications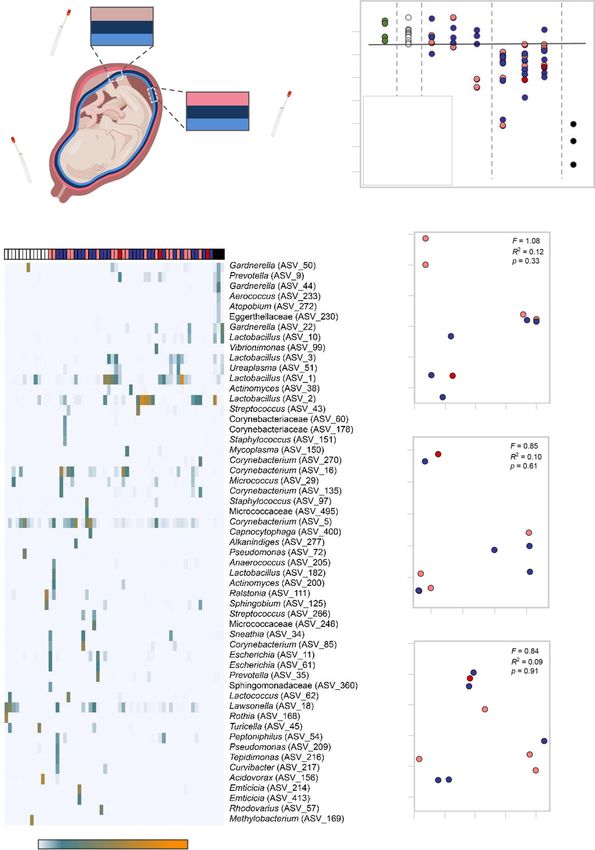
NATURE COMMUNICATIONS | https://doi.org/10.1038/s41467-021-27745-z ARTICLE
a Maternal blood Cord blood
IgM IgG IgM IgG
300 8000 1.0 8000
Concentration (ng/mL)
Concentration (ng/mL)
0.8
6000 6000
200 SARS-CoV-2 (+)
0.6
4000 4000 SARS-CoV-2 (+)
0.4 severe disease
100
2000 2000
0.2
0 0 0.0 0
Controls Cases Controls Cases Controls Cases Controls Cases
SARS-CoV-2 (+) SARS-CoV-2 (+) severe disease
b IL-8 IL-6 IL-10 IL-15 d
Maternal blood
200 150 2.5 5
Concentration (pg/mL)
2.0 4
150
100
1.5 3
PC1, 50.08% variation
100
1.0 2
50
50
0.5 1
Maternal blood
0 0 0.0 0
Controls Cases Controls Cases Controls Cases Controls Cases
IL-16 IL-17A IFN-γ TNF
20000 3 80 4
Concentration (pg/mL)
15000 60 3
2 p = 0.034
10000 40 2
1 PC3, 10.18% variation
5000 20 1
0 0 0 0
Controls Cases Controls Cases Controls Cases Controls Cases
SARS-CoV-2 (+)
Control SARS-CoV-2 (+)
severe disease
c IL-8 IL-6 IL-10 IL-15
e
10 60 1.0 2.5
Concentration (pg/mL)
Cord blood
8 0.8 2.0
40
6 0.6 1.5
4 0.4 1.0
20
PC1, 25.84% variation
2 0.2 0.5
0 0 0.0 0.0
Cord blood
Controls Cases Controls Cases Controls Cases Controls Cases
IL-16 IL-17A IFN-γ TNF
2500 4 1.5 1.5
Concentration (pg/mL)
2000
3
1.0 1.0
1500
2 p = 0.032
1000
0.5 0.5
1
500
PC2, 14.14% variation
0 0 0.0 0.0
Controls Cases Controls Cases Controls Cases Controls Cases
Fig. 1 Serological and cytokine responses in maternal and cord blood of women with SARS-CoV-2 infection and their neonates. a Serum concentrations
of IgM and IgG in the maternal blood [n = 9 control, 11 SARS-CoV-2 (+)] (left panel) and cord blood [n = 6 control, 7 SARS-CoV-2 (+)] (right panel).
Data are shown as boxplots where midlines indicate medians, boxes indicate interquartile range and whiskers indicate minimum/maximum range.
Differences between groups were evaluated by two-sided Mann–Whitney U-tests. p-values < 0.05 were used to denote a significant result. Plasma
concentrations of IL-8, IL-6, IL-10, IL-15, IL-16, IL-17A, IFN-γ, and TNF in b maternal blood [n = 8 control, 11 SARS-CoV-2(+)] and c cord blood [n = 7
control, 9 SARS-CoV-2(+)]. Data are shown as boxplots where midlines indicate medians, boxes indicate interquartile range and whiskers indicate
minimum/maximum range. Gray dotted lines indicate the lower limit of detection. Differences in cytokine concentrations between groups were evaluated
by linear mixed-effects models with adjustment for covariates. Scatter plots of two principal components (PC1 and PC3 or PC1 and PC2) from plasma
cytokine concentrations in the d maternal blood [n = 8 control, 11 SARS-CoV-2(+)] and e cord blood [n = 7 control, 9 SARS-CoV-2(+)]. The association
between principal components (PC1, PC2, and PC3 jointly for maternal blood and PC2 for cord blood) and SARS-CoV-2 (+) status was assessed by logistic
regression. Blue dots indicate control women, light red dots indicate SARS-CoV-2 (+) women, and dark red dots indicate women with severe COVID-19.
Significant differences are based on p < 0.05.
NATURE COMMUNICATIONS | (2022)13:320 | https://doi.org/10.1038/s41467-021-27745-z | www.nature.com/naturecommunications 3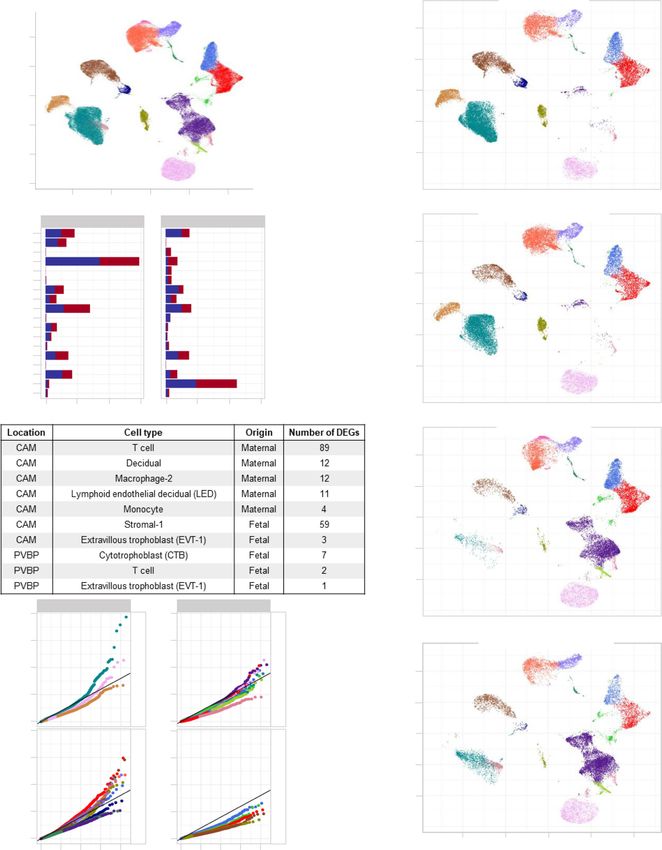
ARTICLE                                                                 NATURE COMMUNICATIONS | https://doi.org/10.1038/s41467-021-27745-z

infected with SARS-CoV-2 had increased concentrations of IL-8                the placental tissues including lymphoid and myeloid immune
(2-FC) compared to those born to control mothers (Fig. 1c,                   cells, trophoblast cell types, stromal cells, and endometrial/decid-
Supplementary Table 2); such an inflammatory change was not                   ual cells as well as endothelial cells (Fig. 4a). Differences in
driven by the severe COVID-19 cases. However, no other sig-                  abundance among cell type clusters were observed between pla-
nificant differences in the concentrations of maternal and cord               cental compartments as well as between tissues from women with
blood cytokines were observed between women infected with                    SARS-CoV-2 infection and those from controls (Fig. 4b, c). Fur-
SARS-CoV-2 and control mothers (Fig. 1b, c, Supplementary                    ther analysis revealed that the majority of the differentially
Figs. 1 and 2, Supplementary Table 2). The maternal and cord                 expressed genes (DEGs, Supplementary Data 1) between SARS-
blood cytokine responses, as captured by the first three principal            CoV-2-positive cases and controls belong to immune cells from
components, were associated with the SARS-CoV-2 infection                    the CAM, namely maternal T cells (89 DEGs) and macrophages
status (p = 0.034 for maternal blood and p = 0.032 for cord blood            (12 DEGs) (Fig. 4d, e). Decidual and lymphatic endothelial
Fig. 1d, e). These results show that a cytokine response is                  decidual (LED) cells of maternal origin displayed 12 and 11 DEGs,
observed in both the maternal and neonatal circulation upon                  respectively, between SARS-CoV-2 cases and controls. Notably,
maternal infection with SARS-CoV-2.                                          fetal stromal cells from the CAM were also largely affected by
                                                                             SARS-CoV-2 infection (59 DEGs, Fig. 4d, e). However, other fetal
                                                                             cell types (e.g., trophoblasts and T cells) in the CAM and PVBP
Pregnant women with SARS-CoV-2 infection, but not their
                                                                             were minimally altered by the presence of SARS-CoV-2 infection
neonates, undergo a T-cell reduction in the circulation. Pre-
                                                                             in the mother (Fig. 4d, e).
vious studies have shown that patients with moderate or severe
                                                                                The effects of SARS-CoV-2 on gene expression in maternal
COVID-19 display alterations in their cellular immune responses
                                                                             T cells from the CAM and PVBP were compared to those from
in the peripheral circulation29–31. Therefore, we investigated
                                                                             peripheral T cells from hospitalized COVID-19 patients37, which
whether pregnant women with SARS-CoV-2 infection and their
                                                                             we will refer to as the reference database hereafter. Maternal
neonates had changes in their cellular immune repertoire, using
                                                                             T-cell gene expression changes resulting from SARS-CoV-2
immunophenotyping (Fig. 2a, Supplementary Figs. 3a and 4a).
                                                                             infection in the CAM were positively correlated with those in the
Immunophenotyping included the identification of general leu-
                                                                             reference database (T cells from patients with COVID-19)
kocyte subpopulations as well as monocyte, neutrophil, T-cell,
                                                                             (Spearman’s ρ = 0.27, p = 0.004; Fig. 5a), suggesting a significant
and B-cell subsets. Neutrophil and monocyte function has also
                                                                             degree of shared DEGs. Yet, maternal T-cell gene expression
been implicated in the pathogenesis of SARS-CoV-2
                                                                             induced by SARS-CoV-2 in the CAM was also distinct, since 53
infection31–33; therefore, reactive oxygen species (ROS) produc-
                                                                             of the 89 identified DEGs were not found in the reference
tion by neutrophils and monocytes was also determined in
                                                                             database. By contrast, maternal T-cell gene expression dysregula-
maternal and cord blood (Supplementary Fig. 5a). No statistical
                                                                             tion in the PVBP was not correlated with that from the reference
differences were observed in the mother or the neonate in the
                                                                             database (Spearman’s ρ = 0.009, p = 0.62; Fig. 5a). Gene Ontol-
total number of general leukocyte subpopulations or in the
                                                                             ogy (GO) analysis revealed that the shared DEGs between
monocyte, neutrophil, activated T-cell, and B-cell subsets (Sup-
                                                                             maternal T cells in the CAM and the reference T-cell data
plementary Figs. 3b–f and 4b–f). Although neutrophils and
                                                                             included translational termination and elongation as well as
monocytes produced ROS when stimulated, no differences were
                                                                             mitochondrial translational termination and elongation (Supple-
found between SARS-CoV-2 cases and controls in the maternal
                                                                             mentary Fig. 6).
blood (Supplementary Fig. 5a, b). Mild differences were observed
                                                                                Although most of the DEGs were detected in the maternal
in the cord blood (Supplementary Fig. 5a, c). Nonetheless,
                                                                             T cells in the CAM, maternal macrophages and other cell types
pregnant women with SARS-CoV-2 infection had reduced T-cell
                                                                             such as maternal monocytes, maternal decidual cells and LED,
numbers, but their neonates did not display such a decline
                                                                             fetal stromal cells and trophoblast cell types also contributed to
(Fig. 2b). Heatmap and principal component analysis (PCA)
                                                                             the differential gene expression observed between SARS-CoV-2
representations of the immunophenotyping of the maternal blood
                                                                             cases and controls (Fig. 5b). The top upregulated and down-
showed that SARS-CoV-2 infection mildly altered T-cell subsets
                                                                             regulated genes in maternal T cell and Macrophage-2, as well as
(Fig. 2c, d). Specifically, pregnant women infected with SARS-
                                                                             fetal Stromal-1, are also displayed in Fig. 5c, showing that changes
CoV-2 had reduced numbers of CD4+ T cells, including TCM and
                                                                             in gene expression were not always homogeneous across all the
Th1-like cells, as well as CD8+ T cells, including TCM, TEM, and
                                                                             cells. Gene set enrichment analysis of the DEGs from the most
Tc17-like cells (Fig. 3a, b). Such changes were not solely driven by
                                                                             affected cell clusters (maternal T cell, Decidual, and Macrophage-
the severe COVID-19 cases. Neonates born to women with SARS-
                                                                             2 and fetal Stromal-1), using the Kyoto Encyclopedia of Genes
CoV-2 infection did not display changes in the T-cell subsets that
                                                                             and Genomes (KEGG) pathways, revealed that each cell type
were affected in mothers (Fig. 3c). These data showed that
                                                                             specifically contributed to the inflammatory response. For
pregnant women infected with SARS-CoV-2 undergo a reduction
                                                                             example, the TNF signaling pathway was enriched in Decidual
in T-cell subsets, including pro-inflammatory Th1- and Tc17-like
                                                                             transcripts, cytokine–cytokine receptor interaction was enriched
cells, which is not translated to the neonatal T-cell repertoire.
                                                                             in maternal Macrophage-2, coronavirus disease (COVID-19) was
                                                                             enriched in fetal Stromal-1, and degenerative diseases were
Single-cell RNA sequencing reveals perturbed maternal and                    associated with maternal T cells (Fig. 5d). Furthermore, GO and
fetal immune responses at the maternal–fetal interface of                    Reactome pathway analysis of the combined DEGs from all cell
women with SARS-CoV-2 infection. Next, we investigated                       types in response to SARS-CoV-2 infection included interferon
whether SARS-CoV-2 infection in the mother could alter cellular              signaling, TNF signaling pathway, antigen presentation, and other
immune responses in the placenta, the organ that serves as the               cellular processes associated with viral responses (Supplementary
lungs, gut, kidneys, and liver of the fetus34,35. We performed               Fig. 7). Lastly, STRING enrichment analysis of all DEGs showed
scRNA-seq of the placental tissues including the basal plate (BP)            that the interferon signaling pathway was enriched in the
(placental villi (PV) and BP, PVBP) and the chorioamniotic                   placental tissues of women with SARS-CoV-2 infection (Supple-
membranes (CAM) from pregnant women with SARS-CoV-2                          mentary Fig. 8a).
infection and controls, using established methods. Consistent with              Taken together, these data show that placentas from women
our previous studies21,36, multiple cell clusters were identified in          with SARS-CoV-2 display alterations in their immune repertoire,

4                NATURE COMMUNICATIONS | (2022)13:320 | https://doi.org/10.1038/s41467-021-27745-z | www.nature.com/naturecommunications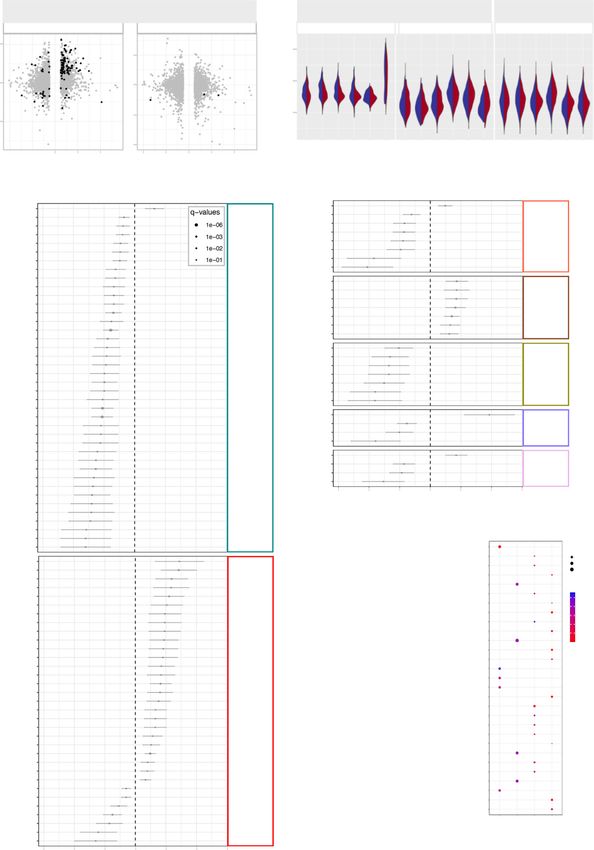
NATURE COMMUNICATIONS | https://doi.org/10.1038/s41467-021-27745-z                                                                                ARTICLE

                                                                                                          (cells/μL)
                                                                                                   (cells/μL)
                                                                                                                  Flow cytometry T-cell data in
                                                                                                                        maternal blood

Fig. 2 Immunophenotyping of T cells in the maternal and cord blood of women with SARS-CoV-2 infection and their neonates. a Maternal blood and
cord blood were collected for immunophenotyping. b Numbers of T cells in the peripheral blood [n = 10 control, 11 SARS-CoV-2 (+)] and cord blood [n = 9
control, 8 SARS-CoV-2 (+)]. Data are shown as boxplots where midlines indicate medians, boxes indicate interquartile range and whiskers indicate
minimum/maximum range. Differences between groups were evaluated by Mann–Whitney U-tests. P values < 0.05 were used to denote a significant
result. Blue dots indicate control women, light red dots indicate SARS-CoV-2 (+) women, and dark red dots indicate women with severe COVID-19. c
Heatmap showing the abundance (z-scores) of T-cell subsets in the maternal blood from SARS-CoV-2 (+) or control women [n = 10 control, 11 SARS-
CoV-2 (+)], where cell numbers and proportions are shown. Differences between groups were assessed using two-sample t-tests. P values were adjusted
for multiple comparisons using the false-discovery rate (FDR) method to obtain q values. *q < 0.1; **q < 0.05. Red and blue indicate increased and
decreased abundance, respectively. d Three-dimensional scatter plot showing the distribution of flow cytometry data. Blue dots indicate control women,
light red dots indicate SARS-CoV-2 (+) women, and dark red dots indicate women with severe COVID-19 [n = 10 control, 11 SARS-CoV-2(+)] based on
principal component (PC)1–PC3.

NATURE COMMUNICATIONS | (2022)13:320 | https://doi.org/10.1038/s41467-021-27745-z | www.nature.com/naturecommunications                                 5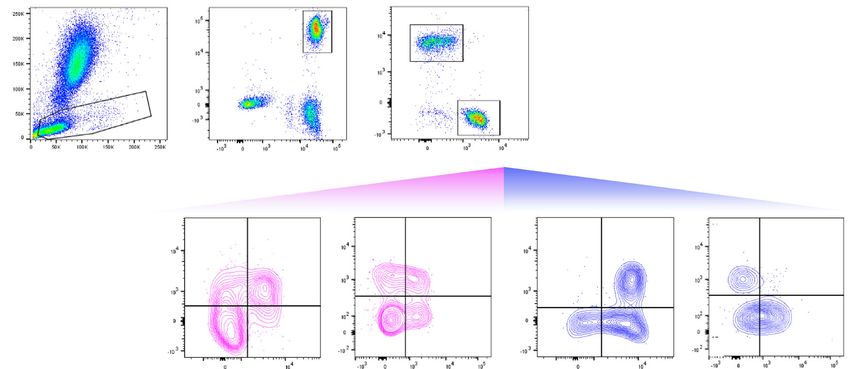
ARTICLE                                                                 NATURE COMMUNICATIONS | https://doi.org/10.1038/s41467-021-27745-z

mainly in maternal T cells and macrophages infiltrating the CAM               effects of SARS-CoV-2 infection on the maternal and neonatal
as well as their fetal stromal cells. Yet, the effect of SARS-CoV-2          immune system, we performed RNA-sequencing of maternal
on fetal T cells is minimal in our largely asymptomatic population.          blood and cord blood from cases and controls (Fig. 6a). The
                                                                             transcriptomes of maternal and cord blood were correlated
                                                                             (Spearman’s ρ = 0.24; p < 0.001); therefore, some transcripts
Blood RNA sequencing reveals shared and distinct immune                      were shared between these two compartments (Fig. 6b). Yet,
responses to SARS-CoV-2 infection. To further decipher the                   specific non-shared genes were modulated in the maternal

6                NATURE COMMUNICATIONS | (2022)13:320 | https://doi.org/10.1038/s41467-021-27745-z | www.nature.com/naturecommunications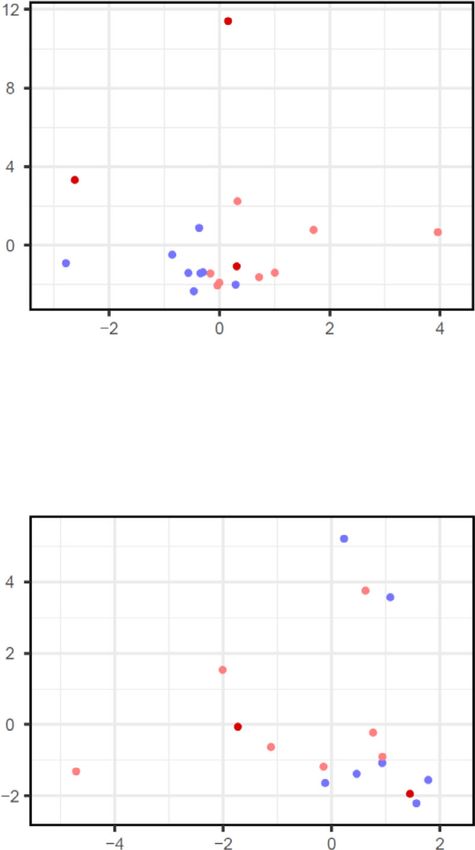
NATURE COMMUNICATIONS | https://doi.org/10.1038/s41467-021-27745-z                                                                    ARTICLE

Fig. 3 T-cell subsets in the maternal and cord blood of women with SARS-CoV-2 infection and their neonates. a Representative gating strategy used to
identify CD4+ and CD8+ T cells, and their respective subsets, within the total T-cell population (CD45+CD3+ cells) in the maternal blood and cord blood
from SARS-CoV-2 (+) or control women. b Numbers of CD4+ T cells, CD4+ TCM, CXCR3+CCR6+ Th1-like cells, and CXCR3+CCR6- Th1-like cells (upper
row); and numbers of CD8+ T cells, CD8+ TCM, CD8+ TEM, and Tc17-like cells (lower row) in the maternal blood [n = 10 control, 11 SARS-CoV-2 (+)]. c
Numbers of CD4+ T cells, CD4+ TCM, CXCR3+CCR6+ Th1-like cells, and CXCR3+CCR6− Th1-like cells (upper row); and numbers of CD8+ T cells, CD8+
TCM, CD8+ TEM, and Tc17-like cells (lower row) in the cord blood [n = 9 control, 8 SARS-CoV-2 (+)]. Data are shown as boxplots where midlines indicate
medians, boxes indicate interquartile range and whiskers indicate minimum/maximum range. Blue dots indicate control women, light red dots indicate
SARS-CoV-2 (+) women, and dark red dots indicate women with severe COVID-19. Differences between groups were evaluated by two-sided
Mann–Whitney U-tests, where p < 0.05 is considered significant.

blood and cord blood (Fig. 6b). Specifically, SARS-CoV-2                         from women with SARS-CoV-2 infection (Supplementary
infection was associated with the dysregulation of 425 tran-                    Fig. 8b, c).
scripts in maternal blood: 165 upregulated and 260 down-                           Subsequently, we investigated the presence of viral RNA in the
regulated (Fig. 6c and Supplementary Data 2). The biological                    CAM, BP, and PV using RT-qPCR for the N1 and N2 viral genes
processes enriched in the upregulated DEGs in maternal blood                    (Supplementary Fig. 10a). SARS-CoV-2 N1 and N2 proteins were
included humoral responses such as complement activation,                       not detected in any of the placental samples from women with
adaptive immune responses, and immunoglobulin-mediated                          SARS-CoV-2 infection or healthy controls (Supplementary
immune response, whereas those enriched in downregulated                        Fig. 10b). Yet, in the spike-in positive control, N1 and N2 RNA
DEGs included phagocytosis and extracellular matrix organi-                     was detected in the CAM, BP, and PV (Supplementary Fig. 10b).
zation (Fig. 6d). KEGG pathway analysis of DEGs in the                          A sensitivity assay revealed that 10 is the minimum confident
maternal blood revealed enrichment for protein digestion and                    copy number of viral particles detectable in the PV using RT-
absorption pathways (Supplementary Data 3). Similarly, SARS-                    qPCR (Supplementary Fig. 10c).
CoV-2 infection caused the dysregulation of 425 transcripts in                     Next, we determined whether the spike and nucleocapsid proteins
the cord blood: 131 upregulated and 294 downregulated (Fig. 6c                  were detected in the placental tissues of women with SARS-CoV-2
and Supplementary Data 4). The biological processes enriched                    infection using immunohistochemistry (Fig. 7a). Several histological
in the upregulated DEGs in cord blood included defense                          slides from the CAM, BP, and PV were included in our evaluation,
responses to fungus and bacterium, and no significant biolo-                     including negative and spike-in positive controls (Supplementary
gical processes were enriched in the downregulated DEGs                         Table 3). Both SARS-CoV-2 spike and nucleocapsid proteins were
(Fig. 6e). KEGG pathway analysis of DEGs in the cord blood                      identified in the spike-in positive controls in the CAM, PV, and BP
did not show significant enrichment (Supplementary Data 5).                      (Fig. 7b). A few of the placentas from asymptomatic women with
Interaction analysis revealed that SARS-CoV-2 infection                         SARS-CoV-2 infection displayed a putative positive signal for the
induced significantly different responses in the maternal blood                  spike and nucleocapsid proteins (Fig. 7c); yet, in all other cases, the
compared to the cord blood for 34 genes (Supplementary                          placental tissues were negative for the SARS-CoV-2 proteins
Data 6). These genes were enriched for cellular and humoral                     (Fig. 7d). As expected, spike and nucleocapsid SARS-CoV-2 proteins
biological processes such as phagocytosis and complement                        were not detected in the placental tissues of control women (Fig. 7e).
activation in the maternal blood compared to the cord blood                     To verify the detection of SARS-CoV-2 in the placental tissues, RNA
(Supplementary Fig. 9).                                                         was isolated from the same FFPE tissue sections where the putative
   To integrate the maternal and neonatal immune responses with                 positive signals were observed as well as those from some cases with
those observed in the placental tissues, a correlation analysis was             negative signals, and RT-qPCR for the N1 and N2 viral genes was
performed between bulk RNA-seq blood data and scRNA-seq                         performed. FFPE tissue sections from the placental tissues of control
placental data (Fig. 6f). Notably, CAM maternally derived                       women and spike-in positive controls were also included. None of
scRNA-seq signatures of T cell, Macrophage-2, and Monocyte                      the placentas from women with SARS-CoV-2 infection or controls
were correlated with the maternal blood transcriptome, and the                  had detectable levels of N1 and N2 RNA viral genes; yet, the spike-in
PVBP fetally derived scRNA-seq T cell signature was negatively                  positive controls were detected (Fig. 7f).
correlated with the cord blood transcriptome (Fig. 6g).                            Collectively, these RT-qPCR and histologic data show that
   Collectively, these results indicate that SARS-CoV-2 infection               SARS-CoV-2 is not detected in the placental tissues, including the
differentially impacts the transcriptome of the mother and the                  CAM, of women infected with SARS-CoV-2.
neonate and that such changes are partly shared with those in the
placental tissues. These findings also suggest that, although SARS-              SARS-CoV-2 infection during pregnancy does not compromise
CoV-2 infection does not trigger fetal hematopoietic immune                     the sterility of the placenta. The traditional view is that the
responses in the placenta as evidenced by our scRNA-seq data, it                placenta is a sterile organ that is first colonized by vaginal
affects the neonatal immune system.                                             microbes during delivery.39,40 However, the sterility of the pla-
                                                                                centa could be compromised by microorganisms invading from
                                                                                the lower genital tract (i.e., ascending infection) and those present
SARS-CoV-2 RNA and proteins are not detected in the pla-                        in the maternal circulation (i.e., hematogenous infection).41,42
centas of infected women. SARS-CoV-2 induced unique                             Therefore, we evaluated whether infection with the SARS-CoV-2
maternal immune and fetal stromal responses in the extra-                       virus, which can be detected in vaginal fluid15 or the peripheral
placental membranes; therefore, we explored whether this virus                  circulation,43 could compromise the sterility of the placenta.
was present in the placenta. First, using a scRNA-seq approach,                 Specifically, we used 16S rRNA gene qPCR and sequencing to
Viral-Track38, we explored whether viral sequences were detec-                  characterize the bacterial DNA load and profiles of the
ted in the scRNA-seq data of CAM and PVBP from women with                       amnion–chorion interface of the extraplacental CAM, the
SARS-CoV-2 infection. SARS-CoV-2 viral sequences were                           amnion–chorion interface of the placental disc, and the placental
detected in positive controls (bronchoalveolar lavage of patients               villous tree (Fig. 8a). As expected, mode of delivery was the
infected with SARS-CoV-238) but not in the placental tissues                    principal factor affecting the bacterial DNA load (Supplementary

NATURE COMMUNICATIONS | (2022)13:320 | https://doi.org/10.1038/s41467-021-27745-z | www.nature.com/naturecommunications                              7
ARTICLE NATURE COMMUNICATIONS | https://doi.org/10.1038/s41467-021-27745-z
CAM - Control
B cell
b
a CTB
Decidual 10
10 Endometrial
EVT-1
EVT-2 5
5 Fibroblast
UMAP_2
UMAP_2
LED
Macrophage-1 0
0
Macrophage-2
Monocyte
NK cell -5
-5
npiCTB
STB
-10 Stromal-1 -10
Stromal-2
Stromal-3
-15 T cell
-10 -5 0 5 10
c UMAP_1 CAM - SARS-CoV-2 (+)
CAM PVBP
T cell
Stromal-3 10
Stromal-2
Stromal-1
STB 5
npiCTB Control
NK cell
UMAP_2
Monocyte
SARS-CoV-2 (+)
0
Macrophage-2
Macrophage-1
LED
Fibroblast -5
EVT-2
EVT-1
Endometrial -10
Decidual
CTB
B cell
0 5000 10000 15000 0 5000 10000 15000
Count Count
d PVBP - Control
10
5
UMAP_2
0
-5
-10
e CAM PVBP
10.0 10.0
B cell
7.5 7.5 CTB PVBP - SARS-CoV-2 (+)
Decidual
Fetal
Fetal
5.0 5.0 Endometrial
10
EVT-1
EVT-2
2.5 2.5
Observed – log10(p)
Fibroblast 5
LED
UMAP_2
0.0 0.0 Macrophage-1
10.0 10.0 Macrophage-2 0
Monocyte
7.5 7.5 NK cell
-5
npiCTB
Maternal
Maternal
5.0 5.0
STB
Stromal-1 -10
Stromal-2
2.5 2.5
Stromal-3
T cell
0.0 0.0
-10 -5 0 5 10
0 1 2 3 4 0 1 2 3 4 UMAP_1
Expected – log10(p)
Table 4) and profile. Very few samples (4/15) from cesarean of technical controls, those from vaginal deliveries were distinct,
deliveries had a bacterial DNA load exceeding that of technical being dominated by DNA signals from Lactobacillus and Urea-
controls for background DNA contamination (i.e., blank DNA plasma, similar to the vaginal swab positive controls (Fig. 8c).
extraction kits), yet almost all of the samples (29/30) from vaginal Among the samples obtained from vaginal deliveries, there was
deliveries did (Fig. 8b). Furthermore, whereas the bacterial DNA no difference in the bacterial DNA profiles based on maternal
profiles of samples from cesarean deliveries were similar to those SARS-CoV-2 infection status (Fig. 8d). These findings show that,
8 NATURE COMMUNICATIONS | (2022)13:320 | https://doi.org/10.1038/s41467-021-27745-z | www.nature.com/naturecommunications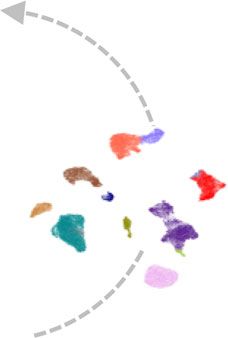
NATURE COMMUNICATIONS | https://doi.org/10.1038/s41467-021-27745-z                                                                       ARTICLE

Fig. 4 Single-cell transcriptomics of the placental tissues from women with SARS-CoV-2 infection. a Uniform Manifold Approximation and Projection
(UMAP) plot showing the combined cell type classifications of the chorioamniotic membranes (CAM) and placental villi and basal plate (PVBP) from
SARS-CoV-2 (+) (n = 9) or control women (n = 10), where each dot represents a single cell. Abbreviations used are CTB cytotrophoblast, EVT extravillous
trophoblast, LED lymphoid endothelial decidual cell, npiCTB non-proliferative interstitial cytotrophoblast, STB syncytiotrophoblast. b UMAP plots showing
cell populations separated based on placental compartment (CAM and PVBP) from SARS-CoV-2 (+) or control women. c Bar plots showing the numbers
of each cell type in the CAM and PVBP of SARS-CoV-2 (+) or control women. d Numbers of differentially expressed genes (DEGs) associated with SARS-
CoV-2 infection from the CAM and PVBP with false discovery rate (FDR) adjusted p < 0.1. e Quantile–quantile (Q–Q) plots showing the differential
expression of all tested genes in each cell type of maternal or fetal origin from the CAM and PVBP samples. Deviation above the 1:1 line (solid black line)
indicates enrichment.

although the mode of delivery alters the bacterial DNA loads and                reported in children with COVID-1951. Such activation may be
profiles of the placental tissues, we did not find evidence that the              attributed to the elevated concentrations of IL-8 in the cord blood
same is true for maternal SARS-CoV-2 infection.                                 since this cytokine can activate neutrophils52, suggesting that
                                                                                neonates born to women with SARS-CoV-2 infection display a
                                                                                mild neutrophil response. Even a seemingly mild immune
Discussion                                                                      response should not be overlooked as viral infections during
This study provides evidence that, in a largely asymptomatic                    pregnancy (influenza, Zika virus, etc.) have historically resulted in
population, SARS-CoV-2 infection in pregnancy is primarily asso-                adverse long-term outcomes53,54. Pertinent to this concept, ele-
ciated with maternal inflammatory responses in the circulation and               vated concentrations of IL-8 in newborns are associated with the
at the maternal–fetal interface. First, we showed that pregnant                 development of encephalopathies55.
women with SARS-CoV-2 infection had elevated levels of IgM and                     A hallmark of SARS-CoV-2 infection is lymphopenia, which is
IgG in the peripheral circulation, whereas only IgG was detectable in           primarily reflected in the T-cell compartment56–58, but not con-
the cord blood of their neonates, suggesting that acute fetal infection         sistently observed for B cells59. Specifically, patients with sympto-
did not occur. This finding is consistent with several reports showing           matic COVID-19 displayed reduced numbers of CD4+ and CD8+
that IgM is undetected in the cord blood of neonates born to women              T-cell subsets including naïve, central memory, and effector memory
with SARS-CoV-2 infection26,44. However, few studies have                       cells31,58,60. Lymphopenia is also correlated with COVID-19 disease
demonstrated that both IgM and IgG are detectable in a small                    severity, as critically ill patients showed the lowest numbers of total
fraction of neonates born to women diagnosed with COVID-                        lymphocytes, including T cells, compared to asymptomatic
1915,23,27. The increased levels of IgG in the cord blood are explained         individuals61. Yet, asymptomatic or mildly ill pregnant women seem
by the fact that this immunoglobulin crosses the placenta via the               to have slightly reduced lymphocyte numbers when compared to
neonatal Fc receptor (FcRn), which is highly expressed in the syn-              healthy controls62. Indeed, a recent single-center study showed that
cytiotrophoblast layer45. Yet, it has been recently reported that, in           80% of pregnant women with mild or asymptomatic SARS-CoV-2
the third trimester, the mechanisms whereby SARS-CoV-2-specific                  infection displayed lymphopenia63. Consistently, we found that
IgG1 crosses the placenta are compromised due to altered glycosy-               pregnant women with SARS-CoV-2 infection had reduced T-cell
lation profiles46. By contrast, IgM cannot cross the placenta given its          numbers compared to healthy controls, which included specific
large molecular weight, thus the detection of this immunoglobulin in            subsets such as CD4+ TCM, Th1-like, CD8+ TEM, and Tc17-like cells.
the cord blood represents an acute fetal response in the clinical               Both Th1 and Tc17 cells participate in orchestrating pro-
setting47. Therefore, the absence of detectable IgM in the cord blood           inflammatory responses in health and disease64,65. During preg-
suggests that vertical transmission in utero of SARS-CoV-2 was                  nancy, these T-cell subsets are implicated in the establishment and
unlikely to occur in our study population.                                      maintenance of maternal–fetal tolerance, which plays a central role in
   In the current study, we report that pregnant women mount a                  pregnancy success66–68. Hence, these results indicate that SARS-
mild systemic inflammatory response to SARS-CoV-2 char-                          CoV-2 infection alters specific pro-inflammatory T-cell subsets in the
acterized by increased concentrations of IL-8, IL-10, and IL-15,                maternal circulation, which may compromise the mechanisms of
which is consistent with observations in non-pregnant individuals               maternal–fetal tolerance.
with SARS-CoV-2 infection29. Interestingly, we found that both                     Concurrent with the cellular and humoral immune changes
SARS-CoV-2-infected mothers and their neonates had increased                    occurring in the periphery of pregnant women with SARS-CoV-2
levels of IL-8 in their circulation. Interleukin-8 is a canonical pro-          infection, maternal T-cell responses in the CAM were also altered, as
inflammatory cytokine whose primary function is neutrophil                       revealed by our scRNA-seq data. Maternal T cells reside at the
recruitment to sites of injury.48 Relevant to this investigation,               maternal–fetal interface and their abundance changes as gestation
recent studies have proposed that IL-8 can serve as a biomarker                 progresses68. This T-cell compartment comprises multiple subsets,
for the prediction of disease severity and survival prognosis of                including effector/activated T cells, regulatory T cells, and exhausted
patients infected with SARS-CoV-249. Taken together, these data                 T cells68. In addition, these adaptive immune cells can participate in
indicate that SARS-CoV-2 infection not only causes a maternal                   the processes of labor by releasing inflammatory mediators such as
cytokine response but also induces neonatal inflammation, which                  TNF, IL-1β, and MMP-969. The importance of T cells in the process
can lead to long-term morbidities. Yet, the mechanisms whereby                  of labor is underscored by observations showing that their single-cell
maternal SARS-CoV-2 infection elicits cytokine responses in the                 signatures can be detected in the maternal circulation, providing a
fetal/neonatal circulation require further investigation. A possi-              non-invasive approach to monitor pregnancy and its
bility is that the increased concentrations of IL-8 in the cord                 complications36. Consistent with these findings, herein we demon-
blood are explained by the transfer of maternal cytokines through               strated that the single-cell signature of maternal T cells in the CAM
the placental tissues, a process that has been documented in vivo               from SARS-CoV-2-infected pregnant women resembled that of
for other pro-inflammatory cytokines50.                                          peripheral T cells from non-pregnant infected patients (obtained
   Interestingly, neonates born to SARS-CoV-2-infected women                    from a previously reported dataset37) and, more importantly, cor-
displayed dysregulated immune and non-immune processes                          related with the cellular transcriptome of women infected with
including the activation of neutrophils, which was previously                   SARS-CoV-2. These results suggest that both systemic and local

NATURE COMMUNICATIONS | (2022)13:320 | https://doi.org/10.1038/s41467-021-27745-z | www.nature.com/naturecommunications                                  9
ARTICLE NATURE COMMUNICATIONS | https://doi.org/10.1038/s41467-021-27745-z
a c
Maternal origin Maternal origin Fetal origin
T cells in CAM T cells in PVBP T cells Macrophage-2 Stromal-1
2
4
2
Log10 (Expression)
3
log2FC
0 0
-2 2
-2
ρ = 0.27 Nominal ≥0.01 ρ = 0.009 Nominal ≥0.01
p = 0.004 NominalNATURE COMMUNICATIONS | https://doi.org/10.1038/s41467-021-27745-z ARTICLE Fig. 5 Single-cell characterization of major cell clusters in the chorioamniotic membranes (CAM) and placental villi and basal plate (PVBP) of women with SARS-CoV-2 infection. a Scatter plots showing the effects of SARS-CoV-2 on gene expression [log2 fold change (FC)] in maternal T cells from the CAM and PVBP compared to a previously reported dataset (Meckiff et al., 2020). Black dots represent genes with nominal p < 0.01 in this study, which were used to calculate Spearman’s correlation. b Forest plots showing the log2(FC) of differentially expressed genes (DEGs) associated with SARS-CoV-2 infection in Stromal-1, T cell, Macrophage-2, decidual, lymphoid endothelial decidual cell (LED), Monocyte, and extravillous trophoblast (EVT-1) cell types in the CAM and PVBP of SARS-CoV-2 (+) (n = 9) or control women (n = 10). DEGs shown are significant after false discovery rate (FDR) adjustment (q < 0.1). c Violin plots showing the distribution of single-cell gene expression levels for the top six DEGs in the maternal T cell, maternal Macrophage-2, and fetal Stromal-1 cell types in the CAM comparing SARS-CoV-2 (+) and control women. d Kyoto Encyclopedia of Genes and Genomes (KEGG) pathways enriched for DEGs in the maternal (M) cell types (decidual, T cells, and Macrophage-2) and fetal (F) Stromal-1 cell type from the CAM based on the over-representation analysis. A one-sided Fisher’s exact test was used. KEGG pathways with q < 0.05 were selected. NATURE COMMUNICATIONS | (2022)13:320 | https://doi.org/10.1038/s41467-021-27745-z | www.nature.com/naturecommunications 11
ARTICLE                                                                   NATURE COMMUNICATIONS | https://doi.org/10.1038/s41467-021-27745-z

Fig. 6 Bulk transcriptomics in the maternal and cord blood of women with SARS-CoV-2 infection and their neonates. a Maternal blood [n = 10 control,
11 SARS-CoV-2 (+)] and cord blood [n = 8 control, 9 SARS-CoV-2 (+)] were collected for RNA sequencing (RNA-seq). b Scatter plot showing the log2
fold changes (FC) identified between SARS-CoV-2 (+) and control women that are similar or different between the maternal blood (x-axis) and cord blood
(y-axis). A two-sided Spearman’s correlation test was used. Each dot represents a gene tested (in pink DEG for the maternal blood only, in green DEG for
the cord blood only, in purple DEG for both compartments and same direction, gray if otherwise not significant). c Volcano plots showing the adjusted p-
values (-log10 thereof) on the y-axis and log2 fold change with SARS-CoV-2 infection on the x-axis in the maternal and cord blood. The number of
upregulated and downregulated genes were determined based on fold change > 1.25 and adjusted p value < 0.1. Bar plots showing the top 10 over-
represented biological processes from the Gene Ontology (GO) database based on upregulated (top panel; red bars) and downregulated (bottom panel;
blue bars) DEGs associated with SARS-CoV-2 infection with adjusted p value < 0.05 in the d maternal blood and e cord blood. NS not significant. The p-
values were computed based on one-sided hypergeometric distribution and adjusted by false-discovery rate. f Comparative analyses were performed
between bulk transcriptomic data of the maternal blood and cord blood and scRNA-seq data from the placental tissues using DEG from the bulk analysis
(q < 0.1). g Scatter plots (pink boxes) showing cell-type-specific Spearman correlations between bulk RNA-seq data from the maternal blood and scRNA-
seq data from the chorioamniotic membranes (CAM) for the T cell, Macrophage-2, and Monocyte populations of maternal origin. A two-sided Spearman’s
correlation test was used. Scatter plot (green box) showing the cell type-specific Spearman correlation between bulk RNA-seq data from the cord blood
and scRNA-seq data from the placental villi and basal plate (PVBP) for the T cell population of fetal origin.

pregnancy complications (e.g., preterm birth71) and maintenance72,             maternal SARS-CoV-2 infection did not modify such signatures.
respectively. In the current study, the processes and pathways                 Hence, SARS-CoV-2 infection does not affect placental sterility in
enriched in these tissue-resident innate immune cells included                 mostly asymptomatic women who delivered a term neonate.
cytokine-cytokine receptor interaction, highlighting the role of                  It is worth mentioning that the cross-sectional design of this
macrophages in the inflammatory response against SARS-CoV-2                     study has inherent limitations. For example, the diagnosis of
infection73. Notably, single-cell signatures of maternal macrophages           SARS-CoV-2 infection in pregnant women was performed at the
positively correlated with the whole-blood transcriptome of women              time of admission to the Labor and Delivery unit, and although
with SARS-CoV-2 infection, which was enriched for monocyte/                    our cases had elevated systemic concentrations of IgM (a sign of
macrophage-driven processes such as the classical pathway of                   acute infection), our findings do not allow us to infer a timeline of
complement activation. Indeed, such a humoral innate immune                    severity or disease progression. Furthermore, our conclusions
response is implicated in the pathogenesis of COVID-19.74.                     should be interpreted with caution since the number of severe
Therefore, in the choriodecidual space, maternal macrophages                   cases is limited due to the rarity of COVID-19 during
participate in both tissue homeostasis and host defense as                     pregnancy82. Nonetheless, our study represents the first mole-
demonstrated during SARS-CoV-2 infection herein.                               cular characterization of the immune effects of SARS-CoV-2
   Importantly, we report that, although SARS-CoV-2 infection                  during pregnancy in the mother, placenta, and offspring.
during pregnancy was neither associated with alterations in the                   In summary, we have shown that SARS-CoV-2 infection during
neonatal (cord blood) T-cell repertoire nor fetal hematopoietic                pregnancy primarily induces unique inflammatory responses at
immune responses in the placenta, the transcriptome of fetal                   the maternal–fetal interface, which are largely governed by
stromal cells in the CAM was profoundly impacted. Stromal cells                maternal T cells and fetal stromal cells. SARS-CoV-2 infection
play a central role in immunity by serving as physical barriers                during pregnancy was also associated with humoral and cellular
against microbes as well as actively participating in antigen pre-             immune responses in the maternal blood, as well as with a mild
sentation and T-cell responses.75 However, the functions of fetal              cytokine response in the neonatal circulation (i.e., umbilical cord
stromal cells are largely unknown, thus our findings represent the              blood) without compromising the T-cell repertoire or initiating
first insight into the involvement of these cells in viral infection.           IgM responses. Importantly, SARS-CoV-2 was not detected in the
Yet, fetal innate and adaptive immune cells in the placenta were               placentas of infected women, nor was the sterility of the placenta
minimally affected by maternal SARS-CoV-2 infection. These                     compromised by this virus. This study provides insight into the
observations are in tandem with the absence of SARS-CoV-2                      maternal–fetal immune responses triggered by SARS-CoV-2 and
transcripts/proteins in the placental tissues as well as undetectable          further emphasizes the rarity of placental infection.
IgM in the cord blood. Our results are in agreement with numerous
reports showing that SARS-CoV-2 is undetected in the placenta23,
amniotic fluid76, and neonates23,26,76. Yet, SARS-CoV-2 has been                Methods
reported in the placentas of severe COVID-19 patients14,25, indi-              Human participants, clinical specimens, and definitions. Human maternal
cating that this virus can on rare occasions reach and infect this             peripheral blood, umbilical cord blood, and placental tissues were obtained at the
                                                                               Perinatology Research Branch, an intramural program of the Eunice Kennedy
organ. Therefore, the absence of SARS-CoV-2 in the CAM, PV,                    Shriver National Institute of Child Health and Human In Development (NICHD),
and BP of our mostly asymptomatic study population is in                       National Institutes of Health, U.S. Department of Health and Human Services,
accordance with the known scarcity of placental infection77.                   Wayne State University (Detroit, MI, USA), and the Detroit Medical Center (DMC)
   Traditionally, the placenta is considered a sterile organ39,40.             (Detroit, MI, USA). The collection and use of human materials for research pur-
                                                                               poses were approved by the Institutional Review Boards of Wayne State University
Indeed, recent research has reiterated the sterile womb hypothesis
                                                                               School of Medicine and the Detroit Medical Center. All participating women pro-
using placentas from women who delivered via cesarean section                  vided written informed consent prior to sample collection. The study groups were
at term without labor78,79 as well as studies in mice80 and non-               divided into pregnant women who had a positive RT-PCR test for SARS-CoV-2
human primates81. Here, we evaluated the possibility that                      (nasopharyngeal test provided by the Detroit Medical Center) and healthy gesta-
maternal SARS-CoV-2 infection compromises the sterility of the                 tional age-matched controls. The demographic and clinical characteristics of the
                                                                               study groups are shown in Supplementary Table 1. The maternal peripheral blood
placenta by facilitating the invasion of bacteria or the transfer of           was collected at admission, prior to the administration of any medication, and the
bacterial DNA from maternal compartments. Consistent with our                  umbilical cord blood and placental tissues were collected immediately after delivery.
previous studies78, the placentas of women who delivered via                       Gestational age was established based on the last menstrual period and
cesarean section did not consistently harbor a microbiome.                     confirmed by ultrasound examination. Labor was defined as the presence of regular
                                                                               uterine contractions with a frequency of ≥2 times every 10 min and cervical
Women who delivered vaginally displayed placental bacterial                    ripening. Term delivery was defined as birth ≥37 weeks of gestation. Preeclampsia
signatures similar to those from the lower genital tract; yet,                 was defined as new-onset hypertension that developed ≥20 weeks of gestation and

12                 NATURE COMMUNICATIONS | (2022)13:320 | https://doi.org/10.1038/s41467-021-27745-z | www.nature.com/naturecommunications
NATURE COMMUNICATIONS | https://doi.org/10.1038/s41467-021-27745-z ARTICLE
a
Basal plate
(BP)
Placental Detection of
villi (PV) SARS-CoV-2
Immunodetection of Nucleic acid detection of
SARS-CoV-2 proteins SARS-CoV-2 by RT-qPCR
Chorioamniotic
membranes (CAM)
Spike protein from SARS-CoV-2 Nucleocapsid protein from SARS-CoV-2
PV BP CAM PV BP CAM
b
positive signal
Spike positive
control with
c
SARS-CoV-2 (+)
positive signal
with putative
d
women with negative signal
SARS-CoV-2 (+) pregnant
e
Healthy pregnant women
with negative signal
f PV BP CAM
0 0 0
Key:
10 Severe COVID-19 10 Severe COVID-19 10 Severe COVID-19
N1
Cq value
20 20 20 N2
30 30 30 RP
40 40 40
50 50 50
Below detection limit Below detection limit Below detection limit
Spike
Spike
Spike
1 2 3 4 5 1 2 3 4 5 6 7 8 9 10 1 2 3 4 5 1 2 3 4 5 6 7 8 9 10 1 2 3 4 5 1 2 3 4 5 6 7 8 9 10
Control SARS-CoV-2 (+) Control SARS-CoV-2 (+) Control SARS-CoV-2 (+)
proteinuria. Other clinical and demographic characteristics were obtained by disc. Acute and chronic inflammatory lesions of the placenta (maternal inflammatory
review of medical records. response and fetal inflammatory response), as well as other placental lesions, were
diagnosed according to established criteria83, as shown in Supplementary Table 1.
Placental histopathological examination. Placentas were examined histologically
by perinatal pathologists according to standardized DMC protocols. Briefly, three to Immunoassays
nine sections of the placenta were examined, and at least one full-thickness section was Immunoglobulin (Ig) M and G determination in the maternal blood and umbilical
taken from the center of the placenta; others were taken randomly from the placental cord blood. Maternal peripheral blood and umbilical cord blood were collected into
NATURE COMMUNICATIONS | (2022)13:320 | https://doi.org/10.1038/s41467-021-27745-z | www.nature.com/naturecommunications 13ARTICLE NATURE COMMUNICATIONS | https://doi.org/10.1038/s41467-021-27745-z
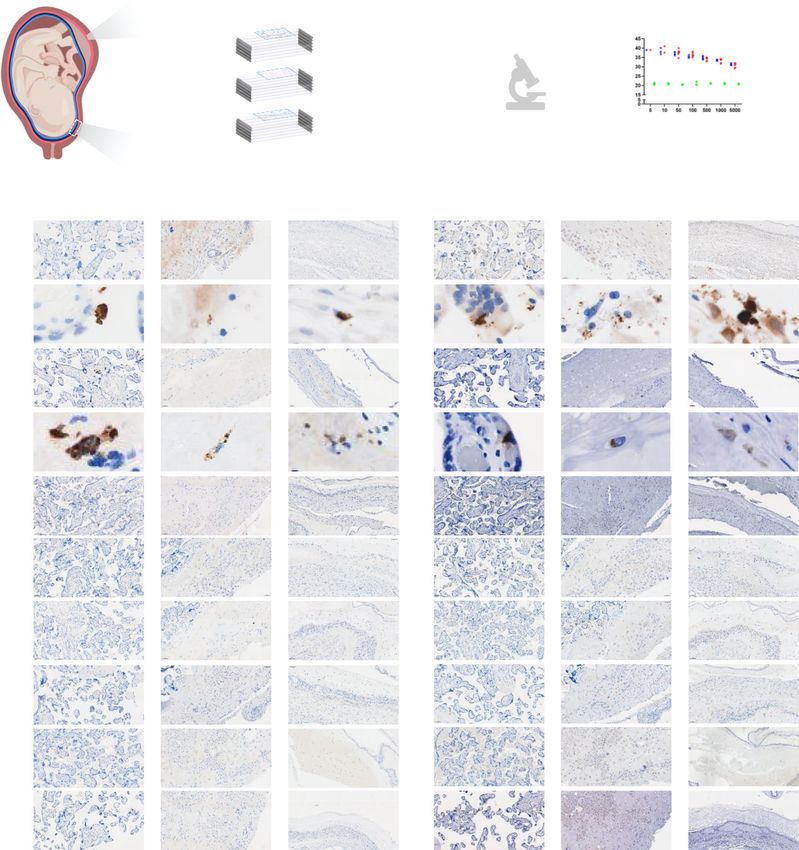
Fig. 7 Immunohistological and molecular detection of SARS-CoV-2 proteins/RNA in placentas of women with SARS-CoV-2 infection. a Schematic
representation showing various sampling locations in the placental villi (PV), basal plate (BP), and chorioamniotic membranes (CAM) of SARS-CoV-2 (+)
or control women that were evaluated for SARS-CoV-2 protein detection by immunohistochemistry, followed by RNA viral detection using RT-qPCR [n = 5
control, 10 SARS-CoV-2(+)] (see Supplementary Table 3). b Images showing a positive signal for SARS-CoV-2 spike (left panel) and nucleocapsid (right
panel) proteins in the PV, BP, and CAM of spike-in positive control. c Images showing a putative positive signal for SARS-CoV-2 spike (left panel) and
nucleocapsid (right panel) proteins in the PV, BP, and CAM of a SARS-CoV-2 (+) woman. Images are representative of two independent experiments. d
Three representative images showing a negative signal for SARS-CoV-2 spike (left panel) and nucleocapsid (right panel) proteins in the PV, BP, and CAM
of SARS-CoV-2 (+) women (n = 10). e Three representative images showing a negative signal for SARS-CoV-2 spike (left panel) and nucleocapsid (right
panel) proteins in the PV, BP, and CAM of control women (n = 5). Brown staining indicates a putative positive signal. All images were taken at 200×
magnification. Scale bars represent 100 µm (or 5 µm for digital zoom-in images). f SARS-CoV-2 viral RNA detection by RT-qPCR in the PV, BP, and CAM
from histological slides of SARS-CoV-2 (+) (n = 10) and control women (n = 5). N1 (green dot/triangle) and N2 (purple dot/triangle) denote two SARS-
CoV-2 nucleocapsid (N) genes, and RP (blue dot/triangle) denotes the human RNase P gene, which serves as a positive internal PCR control. Triangles
indicate women with severe COVID-19. Spike-in positive controls were also included. Undetermined quantification cycle (Cq) values are represented below
the detection limit (gray area).
tubes without an anticoagulant, and the tubes were stored at room temperature for containing 1:250 of ROS assay stain and ROS assay buffer [both from the ROS
30–60 min prior to centrifugation for 10 min at 1600×g and 4 °C. After cen- assay kit (eBioscience, San Diego, CA, USA)] and 1 µL of phorbol myristate acetate
trifugation, the serum was collected and stored at −80 °C. The serum concentra- (PMA; 3 µg/mL) (Millipore Sigma, Burlington, MA, USA). The unstimulated group
tions of SARS-CoV-2 IgM and IgG were determined using the human anti-SARS- received 1:250 ROS assay mix and 1× phosphate-buffered saline (PBS) (Thermo
CoV-2 IgM and human anti-SARS-CoV-2 IgG ELISA kits (LifeSpan BioSciences, Fisher Scientific/Gibco, Grand Island, NY, USA). The cells were incubated at 37 °C
Inc., Seattle, WA, USA), according to the manufacturer’s instructions. Plates were with 5% CO2 for 60 min. Following incubation, erythrocytes were lysed using
read using the SpectraMax iD5 (Molecular Devices, San Jose, CA, USA) and ammonium–chloride–potassium (ACK) lysing buffer (Lonza, Walkersville, MD,
analyte concentrations were calculated with the SoftMax Pro 7 (Molecular Devi- USA), and the resulting leukocytes were collected after centrifugation at 300×g for
ces). The sensitivities of the assays were 0.469 ng/mL (human anti-SARS-CoV-2 5 min. Next, leukocytes were resuspended in 0.5 mL of 1× PBS and acquired using
IgM) and 2.344 ng/mL (human anti-SARS-CoV-2 IgG). the BD LSRFortessa flow cytometer and FACSDiva 6.0 software to measure ROS
production by neutrophils and monocytes. The analysis and figures were per-
Determination of cytokine and chemokine concentrations in the maternal blood and formed using the FlowJo software version 10.
umbilical cord blood. Maternal peripheral blood and umbilical cord blood were
collected into tubes with an anticoagulant (EDTA or citrate), which were cen-
trifuged for 10 min at 1600×g and 4 °C. Upon centrifugation, the plasma was Single-cell RNA sequencing
collected and stored at −80 °C prior to cytokine/chemokine determination. The Preparation of single-cell suspensions. Single-cell suspensions were prepared from
V-PLEX Pro-Inflammatory Panel 1 (human) and Cytokine Panel 1 (human) the BP, PV, and CAM, as previously described with modifications36. Digestion of
immunoassays (Meso Scale Discovery, Rockville, MD, USA) were used to measure placental tissues was performed using collagenase A (Sigma Aldrich, St. Louis, MO,
the concentrations of IFN-γ, IL-1β, IL-2, IL-4, IL-6, IL-8, IL-10, IL-12p70, IL-13, USA) or the enzyme cocktail from the Umbilical Cord Dissociation Kit (Miltenyi
and TNF (Pro-inflammatory Panel 1) or GM-CSF, IL-1α, IL-5, IL-7, IL-12/IL- Biotec, San Diego, CA, USA). Next, tissue suspensions were washed with 1× PBS
23p40, IL-15, IL-16, IL-17A, TNF-β, and VEGF-A (Cytokine Panel 1) in the and filtered through a cell strainer (Miltenyi Biotec). Cell pellets were collected after
maternal and cord blood plasma, according to the manufacturer’s instructions. centrifugation at 300×g for 10 min at 20 °C. Erythrocytes were lysed using ACK
Plates were read using the MESO QuickPlex SQ 120 (Meso Scale Discovery) and lysing buffer and the reaction was stopped by washing with 0.04% bovine serum
analyte concentrations were calculated with the Discovery Workbench 4.0 (Meso albumin (Sigma Aldrich) in 1× PBS. Then, the cell pellets were collected after
Scale Discovery). The sensitivities of the assays were 0.21–0.62 pg/mL (IFN-γ), centrifugation at 300×g for 10 min at 20 °C and resuspended in 1× PBS for cell
0.01–0.17 pg/mL (IL-1β), 0.01–0.29 pg/mL (IL-2), 0.01–0.03 pg/mL (IL-4), 0.05- counting using an automatic cell counter (Cellometer Auto 2000; Nexcelom
0.09 pg/mL (IL-6), 0.03-0.14 pg/mL (IL-8), 0.02-0.08 pg/mL (IL-10), 0.02-0.89 pg/ Bioscience, Lawrence, MA). Dead cells were removed from the cell suspensions
mL (IL-12p70), 0.03-0.73 pg/mL (IL-13), 0.01–0.13 pg/mL (TNF), 0.08–0.19 pg/mL using the Dead Cell Removal Kit (Miltenyi Biotec) to obtain a final cell viability
(GM-CSF), 0.05–2.40 pg/mL (IL-1α), 0.04–0.46 pg/mL (IL-5), 0.08–0.17 pg/mL of ≥80%.
(IL-7), 0.25–0.42 pg/mL (IL-12/IL-23p40), 0.09–0.25 pg/mL (IL-15), 0.88–9.33 pg/
mL (IL-16), 0.19–0.55 pg/mL (IL-17A), 0.04–0.17 pg/mL (TNF-β), 0.55–6.06 pg/ Single-cell library preparation using the 10× Genomics platform. Viable cells were
mL (VEGF-A). used for single-cell RNA-seq library preparation following the protocol for the 10×
Genomics Chromium Single Cell 3′ Gene Expression Version 3 Kit (10× Genomics,
Immunophenotyping of maternal and cord blood leukocytes. Maternal peripheral Pleasanton, CA, USA). Briefly, cell suspensions were loaded into the Chromium
blood and umbilical cord blood were collected into tubes containing EDTA. Fifty Controller to generate gel beads in emulsion (GEM), each containing a single cell
microlitres of whole blood were incubated with fluorochrome-conjugated anti- and a single Gel Bead with barcoded oligonucleotides. Reverse transcription of
human mAbs (Supplementary Table 5) for 30 min at 4 °C in the dark. After mRNA into complementary (c)DNA was performed using the Veriti 96-well
incubation, erythrocytes were lysed using BD FACS lysing solution (BD Bios- Thermal Cycler (Thermo Fisher Scientific, Wilmington, DE, USA). The resulting
ciences, San Jose, CA, USA). For intracellular staining, erythrocyte lysis was not cDNA was purified using Dynabeads MyOne SILANE (10× Genomics) and the
performed and the cells were instead fixed and permeabilized using the BD Cytofix/ SPRIselect Reagent (Beckman Coulter, Indianapolis, IN, USA). cDNA amplicons
Cytoperm kit (BD Biosciences) prior to staining with intracellular fluorochrome- were optimized via enzymatic fragmentation, end-repair, and A-tailing followed by
conjugated anti-human mAbs (Supplementary Table 5). Finally, leukocytes were the incorporation of adapters and sample index by ligation. The sample index PCR
washed and resuspended in 0.5 mL of FACS staining buffer (BD Biosciences) and product was amplified using the Veriti 96-well Thermal Cycler. The Agilent
acquired using the BD LSRFortessa flow cytometer and FACSDiva 6.0 software. Bioanalyzer High Sensitivity Chip (Agilent Santa Clara, CA, USA) was used to
The absolute number of cells was determined using CountBright absolute counting analyze and quantify the final library construct. The Kapa DNA Quantification Kit
beads (Thermo Fisher Scientific/Molecular Probes, Eugene, OR, USA). The analysis for Illumina platforms (Kapa Biosystems, Wilmington, MA, USA) was used to
and figures were performed using the FlowJo software version 10 (FlowJo, Ashland, quantify the DNA libraries, following the manufacturer’s instructions.
OR, USA). Immunophenotyping included the identification of general leukocyte
populations (neutrophils, monocytes, T cells, B cells, and NK cells), monocyte Sequencing. 10× scRNA-seq libraries were sequenced on the Illumina NextSeq 500
subsets, neutrophil subsets, T-cell subsets, and B-cell subsets. Specifically, the in the Genomics Services Center (GSC) of the Center for Molecular Medicine and
numbers of effector memory T cells (TEM; CD3+CD4+/CD8+CD45RA−CCR7−), Genetics (Wayne State University School of Medicine, Detroit, MI, USA). The
naïve T cells (TN; CD3+CD4+/CD8+CD45RA+CCR7+), central memory T cells Illumina 75 Cycle Sequencing Kit (Illumina, San Diego, CA, USA) was used with
(TCM; CD3+CD4+/CD8+CD45RA−CCR7+), terminally differentiated effector 58 cycles for R2, 26 for R1, and 8 for I1.
memory T cells (TEMRA; CD3+CD4+/CD8+CD45RA+CCR7−), Th1/Tc1-like
T cells (CD3+CD4+/CD8+CXCR3+CCR6+/CCR6-), Th2/Tc2-like T cells Genotyping. DNA was extracted from maternal peripheral blood and umbilical cord
(CD3+CD4+/CD8+CXCR3−CCR6−), and Th17/Tc17-like T cells (CD3+CD4+/ blood/tissue using DNeasy Blood and Tissue Kit (Qiagen, Hilden, Germany), fol-
CD8+CXCR3-CCR6+) in maternal and cord blood are presented in Fig. 3. lowing manufacturer’s instructions modified with the addition of 4 µl RNase A
(100 mg/mL) (Qiagen) and incubation in 56 °C. Purified DNA samples were quan-
ROS production by neutrophils and monocytes. Fifty microlitres of maternal per- tified using QubitTM dsDNA HS Assay Kit (Invitrogen, Carlsbad, CA, USA). Two
ipheral blood and cord blood were stimulated with 50 µL of ROS assay mix platforms were used for genotyping: (i) low-coverage (~0.4×) whole-genome
14 NATURE COMMUNICATIONS | (2022)13:320 | https://doi.org/10.1038/s41467-021-27745-z | www.nature.com/naturecommunicationsYou can also read