Maryland Climate Bulletin April 2023 - MDSCO-2023-04 Prepared by Dr. Alfredo Ruiz-Barradas Maryland State Climatologist - UMD
←
→
Page content transcription
If your browser does not render page correctly, please read the page content below
MDSCO-2023-04

Maryland Climate Bulletin
              April 2023

                                                  Prepared by
                                    Dr. Alfredo Ruiz-Barradas
                                  Maryland State Climatologist

                             This publication is available from:
                       https://www.atmos.umd.edu/~climate/Bulletin/

 Sumant Nigam, Chair
Summary
Statewide averages show that April 2023 was warmer and wetter than normal (i.e., 1991-2020
averages). Monthly mean temperatures were 49 to 61°F; maximum temperatures were between 63
to 74°F, and minimum temperatures were in the 35 to 49°F range. Monthly total precipitation was
in the 2.6 to 5.9 inches range.
Maryland Regional Features (Figures 1-5, C1, and D1)

   •    Mean temperature was warmer than normal everywhere, notably in portions of southern
        Howard and northern Anne Arundel counties and Caroline, Dorchester, Wicomico, and
        Somerset counties (4.2°F and above).

   •    Maximum temperature was also warmer than normal everywhere, especially over Garrett
        and Allegany counties; Carroll, Baltimore, Montgomery, Howard, and Anne Arundel
        counties (5.0 to 5.6°F); and Dorchester and Wicomico counties (around 5.8°F).

   •    Minimum temperature was warmer than normal over most of the state, notably in portions
        of Montgomery, Baltimore, Howard, Anne Arundel counties, and smaller portions of
        Calvert, Saint Mary’s, Talbot, Dorchester, Somerset, and Worcester counties (above
        3.0°F). Large areas in Allegany and Garrett counties were colder than normal.

   •    Precipitation was below normal from Frederick to Garrett counties (‒2 inches in western
        Garrett) and over Harford and Cecil counties (‒1 in). Precipitation was above normal in
        the rest of the state, especially over the southern portions of Calvert and Saint Mary’s
        counties, Dorchester, and portions of Caroline, Wicomico, Somerset, and Worcester
        counties, by 2 in and more.

   •    The extent of the surface in the state under drought conditions diminished from around
        68% in March to 53% at the end of April. Since February, the continuous below-normal
        precipitation from Washington to Garrett counties has finally imposed abnormally dry
        conditions in this region. However, the above-normal precipitation over the eastern and
        western shores cleared most of the eastern shore’s abnormally dry conditions observed in
        March; and it also reduced the large region affected by moderate drought conditions to
        only portions of Prince George’s, Charles, Somerset, and Worcester counties.
Maryland Climate Divisions (Figures 6-7, B1, and B2)

    •   While, on average, the state was warmer and wetter than normal in April, Climate
        Divisions 6, 7, and 8 (North Central, Appalachian Mountains, and Allegheny Plateau)
        were warmer but drier than normal. Climate Divisions 1 and 2 (Southeastern Shore and
        Central Eastern Shore) had the largest precipitation and temperature anomalies (around
        1.9 in and 4.5°F).

    •   Statewide temperature and precipitation anomalies have been changing considerably
        since February. Statewide warm anomalies in February (6.8°F) decreased in March

 Maryland State Climatologist Office ‒ MDSCO
                                                                                                 i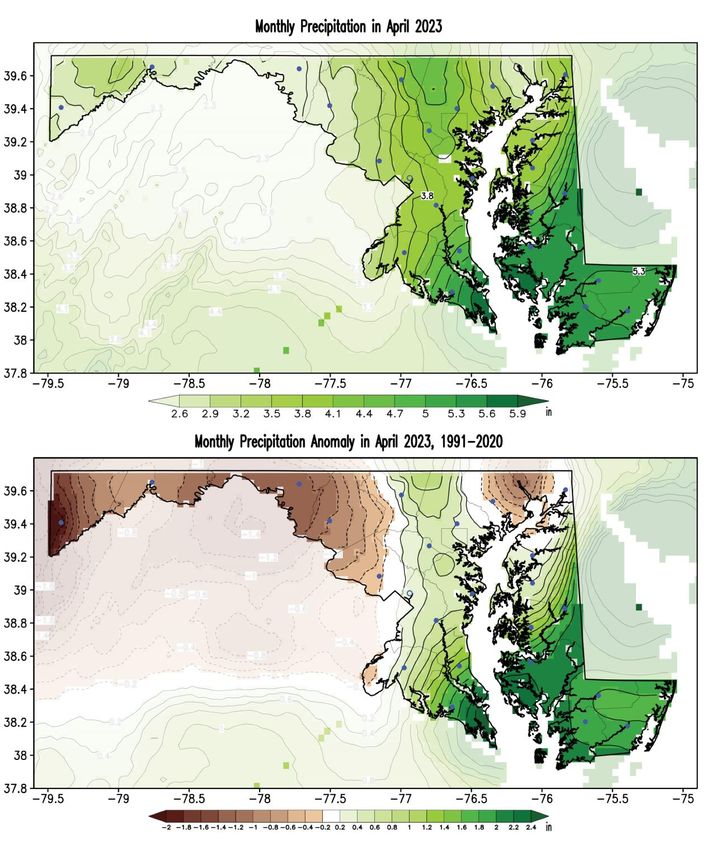
(1.8°F), and they increased in April (3.9°F). Statewide dry precipitation anomalies
        decreased from February (‒0.81 in) to a minimum in March (‒2.14 in) but changed to
        wet anomalies in April (0.45 in).

Historical Context (Figure 8, Tables A1 and A2)

    •   April’s mean, maximum, and minimum statewide temperatures (58.1, 70.6, and 45.6°F)
        were above the long-term (1895-2022) average and within 25% of the highest values.
        April’s precipitation (3.97 in) was above the long-term average.
    •   Statewide maximum temperature in April 2023 was the warmest on record for the
        month, and the mean temperature was the second warmest. While statewide precipitation
        in this month was not close to the records, counties like Dorchester, Somerset,
        Wicomico, and Worcester were within the ten wettest among the 129 Aprils in the 1895-
        2023 period. Most counties had (mean, maximum, and minimum) temperatures within
        the top five warmest Aprils on record.

Century-Plus Trends, 1895-2023 (Figures 9, 10)

   •    April statewide temperature showed a significant 2.8°F/century warming trend, and the
        heating degree-days a significant −84.21°F degree-days decreasing trend. On the other
        hand, statewide precipitation showed a non-significant trend (0.10 in/century).
   •    Regionally, April temperatures showed significant warming trends everywhere (above
        1.5°F/century). Notably, the largest trend is over Baltimore City (3.9°F/century).
        However, large trends are also evident in portions of Baltimore, Carroll, Frederick,
        Montgomery, Howard, Prince George’s, and Anne Arundel counties and over Caroline,
        Dorchester, Wicomico, Somerset, and Worcester counties (above 3°F/century).
   •    Regionally, April precipitation shows significant wet trends over Allegany and Garret
        counties (0.6 in/century).

 Maryland State Climatologist Office ‒ MDSCO
                                                                                                ii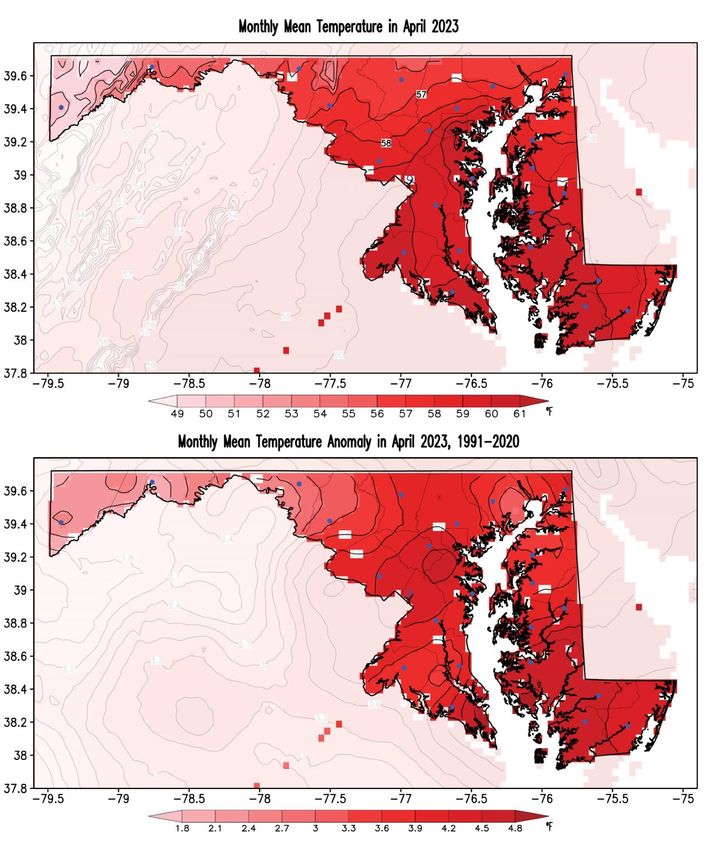
Contents

Summary....................................................................................................................................................... i
Contents ...................................................................................................................................................... iii
1.        Introduction ......................................................................................................................................... 1
2.        Data ...................................................................................................................................................... 1
3.        April 2023 Maps .................................................................................................................................. 3
     A.      Mean Temperatures .......................................................................................................................... 3
     B.      Maximum Temperatures ................................................................................................................... 4
     C.      Minimum Temperatures.................................................................................................................... 5
     D.      Precipitation ...................................................................................................................................... 6
     E.      Drought ............................................................................................................................................. 7
4.        April and FMA 2023 Climate Divisions Averages ........................................................................... 8
     A.      April 2023 Scatter Plots .................................................................................................................... 8
     B.      February-April 2023 Scatter Plots .................................................................................................... 9
5.        April 2023 Statewide Averages in the Historical Record .............................................................. 10
     A.      Box and Whisker Plots.................................................................................................................... 10
6.        1895-2023 April Trends .................................................................................................................... 11
     A.      Statewide Mean Temperature, Heating Degree-Days, and Precipitation........................................ 11
     B.      Temperature and Precipitation Maps .............................................................................................. 12
Appendix A. April 2023 Tables: Statewide, Climate Divisions, and Counties .................................... 13
     A.      Mean Temperature and Precipitation .............................................................................................. 13
     B.      Maximum and Minimum Temperatures ......................................................................................... 14
Appendix B. April 2023 Bar Graphs: Statewide, Climate Divisions, and Counties ........................... 15
     A.      Temperatures and Precipitation ...................................................................................................... 15
     B.      Temperature and Precipitation Anomalies ...................................................................................... 16
Appendix C. April 1991-2020 Climatology Maps .................................................................................. 17
Appendix D. April Standard Deviation and April 2023 Standardized Anomalies Maps ................... 18
References .................................................................................................................................................. 19

     Maryland State Climatologist Office ‒ MDSCO
                                                                                                                                                                    iii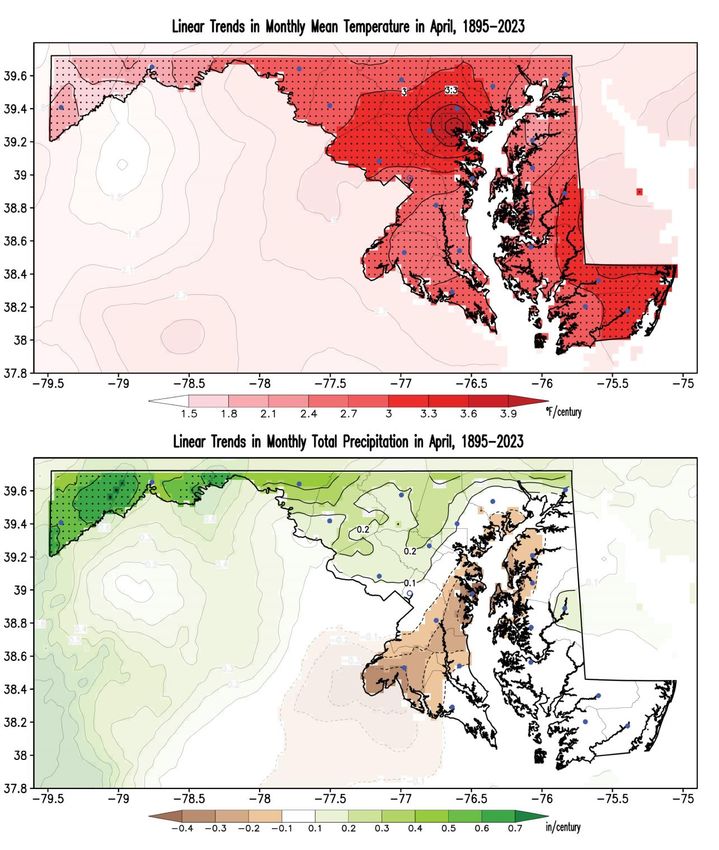
MDSCO-2023-04

1.       Introduction
The Maryland Climate Bulletin is issued by the Maryland State Climatologist Office (MDSCO),
which resides in the Department of Atmospheric and Oceanic Science at the University of
Maryland, College Park. It documents the surface climate conditions observed across the state in
a calendar month and is issued in the second week of the following month.

Maryland’s geography is challenging, with the Allegheny and Blue Ridge mountains to the west,
Piedmont Plateau in the center, the Chesapeake Bay, and the Atlantic Coastal Plain to the east.
The range of physiographic features and the eastern placement of the state within the expansive
North American continent contribute to a comparatively wide range of climatic conditions.

The bulletin seeks to document and characterize monthly surface climate conditions statewide,
and climate division and county-wise, placing them in the context of regional and continental
climate variability and change to help Marylanders interpret and understand recent climate
conditions.

The monthly surface climate conditions for April 2023 are presented via maps of key variables,
such as average surface air temperature, maximum surface air temperature, minimum surface air
temperature, total precipitation, and their anomalies (i.e., departures from normal); they are
complemented by drought conditions for the state, as given by the U.S. Drought Monitor
(Section 3). Statewide and climate division averages for the month are compared against each
other via scatter plots (Section 4). The monthly statewide averages are placed in the context of
the historical record via box and whisker plots in Section 5. Century-plus trends in statewide air
temperature, heating degree-days, precipitation, and state maps of air temperature and
precipitation are presented in Section 6. Ancillary statewide, climate division, and county-level
information is provided via tables and plots in Appendices A-B; climatology and variability
maps are in Appendices C-D.

2.       Data
Surface air temperatures, total precipitation, and heating degree-days data in this report are from
the following sources:

     •   NOAA Monthly U.S. Climate Gridded Dataset at 5-km horizontal resolution
         (NClimGrid – Vose et al. 2014), which is available in a preliminary status at:
         https://www.ncei.noaa.gov/data/nclimgrid-monthly/access/
         Data was downloaded on 5/10/2023.

     •   NOAA Monthly U.S. Climate Divisional Dataset (NClimDiv – Vose et al. 2014), which
         is available in a preliminary status (v1.0.0-20230406) at:
         https://www.ncei.noaa.gov/pub/data/cirs/climdiv/
         Data was downloaded on 5/10/2023.

 Maryland State Climatologist Office ‒ MDSCO
                                                                                                      1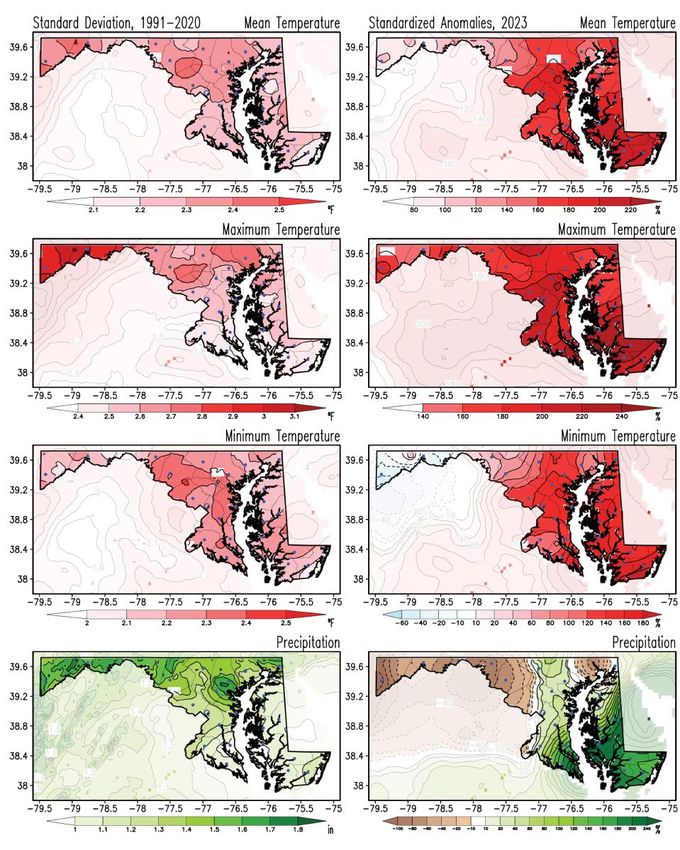
MDSCO-2023-04

The drought conditions are from the U.S. Drought Monitor website:
https://droughtmonitor.unl.edu/Maps/MapArchive.aspx

Some definitions:

About the anomalies: Anomalies for a given month (e.g., April 2023) are the departures of the
monthly value from the corresponding month’s 30-year average (i.e., from the average of 30
Aprils) during 1991-2020; the 30-year average (or mean) is the climate normal, or just the
climatology. When the observed monthly value exceeds its climatological value, it is referred to
as above-normal (e.g., warmer than normal or wetter than normal) or a positive anomaly. In
contrast, when this value is smaller than its climatological value, it is referred to as below-normal
(e.g., colder than normal or dryer than normal) or negative anomaly.

About NOAA’s Climate Divisions. The term “climate division” refers to one of the eight
divisions in the state that represent climatically homogeneous regions, as determined by NOAA:
https://www.ncei.noaa.gov/access/monitoring/dyk/us-climate-divisions

The eight climate divisions in Maryland are:

    •   Climate Division 1: Southeastern Shore. It includes the counties of Somerset,
                            Wicomico, and Worcester.
    •   Climate Division 2: Central Eastern Shore. It includes the counties of Caroline,
                            Dorchester, and Talbot.
    •   Climate Division 3: Lower Southern. It includes the counties of Calvert, Charles, and St.
                            Mary’s.
    •   Climate Division 4: Upper Southern. It includes the counties of Anne Arundel and
                            Prince George’s.
    •   Climate Division 5: Northeastern Shore. It includes the counties of Kent and Queen
                            Anne’s.
    •   Climate Division 6: North Central. It includes the counties of Baltimore, Carroll, Cecil,
                            Frederick, Harford, Howard, Montgomery, and the city of
                            Baltimore.
    •   Climate Division 7: Appalachian Mountains. It includes the counties of Allegany and
                           Washington.
    •   Climate Division 8: Allegheny Plateau. It includes Garrett County.

Note that these Climate Divisions do not correspond with the Physiographic Provinces in the
state, as the former follow county lines. Climate Division 8 follows the Appalachian Plateau
Province, Climate Division 7 follows the Ridge and Valley Province; however, Climate Division
6 includes the Blue Ridge and the Piedmont Plateau provinces, Climate Divisions 3, 4, and a
portion of 6 include the Upper Coastal Plain Province, and Climate Divisions 1, 2, 5, and a
portion of 6 include the Lower Coastal Plain (or Atlantic Continental Shelf) Province.

 Maryland State Climatologist Office ‒ MDSCO
                                                                                                   2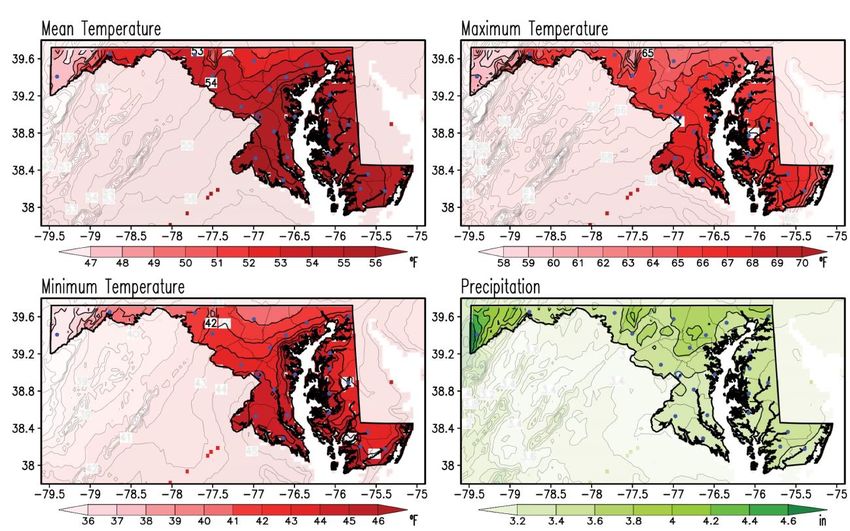
MDSCO-2023-04

3.      April 2023 Maps
          A.    Mean Temperatures

Figure 1. Monthly mean surface air temperature (top panel) and its anomaly with respect to the 1991-2020
climatology (bottom panel) for April 2023. Temperatures are in °F following the color bar. Red shading in
the anomaly map marks warmer than normal conditions. Note shading outside the state has been washed
out to facilitate focusing on Maryland. Filled blue circles mark the county seats.

  Maryland State Climatologist Office ‒ MDSCO
                                                                                                        3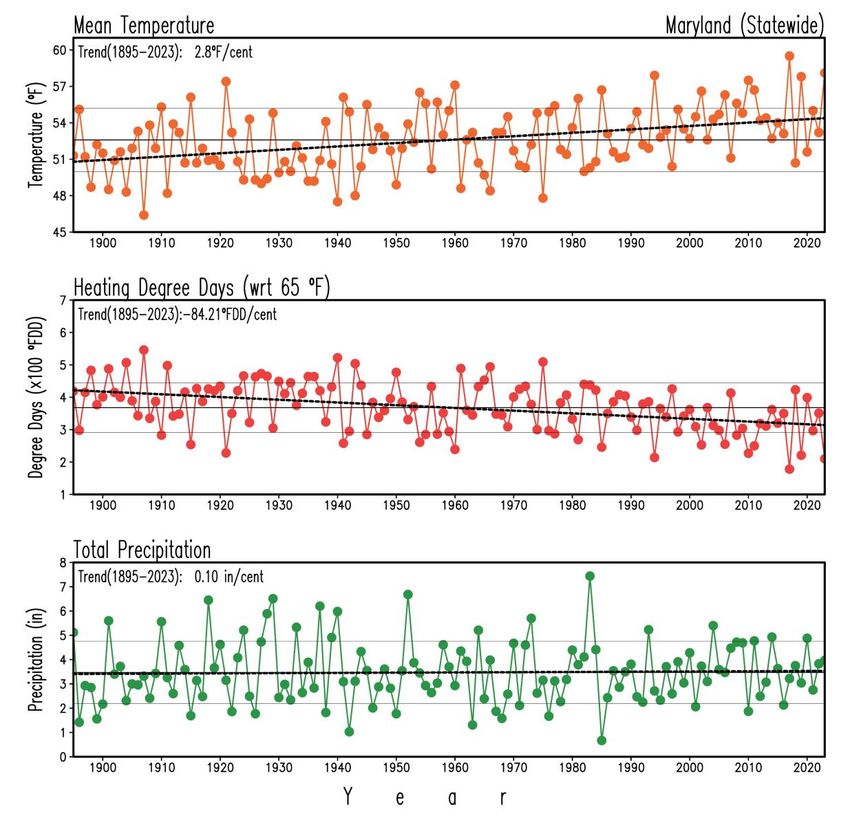
MDSCO-2023-04

          B.   Maximum Temperatures

Figure 2. Monthly maximum surface air temperature (top panel) and its anomaly with respect to the 1991-
2020 climatology (bottom panel) for April 2023. Temperatures are in °F following the color bar. Red
shading in the anomaly map marks warmer than normal conditions. Note shading outside the state has been
washed out to facilitate focusing on Maryland. Filled blue circles mark the county seats.

  Maryland State Climatologist Office ‒ MDSCO
                                                                                                     4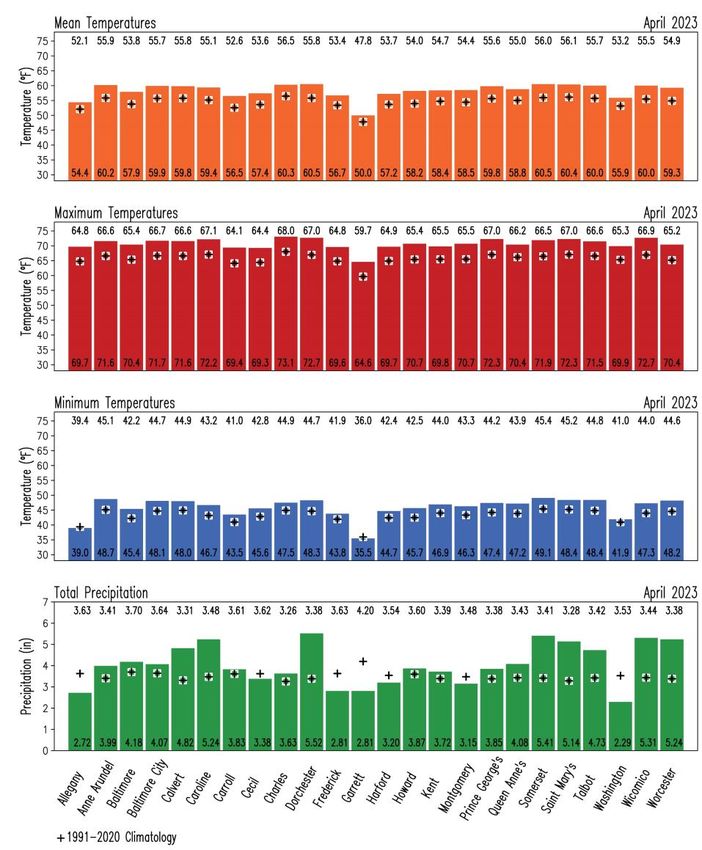
MDSCO-2023-04

         C.    Minimum Temperatures

Figure 3. Monthly minimum surface air temperature (top panel) and its anomaly with respect to the 1991-
2020 climatology (bottom panel) for April 2023. Temperatures are in °F following the color bar. Blue/red
shading in the anomaly map marks colder/warmer than normal conditions. Note shading outside the state
has been washed out to facilitate focusing on Maryland. Filled blue circles mark the county seats.

 Maryland State Climatologist Office ‒ MDSCO
                                                                                                      5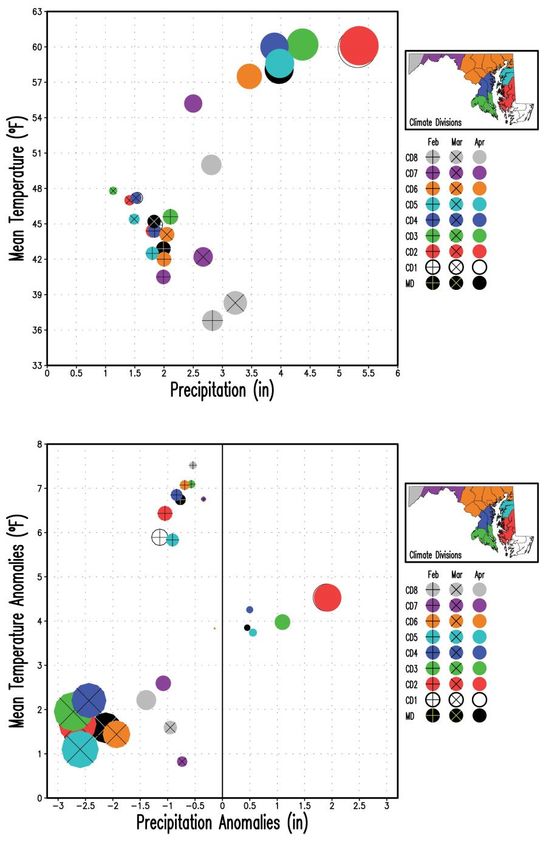
MDSCO-2023-04

          D.    Precipitation

Figure 4. Monthly total precipitation (top panel) and its anomaly with respect to the 1991-2020 climatology
(bottom panel) for April 2023. Precipitation is in inches following the color bar. Brown/green shading in
the anomaly map marks drier/wetter than normal conditions. Note shading outside the state has been washed
out to facilitate focusing on Maryland. Filled blue circles mark the county seats.

  Maryland State Climatologist Office ‒ MDSCO
                                                                                                         6
MDSCO-2023-04
E. Drought
Figure 5. Drought conditions as reported by the U.S. Drought Monitor on May 2, 2023. Yellow shading
indicates regions that are abnormally dry while regions with light orange shading shows regions than are
under a moderate drought according to the inset of drought intensity. Numbers in the table indicate the
percentage of the state covered under the combined drought conditions at the cited time in the left
column.
Maryland State Climatologist Office ‒ MDSCO
7MDSCO-2023-04
4. April and FMA 2023 Climate Divisions Averages
A. April 2023 Scatter Plots
Figure 6. Scatter plots of Maryland (statewide) and Climate Divisions (CD#) monthly mean surface air
temperature vs. total precipitation for April 2023. The upper panel shows the mean temperature and total
precipitation, and the bottom panel displays their anomalies with respect to the 1991-2020 climatology.
Temperatures are in °F and precipitation is in inches. The size of the circles is proportional to the total
precipitation scaled down by the maximum precipitation (5.34 inches in CD2, top panel) and by the
maximum precipitation anomaly (1.92 inches in CD2, bottom panel) among the nine regions. Note that the
color of the filled circles corresponds to the color in the Climate Divisions according to the inset map.
Maryland State Climatologist Office ‒ MDSCO
8MDSCO-2023-04
B. February-April 2023 Scatter Plots
Figure 7. Scatter plots of Maryland (statewide) and Climate Divisions (CD#) monthly mean surface air
temperature vs. total precipitation for February, March, and April 2023. The upper panel shows the mean
temperature and total precipitation, and the bottom panel displays their anomalies with respect to the 1991-
2020 climatology. Temperatures are in °F, and precipitation is in inches. The size of the circles is
proportional to the total precipitation scaled down by the maximum precipitation (5.34 inches in CD2 in
April, top panel) and by the maximum precipitation anomaly (|-2.72| inches in CD3 in March, bottom panel)
among the nine regions and three months. April is displayed with filled circles only, while March and
February are displayed with superposed multiplication and addition signs, respectively.
Maryland State Climatologist Office ‒ MDSCO
9MDSCO-2023-04
5. April 2023 Statewide Averages in the Historical Record
A. Box and Whisker Plots
Figure 8. Box and Whisker plots of Maryland (statewide) monthly mean (upper left), maximum (upper
right), minimum (lower left) surface air temperatures, and total precipitation (lower right) for April for the
period 1895-2022. The label and asterisk in purple represent conditions for April 2023. Statistics for the
period 1895-2022 are labeled at the left side of each box and whisker plot and their values at their right.
Temperatures are in °F and precipitation is in inches. The mean is the green line within the box, while the
median is the black line within the box. The lower (Q1) and upper (Q3) quartiles, indicating the values of
the variable that separate 25% of the smallest and largest values are the lower and upper horizontal black
lines of the box, respectively. The blue and red dots mark the minimum and maximum values in the period
at the end of the whiskers; the year of occurrence is shown in parenthesis. The blue and red horizontal lines
represent extreme values defined by Q1-1.5×(Q3-Q1) and Q3+1.5×(Q3-Q1), respectively.
Maryland State Climatologist Office ‒ MDSCO
10MDSCO-2023-04
6. 1895-2023 April Trends
A. Statewide Mean Temperature, Heating Degree-Days, and Precipitation
Figure 9. Maryland (statewide) mean surface air temperature, heating degree-days, and precipitation in
April for the period 1895-2023. Temperature is in °F, heating degree-days is in °F degree-days (°FDD),
and precipitation is in inches. The thin, continuous black lines in each panel display the long-term means
(52.6°F, 367.97°FDD, and 3.47 in, 1895-2023), and the double thin, continuous gray lines indicate the
standard deviation (2.6°F, 76.82°FDD, and 1.28 in) above/below the long-term mean. The thick dashed
black lines show the long-term linear trend. Degree-days are the difference between the daily mean
temperature (high temperature plus low temperature divided by two) and 65°F. It gives a general idea of
how much energy is required to heat buildings; because energy demand is cumulative, degree-day totals
for a month are the sum of each individual day's degree-day total (CPC, 2023). The warming temperature
trend (2.8°F/century) and the decreasing heating degree-days (−84.21°FDD/century) trend are statistically
significant at the 95% level (Student’s t-test −Santer et al. 2000), but not the low precipitation trend (0.10
in/century).
Maryland State Climatologist Office ‒ MDSCO
11MDSCO-2023-04
B. Temperature and Precipitation Maps
Figure 10. Linear trends in surface air mean temperature and precipitation in April for the period 1895-
2023. Temperatures are in °F/century, and precipitation is in inches/century following the color bars. Red
shading in the temperature map marks warming trends. Brown/green shading in the precipitation map
shows drying/wetting trends. Stippling in the maps shows regions where trends are statistically significant
at the 95% level (Student’s t-test −Santer et al. 2000). Note that shading outside the state has been washed
out to facilitate focusing on Maryland. Filled blue circles mark the county seats.
Maryland State Climatologist Office ‒ MDSCO
12MDSCO-2023-04
Appendix A. April 2023 Tables: Statewide, Climate Divisions, and
Counties
A. Mean Temperature and Precipitation
Region Mean Air Rank Region Total Rank
Temperature (#) Precipitation (#)
(°F) (in)
Statewide 58.1 128 Statewide 3.97 92
Climate Division 1 59.9 128 Climate Division 1 5.31 123
Climate Division 2 60.1 128 Climate Division 2 5.34 120
Climate Division 3 60.2 128 Climate Division 3 4.37 106
Climate Division 4 60.0 128 Climate Division 4 3.89 87
Climate Division 5 58.6 127 Climate Division 5 3.98 89
Climate Division 6 57.5 127 Climate Division 6 3.46 70
Climate Division 7 55.2 121 Climate Division 7 2.50 40
Climate Division 8 50.0 113 Climate Division 8 2.81 32
Allegany 54.4 116 Allegany 2.72 54
Anne Arundel 60.2 128 Anne Arundel 3.99 90
Baltimore 57.9 127 Baltimore 4.18 88
Baltimore City 59.9 127 Baltimore City 4.07 89
Calvert 59.8 128 Calvert 4.82 114
Caroline 59.4 128 Caroline 5.24 116
Carroll 56.5 128 Carroll 3.83 83
Cecil 57.4 127 Cecil 3.38 66
Charles 60.3 126 Charles 3.63 79
Dorchester 60.5 128 Dorchester 5.52 121
Fredrick 56.7 125 Fredrick 2.81 44
Garrett 50.0 113 Garrett 2.81 32
Harford 57.2 126 Harford 3.20 57
Howard 58.2 128 Howard 3.87 84
Kent 58.4 127 Kent 3.72 80
Montgomery 58.5 128 Montgomery 3.15 66
Prince George's 59.8 128 Prince George's 3.85 88
Queen Anne's 58.8 127 Queen Anne's 4.08 92
Saint Mary's 60.4 128 Saint Mary's 5.14 118
Somerset 60.5 128 Somerset 5.41 123
Talbot 60.0 128 Talbot 4.73 108
Washington 55.9 123 Washington 2.29 32
Wicomico 60.0 127 Wicomico 5.31 120
Worcester 59.3 127 Worcester 5.24 122
Table A1. Monthly mean surface air temperature (left) and total precipitation (right) at Maryland
(statewide), climate division, and county levels for April 2023. Temperatures are in °F, and precipitation is
in inches. The rank is the order that the variable for April 2023 occupies among the 129 Aprils after the 129
values have been arranged from the lowest to the highest in the standard competition ranking method. The
closer to 129 the rank is, the larger (i.e., the warmer/wetter) the value of the surface variable is in the record;
similarly, the closer to 1 the rank is, the smaller (i.e., the colder/drier) the value of the surface variable is in
the record.
Maryland State Climatologist Office ‒ MDSCO
13MDSCO-2023-04
B. Maximum and Minimum Temperatures
Region Maximum Air Rank Region Minimum Air Rank
Temperature (#) Temperature (#)
(°F) (F)
Statewide 70.6 129 Statewide 45.6 124
Climate Division 1 71.6 129 Climate Division 1 48.2 127
Climate Division 2 72.3 129 Climate Division 2 47.8 127
Climate Division 3 72.5 129 Climate Division 3 47.9 124
Climate Division 4 71.9 129 Climate Division 4 48.0 125
Climate Division 5 70.2 126 Climate Division 5 46.9 125
Climate Division 6 70.0 129 Climate Division 6 45.0 124
Climate Division 7 69.8 124 Climate Division 7 40.5 97
Climate Division 8 64.6 124 Climate Division 8 35.5 80
Allegany 69.7 125 Allegany 39.0 77
Anne Arundel 71.6 129 Anne Arundel 48.7 127
Baltimore 70.4 128 Baltimore 45.4 126
Baltimore City 71.7 128 Baltimore City 48.1 126
Calvert 71.6 127 Calvert 48.0 125
Caroline 72.2 129 Caroline 46.7 127
Carroll 69.4 129 Carroll 43.5 124
Cecil 69.3 129 Cecil 45.6 126
Charles 73.1 129 Charles 47.5 124
Dorchester 72.7 129 Dorchester 48.3 127
Fredrick 69.6 125 Fredrick 43.8 122
Garrett 64.6 124 Garrett 35.5 80
Harford 69.7 128 Harford 44.7 124
Howard 70.7 128 Howard 45.7 126
Kent 69.8 125 Kent 46.9 125
Montgomery 70.7 126 Montgomery 46.3 125
Prince George's 72.3 129 Prince George's 47.4 125
Queen Anne's 70.4 126 Queen Anne's 47.2 127
Saint Mary's 72.3 129 Saint Mary's 48.4 125
Somerset 71.9 129 Somerset 49.1 127
Talbot 71.5 128 Talbot 48.4 128
Washington 69.9 125 Washington 41.9 112
Wicomico 72.7 129 Wicomico 47.3 126
Worcester 70.4 129 Worcester 48.2 127
Table A2. Monthly maximum (left) and minimum (right) surface air temperatures at Maryland (statewide),
climate division, and county levels for April 2023. Temperatures are in °F. The rank is the order that the
variable for April 2023 occupies among the 129 Aprils after the 129 values have been arranged from the
lowest to the highest using the standard competition ranking method. The closer to 129 the rank is, the
larger (i.e., the warmer) the value of the surface variable is in the record; similarly, the closer to 1 the rank
is, the smaller (i.e., the colder) the value of the surface variable is in the record.
Maryland State Climatologist Office ‒ MDSCO
14MDSCO-2023-04
Appendix B. April 2023 Bar Graphs: Statewide, Climate Divisions,
and Counties
A. Temperatures and Precipitation
Figure B1. Monthly surface variables in Maryland for April 2023. Color bars represent the variables as
follows: mean surface air temperature (orange), maximum surface air temperature (red), minimum surface
air temperature (blue) and total precipitation (green) at statewide and climate division (left column), and at
county (right column) levels. Temperatures are in °F and precipitation is in inches. The numbers at the base
of the bars indicate the magnitude of the variable for April 2023. For comparison, the corresponding 1991-
2020 climatological values for April are displayed as black addition signs, and their magnitude are shown
at the top of the panels.
Maryland State Climatologist Office ‒ MDSCO
15MDSCO-2023-04
B. Temperature and Precipitation Anomalies
Figure B2. Anomalies of the monthly surface variables in Maryland for April 2023. Anomalies are with
respect to the 1991-2020 climatology. Red/blue color represents warm/cold anomalies for mean surface air
temperature (upper row), maximum surface air temperature (second row from top), and minimum surface
air temperature (third row from top) while green/brown color indicates wet/dry anomalies in total
precipitation (bottom row) at statewide and climate division (left column), and at county (right column)
levels. Temperatures are in °F and precipitation is in inches. The numbers outside of the bars indicate the
magnitude of the anomaly for April 2023.
Maryland State Climatologist Office ‒ MDSCO
16MDSCO-2023-04
Appendix C. April 1991-2020 Climatology Maps
Figure C1. April climatology of the monthly mean, maximum and minimum surface air temperatures,
and total precipitation for the period 1991-2020. Temperatures are in °F, and precipitation is in inches
according to the color bars. This is the current climate normal against which the April 2023 conditions
are compared to obtain the April 2023 anomalies. Note that shading outside the state has been washed
out to facilitate focusing on Maryland. Filled blue circles mark the county seats.
Weather and climate are closely related, but they are not the same. Weather represents the state
of the atmosphere (temperature, precipitation, humidity, wind, sunshine, cloudiness, etc.) at any
given time. On the other hand, climate refers to the time average of the weather elements when
the average is over long periods. If the average period is long enough, we can start to
characterize the climate of a particular region.
It is customary to follow the World Meteorological Organization (WMO) recommendation and
use 30 years for the average. The 30-year averaged weather data is traditionally known as
Climate Normal (Kunkel and Court 1990), which is updated every ten years (WMO 2017).
Establishing a climate normal or climatology is important as it allows one to compare a specific
day, month, season, or even another normal period with the current normal. Such comparisons
characterize anomalous weather and climate conditions, climate variability and change, and help
define extreme weather and climate events (Arguez et al. 2012).
Maryland State Climatologist Office ‒ MDSCO
17MDSCO-2023-04
Appendix D. April Standard Deviation and April 2023 Standardized
Anomalies Maps
Figure D1. Standard deviation for April and standardized anomalies of temperatures and precipitation for
April 2023. Standard deviations for monthly mean, maximum, and minimum surface air temperatures and
total precipitation were obtained for the 1991-2020 period (left column). Anomalies for April 2023 (right
column) are obtained as a percentage of the standard deviations. The standard deviations in temperatures
are in °F, and those in precipitation are in inches according to the color bars. The standardized anomalies
are obtained by dividing the raw anomalies (from Figures 1 to 4) by the standard deviation (from left
column panels) and multiplying that ratio by 100; hence units are in percent (%). Note that shading outside
the state has been washed out to facilitate focusing on Maryland. Filled blue circles mark the county seats.
The monthly standard deviation measures a climate variable’s year-to-year, or interannual,
variability. Anomalies are sometimes compared against that variability to identify extremes in
the climate record. When the anomalies are divided by the standard deviation, they are named
standardized anomalies.
Maryland State Climatologist Office ‒ MDSCO
18MDSCO-2023-04
References
Arguez A., I. Durre, S. Applequist, R. S. Vose, M. F. Squires, X. Yin, R. R. Heim Jr, and T. W.
Owen, 2012. NOAA’s 1981-2010 U. S. Climate Normals. An Overview. Bulletin of the American
Meteorological Society. 93, 1687-1697, doi:10.1175/BAMS-D-11-00197.1
https://www1.ncdc.noaa.gov/pub/data/normals/1981-2010/documentation/1981-2010-normals-
overview.pdf.
CPC, 2023. Degree Days Explanation.
https://www.cpc.ncep.noaa.gov/products/analysis_monitoring/cdus/degree_days/ddayexp.shtml
Kunkel, K. E., and A. Court, 1990. Climatic Means and Normals—A Statement of the American
Association of State Climatologists (AASC), Bulletin of the American Meteorological Society,
71(2), 201-204. Retrieved Aug 20, 2022, from
https://journals.ametsoc.org/view/journals/bams/71/2/1520-0477-71_2_201.xml
Santer, B. D., and co-authors, 2000: Statistical significance of trends and trend differences in layer-
averaged atmospheric temperature time series. J. Geophys. Res., 105, 7337–7356,
doi:10.1029/1999JD901105.
Vose and co-authors, 2014. NOAA Monthly U.S. Climate Gridded Dataset (NClimGrid), Version
3. NOAA National Centers for Environmental Information. DOI:10.7289/V5SX6B56 .
WMO, 2017. WMO Guidelines on the Calculation of Climate Normals. WMO-No. 1203, Series.
29pp. https://library.wmo.int/doc_num.php?explnum_id=4166.
Maryland State Climatologist Office ‒ MDSCO
19You can also read