Market and Trade Profile: Hong Kong - March 2021 Destination Bristol Gary Newman - Visitbritain.org
←
→
Page content transcription
If your browser does not render page correctly, please read the page content below

Market and
          Trade Profile: Hong Kong
          March 2021

Destination Bristol ©Gary Newman
Overview

• ‘Chapter 1: Inbound market statistics’ provides insights on key statistics about Hong Kong travellers,
  where they are going, and who they are. It also takes a look at Britain as a destination and its competitive set.

• ‘Chapter 2: Experiences and perceptions’ features details about what visitors from Hong Kong are likely to
  do in the UK, how they felt during their visit to the UK, and whether they would recommend a stay there to
  their acquaintances. Perceptions of Britain held by Hong Kongers in general are also highlighted.

• ‘Chapter 3: Understanding the market’ takes a close look at consumer trends in Hong Kong, both pre and
  post COVID-19, and the booking, planning and further travel behaviour of this source market. Some details
  on how to best reach Hong Kong consumers are indicated, too.

• ‘Chapter 4: Access and travel trade’ shows how people from Hong Kong travel to the UK, how to best cater
  for their needs and wants during their stay, and gives insights into the Hong Kong travel trade. Further ways
  of working with VisitBritain and other useful research resources are pointed out in the appendix.

Please note that the majority of this report refers to the market conditions for travel from Hong Kong to the UK
prior to the COVID-19 pandemic, and gives some insight on changes which have resulted from the crisis. An
international recovery sentiment tracking survey is available.

Contents

Chapter 1: Market statistics                  Chapter 4: Access and Travel Trade
1.1 Key statistics                       10   4.1 Access                                         56
1.2 Getting around Britain               17   4.2 Travel trade                                   59
1.3 Visitor demographics                 21   4.3 Caring for the consumer                        64
1.4 The UK and its competitors           25
Chapter 2: Experiences and perceptions        Appendix:
                                              Working with VisitBritain                          66
2.1 Inbound activities                   28
                                              Useful resources                                   68
2.2 Welcome and recommending Britain     36
                                              Definitions, sources and information on this report 70
Chapter 3: Understanding the Market
3.1 Structural drivers                   38
3.2 Consumer trends                      42
3.3 Booking and planning                 48
3.4 Reaching the consumer                51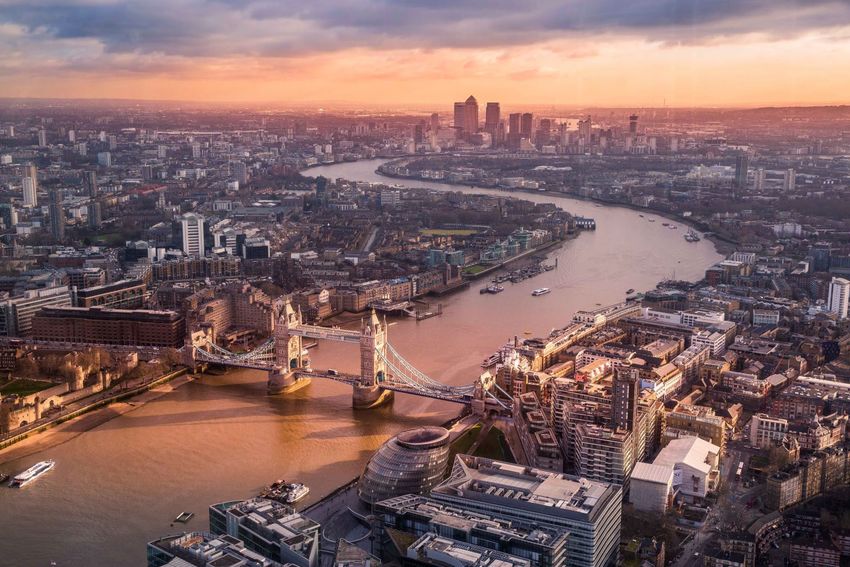
Executive Summary

                    ©VisitBritain/Raymond Carruthers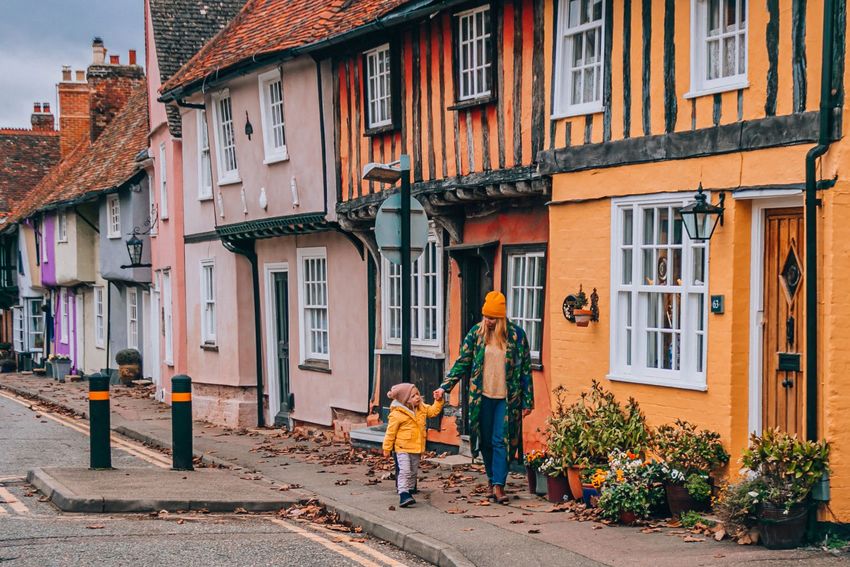
1: Inbound market statistics

Chapter summary

•   The Hongkongese outbound market is valuable: it ranked 12th for international tourism
    expenditure in 2019 globally. From 2017-2019, the average holidaymaker from Hong Kong
    to the UK spent £1,348, significantly higher than the all-market average (£765).
•   Looking at the wider picture, it is worth noting that a large share of outbound visits for a
    night or more from Hong Kong were within Asia: 77% of their overnight visits were to
                                                                                                         £1,348
    China or Macao in 2019.                                                                         average spend per visit
•   Visits from Hong Kong to the UK were on a steady rise from 2009 to 2019, with a 141%
                                                                                                        from Hong Kong
    growth in visits and 254% growth in spend seen in that time. However, the COVID-19             holidaymakers from 2017-
    outbreak in early 2020 severely impacted inbound travel, with Oxford Economics                           2019
    estimating that 18% of the volume of visits seen in 2019 were retained in 2020. A similar
    rate of decline was seen across the Northeast Asia region.
•   Hong Kongers are most likely to come to the UK for a holiday trip (52%), and volume of
    holiday visitors has steadily increased since 2009. However, 26% of Hong Kong visitors
    come to the UK to visit friends and family; the highest proportion within Northeast Asia.
•   London is the leading destination for a trip to the UK. 47% of nights from Hong Kong
    visitors were spent in London in 2019, however, 43% were spent in the rest of England.
    The most popular regions are the South East and North West.

Source: Oxford Economics, International Passenger Survey by ONS
2: Experiences and perceptions

Chapter summary

• Dining in restaurants, going shopping, sightseeing and visiting museums or art
  galleries are the most common activities featuring in visits from Hong Kong to
  the UK.                                                                            Over 9 in 10 Hong
• Hong Kong visitors over-index on dining in restaurants, going shopping and            Kongers would
  visiting parks and gardens when compared to the all-market average. In               be ‘extremely’ or
  contrast, they are less likely than the all-market average to socialise with the
  locals or go to the pub.
                                                                                         ‘very’ likely to
• 98% of visitors from Hong Kong felt welcome in the Britain during their stay,
                                                                                      recommend a trip
  and 95% would recommend Britain for a holiday trip.                                      to the UK

Source: International Passenger Survey by ONS
3: Understanding the market

Chapter summary

•   Hong Kong was retroceded to China in 1997. Today it still has some independence from Beijing due to its
    status as a Special Administrative Region.
•   In June 2019, large protests erupted in Hong Kong in response to a proposed extradition amendment bill.
    These protests were ongoing throughout 2019 and into 2020, and had a significant impact on Hong

•
    Kong’s economy and inbound tourism.
    Strong links with the UK remain, and this is exemplified by the new British National Overseas (BNO) visa
                                                                                                               The average Hong
    system, in place from January 2021, allowing Hong Kong citizens to stay in the UK for five year periods
    and apply for British citizenship. 300,000 Hong Kongers are currently BNO passport holders, and 72% of
                                                                                                                 Konger will be
    residents may be eligible. This will have a significant impact on Hong Kong, UK and Chinese relations,      aged 51 by 2040
    and its full effects remain to be seen.
•   4-in-10 Hong Kongers were born elsewhere, which influences the Hongkongese culture; a mix between
    Chinese and Western elements.
•   Hong Kong has the longest life expectancy in the world (85 years old compared to the global average of
    70). A range of possible explanations for this include strong infrastructure, green spaces, healthcare
    provision, and healthy diets. Society itself is changing as the population ages; Hong Kongers look for
    healthier lifestyles, and many retired people travel to reward themselves, while others travel to pursue
    outdoor activities and relax outside of their urban routine.
•   The number one influence on Hong Kongers’ choice of travel destination is celebrities and influencers,
    with social media coming in second. This demonstrates the importance of digital means to reach these
    potential visitors.

Source: UN Population Prospects, CIA World Factbook 2021, UN‘s Population Prospects 2019, UN‘s International
Migration Report 2019, BBC, Skyscanner APAC travel trends, UNDP, CNN
4: Access and travel trade
Chapter summary
• Air connectivity is key for this market. The vast majority of visitors from Hong Kong came
by plane to the UK (96% in 2019). Cathay Pacific is
• In 2019, there were 68 direct flights between Hong Kong and the UK weekly.
responsible for
• While most of this capacity was to London (91% of all direct seat capacity from Hong
Kong to the UK), Cathay Pacific’s flights to Manchester helped to increase regional spread 67% of direct
of arrival. seat capacity
• Due to the COVID-19 outbreak, seat capacity from Hong Kong to the UK dropped by 89%
in April and May 2020 compared to the same months in 2019, with seats at 35% of 2019
between Hong
levels on average through the year (slightly more seats were retained in 2020 than the Kong and the UK
average across Northeast Asia). Departures are planned to stay at a very low level in the
first half of 2021.
(2019)
• Airlines play a role in the travel trade as the main players now do not only offer ticketing,
but also packages. Main consumer trends have a direct impact on the proposed tours and
packages.
• The travel trade structure in Hong Kong may seem complex, with over 1,700 travel agents
being members of the Travel Industry Council. However, as tourism in general, and
inbound tourism in particular, is an important sector for the Hongkongese economy, it is
regulated and well organised. In the last few years, traditional players have moved online
as OTAs gained market shares.
Source: Apex, Travel Industry Council Hong KongInbound market statistics
Chapter 1
©VisitBritain/Ben Selway1.1 Key statistics
Key insights
• In 2019 Hong Kong was the 12th biggest spender on outbound tourism
globally, and the UK was once more its most visited destination for overnight
trips to Europe.
• Most visits from Hong Kong to the UK are made for holidays and to visit Hong Kong53%ranks
friends and relatives (52% and 26% of all 2019 visits from Hong Kong for Kong visitors
11ofthHong
respectively), while only 17% were for a business trip. have been to the UK
international
before; the highest
• VFR visitors from Hong Kong tend to stay longer than the all-market average,
with an average stay of 12 nights in 2019. Linked to this, 24% of all nights in
tourism
proportion in Northeast
the UK by Hong Kongers were spent as a free guest with friends or relatives. expenditureAsia in
• Overall, 4-7 night stays in Britain have become more popular among Hong 2018
Kong visitors in the last few years, with the summer months (July-September)
still their favourite time to visit, and London the leading destination.
• Hong Kong visitors are more likely than the all-market average to go to the
British countryside or villages, and to the coast or beaches. This behaviour is
particularly likely among those visiting friends and family.
Source: International Passenger Survey (IPS) by ONS, UNWTO1.1 Key statistics: global context and 10 year trend
Global context Inbound travel to the UK overview
Measure 2019 Visits Nights Spend
Measure
(000s) (000s) (£m)
International tourism expenditure 10-year trend +141% +75% +254%
26.9
(US$bn) 2009 169 2,046 158
2010 169 1,932 173
Global rank for international tourism
12 2011
expenditure 192 2,574 232
2012 191 1,825 257
Number of outbound overnight visits (m) 35.1 2013 229 2,536 340
2014 239 2,504 391
Number of outbound overnight visits 2015 277 3,000 353
8.0
excl. China and Macao (m)
2016 334 3,595 377
Most visited destination China 2017 400 4,422 513
2018 403 4,284 486
Most visited destination (excl. China and
Japan 2019 409 3,571 560
Macao)
Share of UK total in
Most visited destination in Europe UK 1.0% 1.2% 2.0%
2019
Source: International Passenger Survey by ONS, UNWTO, Oxford
Economics1.1 Key statistics: volume and value
Inbound volume and value Key metrics by journey purpose (2017-2019)
Change Rank out of UK Averages by journey Nights per Spend per Spend per
Measure 2019 purpose visit night visit
vs. 2018 top markets
Holiday 8 £164 £1,348
Visits (000s) 409 +2% 22
Business 6 £242 £1,498
Nights (000s) 3,571 -17% 19
Visiting Friends/ Relatives 12 £81 £984
Spend (£m) 560 +15% 15
Study** 70 £51 £3,568
Due to the Covid-19 outbreak in Q1 2020, visits from Hong
Misc.** 12 £72 £867
Kong to the UK decreased by 43% in the first three months of
2020 compared to those months in 2019, down to to 40,000*
All visits 10 £127 £1,286
Source: International Passenger Survey by ONS, *provisional data for
January-March 2020, latets statistics at time of writing **small base1.1 Key statistics: journey purpose
Journey purpose 2019 Journey purpose trends (visits 000s)
250
52%
200
Share of visits
41%
30% 150
26%
21% 100
17%
50
4% 6%
2% 1% 0
2009
2010
2011
2012
2013
2014
2015
2016
2017
2018
2019
Business Holiday VFR Study Misc.
Hong Kong All markets Holiday Business VFR Study Misc.
• Most visits from Hong Kong to the UK are made for leisure: in 2019, • In 2009, VFR visitors accounted for the highest proportion of
52% were made for holidays, higher than the all-market average of visitors from Hong Kong to the UK. However, after that year,
41%. Holiday visitors have consistently been the most prominent.
• Hong Kongers under-index on all other journey purposes apart from • Both the volume of Holiday visitors, and their share among all
study visits. 2% of Hong Kong visitors in 2019 came for study, Hong Kong visitors, has steadily increased in this time, with a
compared to 1% of all global visitors. sharp increase in volume from 2016 to 2017, which has been
• Among journey purposes, the highest spend per night came from maintained and surpassed each year since.
Business visitors from 2017- 2019, at £242. The highest spend per visit • In contrast, volumes of VFR visitors have dipped since 2016, with
came from Study visitors, due to a particularly high average length of a reduction in share of visits from 39% to 26% in this time.
stay, at 70 nights per visit*.
Source: International Passenger Survey by ONS *small base1.1 Key statistics: seasonality
Seasonality 2019 Seasonality trend (visits 000s)
35% 180
160
29%
Share of visits
26% 140
25% 25%
22% 120
20% 100
17%
80
60
40
20
-
2009
2010
2011
2012
2013
2014
2015
2016
2017
2018
2019
Jan-Mar Apr-Jun Jul-Sep Oct-Dec
Hong Kong All markets Jan-Mar Apr-Jun Jul-Sep Oct-Dec
• Visitors from Hong Kong tend to come the UK in the summer months: in 2019, 35% of visits from Hong Kong were
made between July and September, which is significantly higher than the global average of 29%.
• April-June is the second-most popular time to visit the UK for visitors from Hong Kong (26% of visits in 2019), followed
by October-December (22%) and January-March (17%).
• Since 2009, July-September has been consistently the most popular quarter for visits from Hong Kong, with April-June
only being surpassed by October-December in 2012 and 2017.
Source: International Passenger Survey by ONS1.1 Key statistics: length of stay and accommodation
Accommodation stayed in, in 2019 (nights, %share) Duration of stay trend (visits 000s)
180
160
140
120
1% 100
Hotel/guest house 80
60
4% 40
Free guest with relatives 20
8%
or friends 0
2009
2010
2011
2012
2013
2014
2015
2016
2017
2018
2019
Rented house/flat
15% Hostel/university/school Nil nights 1-3 nights 4-7 nights 8-14 nights 15+ nights
48%
Own home • Stays of 4 to 7 nights are the most popular among Hong
Kongese visitors on a UK trip, and numbers of visitors staying
Bed & Breakfast for this duration have steadily increased since 2012.
• Stays of 8-14 nights were close behind in 2016, but their
24%
Other volumes have remained significantly lower than that of 4-7
night stays since that year. Volumes of stays lasting 15+ nights
Camping/caravan have been declining since 2017.
• In 2019, 48% of the nights Hong Kongers spent in the UK
were spent in hotels or guest houses, and 24% as a free guest
with relatives or friends. These are by far the most popular
accommodation options in this market.
Source: International Passenger Survey by ONS1.1 Key statistics: repeat visits and package tours
Proportion of overnight holiday visitors to the UK who Proportion of visits that are bought as part of a package
have been to the UK before* or all-inclusive tour in 2019**
63% 18%
53% 16%15%
50%
10%
9% 9%
29%
7%
22%
5%
4%
2%
1%
0%
Hong Kong China Japan South Korea All markets Business Holiday VFR Study Misc. All
Journey
Hong Kong All markets
Purposes
• Within Northeast Asia, Hong Kong is the market where visitors know the UK best. 53% of Holiday visitors from Hong Kong in
2015 were repeat visitors; slighly above Japan at 50%, and significantly above China and South Korea at 29% and 22%
respectively. However, these rates are still below the all-market average of 63%.
• The proportion of Holiday visitors from Hong Kong as part of a package tour in 2019 are similar to the all-market average, at
16%. Hong Kong visitors from all other journey purposes are significantly less likely to be travelling as part of a package tour.
International Passenger Survey by ONS. *2015, excluding British nationals;
**See definition of a package holiday in appendix1.2 Getting around Britain
Annual visits to the UK (2017-2019 yearly average) Nights (% share, 2017-2019)
Nights stayed Visits Spend
Region
(000) (000) (£m)
Total 4,091 403 518
Scotland (SC) 265 36 22 SC
6%
Wales (WA) 105 12 9
Northern Ireland (NI) 12 2 1
London (LDN) 2266 282 345
NE
North East (NE) 32 5 3 1%
NI
North West (NW) NW
370 38 29 0.3%
9%
Yorkshire (YO) 110 13 10 YO
3%
West Midlands (WM) 132 21 15
East Midlands (EM) 63 11 7 EM
2%
East of England (EoE) 146 24 16 WM EoE
South West (SW) 3% 4%
193 29 24 WA
3% LON
South East (SE) 389 58 36 55%
SE
Nil nights (Nil) N/A 1 1 SW 10%
5%
Source: International Passenger Survey by ONS1.2 Getting around Britain: regional spread and top towns/cities
Top towns and cities visited (2014-2019)
• London is the leading destination for a trip to Britain from Hong
Kong. 47% of nights spent in the UK by visitors from Hong Kong in
Town Average yearly overnight visits (000s) 2019 were in London, compared to 43% in the rest of England in
London 237 the same year.
Edinburgh 22 • Visitors from Hong Kong spend significantly more nights in Scotland
than in Wales, 8% and 2% respectively of all their nights spent in
Manchester 21 the UK in 2019, which compares to 9% and 2% on average across
Oxford 14 all markets.
Birmingham 9
Regional spread 2019
47% 46%
41% 43%
Share of nights
8% 9%
2% 2% 0% 1%
Scotland Wales London Rest Of Northern
England Ireland
Hong Kong All markets
Source: International Passenger Survey by ONS1.2 Getting around Britain: visits to coast, countryside and villages
Propensity to visit coast, countryside and villages
VFR: Went to the coast or beaches 16%
13%
VFR: Went to countryside or villages 26%
18%
Business: Went to the coast or beaches 1%
2%
Business: Went to countryside or villages 1%
2%
Holiday: Went to the coast or beaches 13%
14%
Holiday: Went to countryside or villages 23%
18%
All journey purposes: Went to the coast or beaches 12%
10%
All journey purposes: Went to countryside or villages 21%
14%
Hong Kong All markets
Hong Kong visitors are overall more likely than the all-market average to go to the British countryside or villages, and to the coast or
beaches. Also, Hong Kongers visiting friends or family in the UK are more likely to do so than those on holiday.
Source: International Passenger Survey by ONS 20161.2 Getting around Britain: use of internal modes of transport
Propensity to use internal modes of transport
Bus, tube, tram or metro train 49%
64%
Taxi 28%
39%
Train (outside town/city) 23%
29%
Uber or other sharing app 10%
23%
Hired self-drive car/vehicle 5%
12%
Public bus/coach (outside town/city) 5%
5%
Private coach/minibus 2%
3%
Ferry/boat 1%
1%
Domestic flight 1%
3%
Other car/vehicle brought to the UK* 1%
0%
None of these 27%
10%
All markets Hong Kong
Visitors from Hong Kong are more likely than the all-market average to use all types of public transport during their stay in the UK apart
from a ferry or boat. The most popular forms of transport used during stays in the UK are buses, tubes, trams or metro trains.
Source: International Passenger Survey by ONS 2018; most lorry drivers were not asked this question, and as a consequence, are not
taken into account in the results for ‘car/vehicle you/group brought to the UK’1.3 Visitor demographics
Visitor characteristics
• 57% of visitors from Hong Kong were male in 2019, and male visitors are
particularly prominent within the business and VFR purposes.
• 67% of Hong Kong visitors are aged between 25-54 (2019) and this has Visits from Hong
remained the most prominent age band in the last decade. Over 1-in-4
Kongers aged over 55
have increased by to
• However, the 55+ age band has seen the most growth in inbound visitors visits from Hong Kong
within that time, reflecting an ageing population who are interested in
international travel. 3x
the UK between 2016
and 2018 were made by
• Due to the high number of migrants living in Hong Kong, only 63% of visits inBritish
the last decade
nationals
from this market are Hong Kong nationals. 16% of visitors are UK expats, and
11% are Chinese (2017-2019).
• Hong Kongers are most likely to travel to the UK solo, or with a spouse or
partner.
Source: International Passenger Survey by ONS1.3 Visitor demographics: gender and age groups
Gender ratio of visits (2019): Age group trend (visits in 000s)
2019 1 51 79 94 99 56 14
All markets 59% 41% 2018 5 57 72 92 97 50 16
2017 7 40 116 91 90 46 7
Hong Kong 57% 43%
2016 18 28 74 77 75 45 17
Male Female 2015 10 39 67 72 62 20 6
2014 7 27 58 53 59 25 9
Gender ratio of visits from Hong Kong by journey 2013 5 26 49 57 59 25 9
purpose (2019): 2012 5 22 42 53 48 19 3
Misc. 48% 52% 2011 4 21 48 54 46 16 4
Study 10% 90%
2010 3 18 31 53 40 20 3
VFR 59% 41%
2009 8 14 38 48 41 14 6
Holiday 52% 48%
0% 20% 40% 60% 80% 100%
Business 76% 24%
0 -15 16-24 25-34 35-44 45-54 55-64 65+
Male Female
Source: International Passenger Survey by ONS1.3 Visitor demographics: origin
Visitor nationalities
• 63% of visits from Hong Kong to the UK were made
(2017-2019 average proportion of visits)
by Hong Kong nationals in 2017-2019.
• However, significant proportions are also UK nationals
63%
(16%) and Chinese nationals (11%).
• Other nationalities featuring in visits to the UK from
Hong Kong include the USA (2%), Australia, Canada,
India, and Italy (1% each).
• The composition of the Hong Kong population partially
explains the visitors’ nationality split: international
migrants represent over 40% of the population in
Hong Kong, while the world’s average is around 4%.
16%
11%
9%
Hong Kong UK China Other
Source: International Passenger Survey by ONS, UN Migration report 2019 Highlights1.3 Visitor demographics: travel companions
Who have Hong Kong visitors to the UK travelled with?
42% 41%
34%
29%
14% 12%
10%
8% 7% 7% 8%
5% 4%
3% 3% 3% 2% 1%
Travelling on Spouse/PartnerChild(ren) aged Child(ren) aged Child(ren) aged Adult family Adult friends Business Part of a tour
Own 0-4 5-11 12-17 member(s) colleague(s) group
Hong Kong All markets
Similar to the all-market average, visitors from Hong Kong are most likely to travel to the UK solo. However, they particularly
over-index on holidays with a spouse/partner. If travelling with children, those are most likely to be aged 5-11.
Source: International Passenger Survey by ONS, 2017, Who accompanied you on your visit to the UK, excluding UK residents you may have
visited during your trip?1.4 The UK and its competitors (1) Market size, share and growth potential • The UK was the 8th most visited destination overall from Hong Kong travellers in 2019, and the 1st outside Asia. • Most overnight visits from Hong Kong are made within North East Asia: visits outside neighbouring China and Macao only represented 23% of the overall The UK ranks Hongkongese outbound market in 2019. 1st • Overnight visits to the UK from this market have grown steadily over the last most visited destination in decade; however, due to the COVID-19 pandemic, visits declined by 82% in 2020 Europe from Hong Kong compared to 2019. Hong Kong is currently forecast to recover to 2019 levels of visits by 2025. • In 2025, the UK is forecast to retain its position leading Europe in terms of preference from Hong Kong travellers. • Within our competitor set of destinations (see chart on slide 26), the UK saw the largest increase in market share between 2009 and 2019, with a growth of 7 percentage points. However, looking further ahead, both Australia and New Zealand are forecast to gain the most share from 2019 to 2029, at 2 percentage points each, while the UK is forecast to lose 2 percentage points in the same period. Source: Oxford Economics
1.4 The UK and its competitors (2)

The UK’s market share of Hongkongese visits among                                         Historic and potential visits to the UK (000s)
competitor set
                                                     21%                                       500
        Australia                                          25%                                                                                               460
                                                             26%
                                                                                               450
                                           16%
         Canada                         13%
                                      11%                                                      400
                              8%
         France         3%                                                                     350
                       3%
                         4%                                                                    300
            Italy     2%
                      1%                                                                       250
                        3%
   New Zealand           4%                                                                    200
                            6%
                           5%                                                                  150
     Switzerland               9%
                               9%
                                                                                               100
                                                           25%
United Kingdom                                                        32%
                                                                   29%                           50
                                              17%
   United States                       12%                                                        0
                                        13%                                                           1997 2000 2003 2006 2009 2012 2015 2018 2021 2024 2027 2030

                              2009     2019     2029

Source: Oxford Economics for competitor set based on overnight visits, ‘Historic and potential visits‘ displays total visits based on
International Passenger Survey historic data and Oxford Economics forecasts with VisitBritain adaptations
Experiences and perceptions
Chapter 2
©VisitBritain/ Herewegoagain.blog2.1 Inbound activities: summary
Top 10 activities for Hong Kong visitors during their
• Among Hong Kong visitors, dining in restaurants is visit to the UK
the most popular activity, followed by shopping and
sightseeing famous monuments/buildings. Visiting 1. Dining in restaurants
museums or art galleries and parks and gardens 2. Going shopping
also often feature in visits from Hong Kong to the
UK. 3. Sightseeing famous monuments/ buildings
• Overall, Hong Kongese visitors are more likely
4. Visiting museums or art galleries
than the all-market average to dine in restaurants,
go shopping (when shopping they are most likely 5. Visiting parks or gardens
to buy clothes/shoes), and visit parks or gardens.
6. Walking in the countryside
• In contrast, when compared to the all-market
average, visitors from Hong Kong are less likely to 7. Going to the pub
socialise with the locals, and go to the pub.
8. Socialising with the locals
• Hong Kongese visitors are more likely to watch a
live football match than any other sports. 9. Having a traditional afternoon tea
10.Visiting religious buildings
For more information on activities, please visit our
webpage of activities undertaken in Britain
Source: International Passenger Survey by ONS, rankings based on 2006-2019 data2.1 Inbound activities: tourism and heritage
Propensity to visit museums and galleries Propensity to visit built heritage sites
VFR: went sightseeing 45% 17%
43% VFR: visited religious buildings
5% 18%
VFR: went on a guided tour
9% 22%
28% VFR: visited castles/historic houses
VFR: visited museums and art galleries
24% 24%
Holiday: went sightseeing 77% 33%
70% Holiday: visited religious buildings
35%
Holiday: went on a guided tour 30%
30% 45%
61% Holiday: visited castles/historic houses
Holiday: visited museums and art galleries
49% 48%
Business: went sightseeing 33%
Business: visited religious buildings 10%
15% 4%
Business: went on a guided tour 10%
4% 10%
Business: visited castles/historic houses
Business: visited museums and art… 20% 6%
7%
All journey purposes: went sightseeing 61% All journey purposes: visited religious buildings 22%
47% 21%
All journey purposes: went on a guided… 18%
16% All journey purposes: visited castles/historic 30%
All journey purposes: visited… 40% houses 28%
29%
Hong Kong All markets Hong Kong All markets
Source: International Passenger Survey by ONS, 20162.1 Inbound activities: culture
Propensity to participate into other culture-related
Propensity to attend the performing arts
activities
All journey purposes: went to the 9%
theatre/musical/opera/ballet 11% 5%
All journey purposes: visited literary, music,
All journey purposes: attended a festival 3% TV, or film locations
2% 9%
All journey purposes: went to a live music 7%
event 9% Business: visited literary, music, TV or film 1%
Business: went to the 2% locations
8% 10%
theatre/musical/opera/ballet
Business: attended a festival 1%
0% Holiday: visited literary, music, TV, or film 9%
2% locations 11%
Business: went to a live music event
10%
Holiday: went to the 15%
theatre/musical/opera/ballet 17% VFR: visited literary, music, TV or film 5%
4% locations 4%
Holiday: attended a festival
3%
Holiday: went to a live music event 10% 12%
13% Study: visited literary, music, TV or film
VFR: went to the locations 26%
8%
theatre/musical/opera/ballet 8%
VFR: attended a festival 3% 1%
2% Misc: visited literary, music, TV or film
locations 5%
VFR: went to a live music event 7%
4%
All markets Hong Kong
All markets Hong Kong
Source: International Passenger Survey by ONS, 2016 & 20172.1 Inbound activities: sports
Propensity to partake in sports-related activities Number who watched sports live during trip (000s)
5%
VFR: played golf 16.0
2%
3%
VFR: played football
1%
8%
VFR: took part in sports activities
3%
2%
Holiday: played golf
1%
1%
Holiday: played football
0%
2%
Holiday: took part in sports activities
3%
2%
All journey purposes: played golf
1%
3.4 3.2
2%
All journey purposes: played football 2.1
0%
All journey purposes: took part in sports 4% 1.0 0.8
0.5 0.4
activities 2%
Hong Kong All markets
Source: International Passenger Survey by ONS, 2011 & 20142.1 Inbound activities: outdoors
Propensity to go for a walk or cycle Propensity to enjoy the outdoors
VFR: Cycling/mountain-biking 3% 32%
0% VFR: Going for a walk, hike or ramble
22%
VFR: Walking along the coast 14%
13% VFR: visiting a National Park 11%
6%
VFR: Walking in the countryside 42%
30% VFR: Visiting parks or gardens 33%
32%
Holiday: Cycling/mountain-biking 0%
0% Holiday: Going for a walk, hike or ramble 14%
16% 21%
Holiday: Walking along the coast
15% Holiday: Visiting a National Park 12%
36% 11%
Holiday: Walking in the countryside
25% 52%
Holiday: Visiting parks or gardens
0% 50%
Business: Cycling/mountain-biking
0% 19%
Business: Going for a walk, hike or ramble
Business: Walking along the coast 2% 6%
2% 1%
12% Business: Visiting a National Park
Business: Walking in the countryside 1%
5%
Business: Visiting parks or gardens 22%
All journey purposes: Cycling/mountain- 1% 8%
biking 0%
All journey purposes: Going for a walk, hike or 20%
All journey purposes: Walking along the 13%
11% ramble 17%
coast
All journey purposes: Walking in the 33% All journey purposes: Visiting a National Park 10%
countryside 21% 7%
All journey purposes: Visiting parks or gardens 38%
32%
Hong Kong All markets Hong Kong All markets
Source: International Passenger Survey by ONS, 2011, 2014, 2016 & 20192.1 Inbound activities: going out
Propensity to go to restaurants, or to have a traditional Propensity to go to the pub or bars and night clubs, or
afternoon tea to socialise with locals
28%
VFR: traditional afternoon tea VFR: socialising with the locals 29%
15% 45%
VFR: went to bars or night clubs 11%
84% 14%
VFR: dining in restaurants
65% 30%
VFR: went to pub
48%
25% 18%
Holiday: traditional afternoon tea Holiday: socialising with the locals
18% 32%
Holiday: went to pub 27%
83% 46%
Holiday: dining in restaurants
71% Holiday: went to bars or night clubs 6%
15%
11% 34%
Business: traditional afternoon tea Business: socialising with the locals
4% 15%
Business: went to bars or night clubs 19%
76% 7%
Business: dining in restaurants 35%
49% Business: went to pub
24%
All journey purposes: traditional 24% All journey purposes: socialising with the locals 25%
31%
afternoon tea 14%
All journey purposes: went to bars or night 10%
clubs 12%
All journey purposes: dining in 81%
30%
restaurants 63% All journey purposes: went to pub
41%
Hong Kong All markets
Hong Kong All markets
Source: International Passenger Survey by ONS, 2017 & 20192.1 Inbound activities: shopping
Propensity to go to shopping Propensity to purchase selected items
None of these 29%
77% 38%
VFR: went shopping 19%
Other holiday souvenir 16%
61%
Items for your home e.g. furnishing 3%
3%
79% Electrical or electronic items e.g. camera 1%
3%
Holiday: went shopping
CDs, DVDs, computer games etc 7%
69% 5%
Food or drink 27%
24%
50% Games, toys or gifts for children 11%
Business: went shopping 9%
23% Books or stationery 23%
13%
Cosmetics or toiletries e.g. perfume 21%
12%
73%
All journey purposes: went Bags, purses etc 18%
shopping 9%
55% 12%
Personal accessories e.g. jewellery 10%
Clothes or shoes 54%
41%
Hong Kong All markets
Hong Kong All markets
Source: International Passenger Survey by ONS, 2017 (shopping) and 2013 (purchase of selected items) – please note
that the data about purchased items not yet updated given the revision of the 2009-2018 IPS data in May 20202.1 Inbound activities: learning
Propensity to participate in an English language course
Propensity to learn a new skill or craft
during a visit to the UK
3%
8% VFR: learned a new skill
2%
1%
Holiday: learned a new skill
5% 3%
6%
3% Business: learned a new skill
2% 2% 1%
2%
All journey purposes: learned a new skill
2%
% of all visits
All markets Hong Kong China Japan South Korea Hong Kong All markets
Source: International Passenger Survey by ONS (2018 & 2019) Did you go on any English language courses during this visit? Displayed
as % of all visits in this market, visits incl. participation in an English language course might be based on a small sample.2.2 Welcome and recommending Britain
Feeling of ‘welcome’ in Britain Likelihood to recommend Britain
82% 82%
74% 76%
24%
16% 19%
15%
2% 2%
0% 0% 0% 4%
2% 1% 0%
Very Welcome Neither Unwelcome Very
Welcome Unwelcome Extremely Likely Neutral Unlikely
likely
Hong Kong All markets Hong Kong All markets
Source: International Passenger Survey by ONS, 2017Understanding the market
Chapter 3
©VisitBritain/ Bob Radlinski3.1 Structural drivers
• Hong Kong was a British territory until 1997, when it was retroceded to China
under an agreement that makes it a Special Administrative Region of the
People’s Republic of China. The Hong Kong SAR is partly administrated by a
presidential limited democracy.
• With over 7 million inhabitants on a 1,108 km2 territory (about a third smaller
than Greater London), it is one of the most densely populated countries in the
world, with all inhabitants living in urban areas.
44.8
• Hong Kong has an ageing population. As of 2019, Hong Kong had the highest Median age in 2020,
life expectancy in the world, at 85 years. It also ranks low in terms of fertility one of the world’s
rate, with only 1.33 children born per woman in 2020. As a consequence, the
highest
percentage of seniors among Hong Kongers will continue to increase.
• Immigrants account for 4-in-10 Hongkongers: this has a big influence on
culture, as well as travel habits among residents.
• Full-time workers are entitled to between 7 and 14 days of paid annual leave a
year, depending on seniority (7 days for 1 or 2 consecutive years to 14 days
for people working for 9 consecutive years or more). In addition to these, there
are 12 national statutory holidays.
Source: CIA World Factbook 2021, UN‘s World Population Prospects 2019, UN‘s International Migration Report 2019, UNDP3.1 Structural drivers: demographic and social indicators
Population dynamics • The Hong Kong population is ageing. In 1980, Hong
Kongers’ median age was 26 years old; it was 41 years old
in 2010 and will be over 50 by 2040.
Measure 2020 estimate • Hong Kong has the world’s longest life expectancy at birth
(85 years old in 2019, compared to 70 years old for the
Total population (m) 7.5 world’s average life expectancy). There are a range of
possible explanations for this including strong infrastructure,
Population growth (2015-2020) 4.3% green spaces, healthcare provision, and healthy diets. Hong
Percentage of international Kong also has one of the lowest global fertility rates (1.33
40%
migrants in population children per woman, compared to a global average of 2.47).
• In 2019 about 4-in-10 Hong Kong residents were born
Indicator 2010 2020 2030 2040 elsewhere, constituting 2.9 million residents. In 2017 there
were 2.3 million migrants from China alone living in Hong
Fertility rate (live births per Kong, one of the largest migration groups within a single
woman, over 5 years ending 1.04 1.33 1.48 1.58 country.
in year shown)
• As a city state, all residents of Hong Kong live in an urban
Median age (in years) 41.2 44.8 47.9 51.3
area, which makes them confident navigating in a busy city
but also increases their need to escape their vibrant city lives
to quieter environments, especially when on holiday.
Source: Oxford Economics, CIA World Factbook, UN‘s World Population Prospects 2019, UN‘s International Migration Report 2019, UNDP3.1 Structural drivers: economic indicators
• As a Special Administrative Region of the People’s Economic indicators (% growth unless stated)
Republic of China, Hong Kong is still quite dependent
on mainland’s China economy, as a large part of its Indicator 2019 2020 2021 2022
GDP is based on export activities to mainland China.
Hong Kong is one of two Special Administrative Real GDP -1.2 -7.6 5.0 3.6
Regions alongside nine cities who form the Greater
Bay Area. Real consumer spending -1.1 -11.5 7.5 4.2
• The Greater Bay Area plan will develop technology Unemployment rate (%) 3.0 6.1 6.4 4.8
and innovation by increasing links between the cluster
of cities. Hong Kong’s role will be to fully leverage its
• The global pandemic in early 2020 further worsened the
strengths as an international transportation, trade and
economic outlook.
aviation centre.
• Entering 2021, Hong Kong continues to battle against waves
• Before 2019, Hong Kong’s economic growth rates
of local COVID-19 outbreaks, with stringent containment
were above average for advanced economies.
measures restraining economic recovery.
• But 2019 was a difficult year for Hong Kong’s
• However, a domestic rebound is expected in H2 2021 as
economy, due to a combination of the US-China trade
vaccine programmes reduce the need for social distancing,
war, China’s economic slowdown and political turmoil
while external demand should continue to revive as the
in the form of months of protests. This led the
global economy recovers. Growth is estimated to rebound to
economy into a recession due to plunging tourism
5% this year.
and retail numbers.
Source: Oxford Economics, Hong Kong Economy Research, BBC News3.1 Structural drivers: exchange rate trends
Exchange rate trends (cost of GBP in HK$)
18.00
16.00
14.00
12.00
10.00
8.00
6.00
4.00
2.00
0.00
2001 2002 2003 2004 2005 2006 2007 2008 2009 2010 2011 2012 2013 2014 2015 2016 2017 2018 2019 2020 2021
Please find the most up-to-date exchange rate trend based on monthly averages on our website.
Source: Bank of England3.2 Consumer trends
• The share of Hong Kongers aged 65+ is set to increase from 15% in 2014 to 21% in 2024.
With growing life expectancy, Hong Kongers have started to place more importance on quality
of life, and show more and more interest in leisure activities and in wellbeing and health.
• The government itself is investing more and more in solutions that allow people to live better,
especially for the elderly. The leisure, entertainment and travel and tourism sectors are
increasing advertising spend, as more people take an interest in these sectors. However,
inbound tourism to Hong Kong was severely affected by political unrest in the second half of
Beach
2019, and subsequently, COVID-19 in early 2020.
destinations
• Many retired people enjoy travelling to learn new things, and reward themselves after long
years of hard work by experiencing the world. Others try to escape their busy city life and were emerging as
pursue activities they cannot do in Hong Kong itself. Relaxation on a spa holiday, a cruise, or popular among Hong
even learning new skills in cooking, photography or other interests are also common Kong travellers in 2019
motivations to travel.
• Many Hong Kong children are sent abroad to study quite young: more and more parents travel
to find a suitable school, and then to visit their children.
• Due to the COVID-19 outbreak, visits from Hong Kong to the UK decreased by 43% in the first
three months of 2020 compared to those months in 2019*, and Oxford Economics estimates
that total visits were down by 82% throughout the year. Vaccines will be a key driver to restart
international travel from this market. Over a fifth of Hong Kongers plan to take more frequent
holidays post pandemic, and 71% are willing to spend more than usual on their next trip.
Source: Oxford Economics, Skyscanner APAC Travel Trends 2019, IPS, Oxford Economics *provisional data for January-March 2020 (latest available at
time of writing), Expedia 20213.2 Consumer trends: travel trends pre COVID-19
• As of 2019, Hong Kong travellers still favoured longer getaways, but were interested in
Most popular destinations (2019)
off-the-beaten-path destinations, as social media inspired trips declined in interest by
45%.
Tapei, Taiwan • Hong Kong’s top five emerging destinations showed a growing interest in beach
experiences like Phu Quoc and Krabi. Local gastronomy trips were becoming even
Seoul, South Korea
more popular with Hong Kongers visiting other Asian cities like Jeju and Okayama for
Bangkok, Thailand food experiences. There was also a growing trend of Hong Kongers booking Slow
Travel trips to Istanbul (average of 11 days or more), and taking their time to explore
Osaka, Japan the vastly rich culture. These trends reflect the need to escape the stress of crowded
city life and its fast paced environment.
Top emerging destinations (2019) • Hong Kongers are most likely to take between 1 and 4 international trips per year, and
below 5% have not travelled internationally in the last year.
Phu Quoc, Vietnam
Krabi, Thailand Number of international travel trips over the past 12 months (2018)
Jeju, South Korea 60%
50%
Okayama, Japan None
40%
Istanbul, Turkey 1 to 2
30%
3 to 4
20%
5 to 6
10%
7 and above
0%
Hong Kong Japan South Korea
Source: Skyscanner APAC Travel Trends 2018, 20193.2 Consumer trends: changing society between traditions and
modernity
• Hong Kong’s culture is a fusion between Eastern and Western culture. Traditional Mah-jong, Cantonese opera, and martial arts (tai chi,
kung fu) are popular among Hong Kongers. Gambling on mah-jong games, or sports games is also quite common. However, as Hong
Kong grew as a city, it also grew as a destination on its own, and became particularly appealing for a shopping trip from mainland China.
Hong Kongers are used to having a large range of shopping options, including luxury brands, and so like going shopping at home, but
also during their trips abroad.
• Hong Kong people live longer than before and have a relatively high purchasing power on average. This has encouraged them to
question their culture of long working hours, and more and more time has been dedicated to leisure lately.
• Given that Hong Kong is a city-state, most activities will be indoors as there are few outdoor facilities for sports or other outdoor
activities. Travelling is often seen as a way to escape the stress and of a crowded city life and its fast-paced environment. Most can
afford to and like to travel, and many pursue their interests while doing so: special themed tours and packages have multiplied, such as
photography tours, luxury sports car self-driven tours, cycling packages, Formula 1 packages or film-specific tours. It is even more easy
for Hong Kongers as 94 destinations offer them free-visa or visa-on-arrival visit options.
• In terms of motivations, some like to pursue outdoor activities, while others are looking for relaxation and diversion from everyday life in
places like Thailand, Bali, Vietnam, and beyond. With a Hong Kong cruise terminal built in 2013, interest in cruises grew, in particular for
multi-generational, family holidays or for high-end consumers. Food is also an important part of the travel experience. 26% of Hong
Kongers eat out at least once a day (2.6 times the Asian average), and Hong Kong is renowned for its food options all over Asia so they
have particular interest for food.
• Hong Kong parents spend more on children’s education than most: US$132,161, about three times the global average. Many parents
send their children to study overseas after the first 3 years of secondary school, and available data suggests that the top destination is
the UK, followed by mainland China, Australia, Taiwan, the US and Canada. Parents are increasingly travelling to identify appropriate
schools or to visit them in advance.
Source: The Passport Index 2021, Nielsen Insights 2019, HSBC’s ‘The Value of Education – Higher and higher’ report (2014-2017), Hong Kong
Education Bureau3.2 Consumer trends: living longer and better
Wellbeing and health
• The pursuit of better living is booming in Hong Kong. People want to maintain both their mental and their physical health as
wellbeing becomes an increasingly important part of their longevity. 8-in-10 people aged 50-64 say staying fit and healthy is one of
their key priorities.
• In response to long working hours, the government is taking more and more actions to enhance wellbeing. The 2019/2020 Hong
Kong budget revealed that HK$10 billion was set aside as a Public Healthcare Stabilisation fund to ensure a steady stream of
funding for these services. This complemented an additional HK$5 billion for upgrading and acquiring medical equipment.
• Hong Kong residents’ consumption of leisure products has increased. Going to beauty centres, health and fitness (yoga) clubs, or
spas, but also travelling for spa treatments or other relaxing experiences are quite frequent. With on average 6,880 steps made per
day, Stanford University found out that people in Hong Kong were the most active in the world.
• Environmental and ecological concerns are becoming mainstream amongst Hong Kong consumers. Eating well is also a growing
concern. Health products and supplements are some of the most heavily advertised products in Asia, and many Hong Kongers look
for organic and macrobiotic products and supplements. They also pay attention to the provenance of their food as environmental
awareness grows.
Ageing population
• The government also increasingly recognises the growing needs of older consumers, or ‘greying’ consumers, aged 60 years old and
over. According to Oxford Economics data, the share of Hong Kongers aged 65+ is set to increase from 15% in 2014 to 21% in
2024.
• The 2019/2020 Hong Kong Budget provides one additional month of old age allowance and old age living allowance, in addition to a
one off additional HK$1,000 worth of elderly health care vouchers to eligible elderly persons.
• This has a large impact on the health care system, but also telecommunications services and even the travel market. These people
usually spent their whole lives working and are now interested in experiencing the world.
Source: Nielsen Insights (2017), PricewaterhouseCoopers‘ 2019/2020 Hong Kong Budget Snapshot, Statista, Oxford Economics3.2 Consumer trends: impact of COVID-19 and BNO immigration route
• Due to the COVID-19 outbreak, visits from Hong Kong to the • Anecdotal evidence from the Hong Kong travel trade
UK decreased by 43% in the first three months of 2020 suggests that some parents are already looking to take
compared to those months in 2019*, and Oxford Economics advantage of the new BNO immigration policy; searching
estimates that total visits were down by 82% throughout the for a university for their children and considering investing
year. However, a new visa policy announced in 2020 and in UK property so that students can stay in the country
brought into force in 2021 may constitute one opportunity for after graduation. Product development linked to regions
recovery. with top universities has already begun.
• British National Overseas (BNO citizenship) is a type of British
nationality created in 1985 to allow Hong Kong citizens to
retain a link with the UK. It has enabled visitors from Hong BNO passports approved for Hong Kong
Kong to stay in the UK for 6 months without a visa. residents (000s)
• However, a new system, in place from 31st January 2021,
216
allows BNO citizens and their close family to apply for two
periods of five years to live and work in the UK. After one year
of this status, individual are able to apply for British citizenship. 151
The new system was put in place to react to China’s security
law enacted in June 2020.
• The British government estimates that 5.4 million Hong Kong
residents are eligible for the scheme (72% of the population),
and 300,000 people are expected to take up the offer in the 34
22 17 18
first five years. It is important to note that the scheme has the
potential to negatively impact the relationship between the UK
2015 2016 2017 2018 2019 2020
and China.
Source: BBC, IPS, Oxford Economics *provisional data for January-March 2020, (latest available at time of writing), Bloomberg3.2 Consumer trends: post COVID-19 travel sentiment
• Hongkongers love to travel, with 78% of respondents to a recent survey by
Most popular post COVID-19 destinations
Expedia saying they had less joy in their lives because of the inability to travel
in 2020. As an alternative to jet-setting, 44% spent their time cooking, 38%
Tokyo
focused on exercising, and 40% enjoyed playing online games. In
Tokyo is known as a key destination for Hong
comparison, 26% of the 300 Hong Kong participants said they just spent their
Kong’s foodies, and can be regarded as something
time whiling away the day and reminiscing about past travel.
of a second home
• Three in every four Hong Kong respondents said that they cancelled their
Bangkok
trips due to the ongoing health crisis and a fifth of the respondents said they
Hong Kongers tend to lead a fast paced life, so
had spent their last vacation on a staycation.
want to enjoy a slower paced life on Thailand’s
• Market indicators show that there is still a high level of wanderlust among
beaches
Hongkongers. 42% of respondents said they anticipate taking at least the
Taipei
same number of vacations as previous years, with 21% intending to take
Taipei is only an hour away from Hong Kong, and
more and 71% planning on spending more on a bucket list vacation in 2021.
provides an abundance of green spaces, waterfalls
Meanwhile, 19% of Hong Kong respondents say that they have already
and rock formations
booked in holidays for the year ahead.
• 47% percent of Hong Kong respondents stated that they now value vacations
where they are immersed in discovery, aspirations, and growth. Others are
looking forward to itinerary-based holidays with activities like sightseeing
attractions, museums, and monuments, while others are considering country
experiences where they can try local cuisines.
• Almost half of the survey participants said they would wait for vaccines before
they hop on a plane, while others will delay travel plans to the later part of the
year.
Source: Expedia 20213.3 Booking and planning
• Hong Kongers are usually seasoned travellers, taking 3 to 4 international trips
per year.
• Hong Kong travellers are more likely than those across the APAC region to use
a desktop to book travel – with an even 50% split between desktop and mobile.
They commonly search for travel information and inspiration at home, in bed
late at night before going sleep, however 56% do access this content at the
office.
63%
of Hong Kongers are
• Hong Kongers are highly influenced by celebrities and social media influencers
influenced by celebrities
when deciding on a holiday destination. 63% cite celebrities and influencers as and influencers when it
impacting their plans, vs. 5% of Japanese and 3% of South Koreans. comes to travel
• The most prominent motivation for travel is for rest and relaxation, with 83% of destinations
Hong Kongers choosing this.
• Most Hong Kongers plan a visit to the UK on its own, and not as part of a multi-
country trip; this is below the all-market average (69% compared to 87%).
Source: Skyscanner APAC Travel Trends 2018, IPS3.3 Booking and planning: drivers and influences
Influences for choice of travel destination Motivations for travelling
Celebrities and influencers 63% Rest and relaxation 83%
Social media 59% Seeking experiences 58%
Word of mouth 43% Explore new destinations 55%
TV shows 40% Self fulfilment 41%
Others 20% Bragging rights 9%
Advertisement 9% Others 7%
• Hong Kongers are particularly influenced by celebrities and • When travelling, Hong Kongers are most likely to be
influencers when it comes to their choice of travel seeking rest and relaxation, with 83% choosing this
destination, whereas the importance of these sources has motivation. Next, they are similarly likely to travel in order to
been waning across the NE Asia region in recent years. For seek experiences (58%) and explore new destinations
example, only 5% of Japanese travellers are influenced by (55%). They are least likely to choose to travel for bragging
celebrities and influencers, and 3% of South Korean rights (9%).
travellers. • Within the region, this is similar to Japanese and South
• Social media is the second most importance influencer at Korean travellers, who are also most likely to seek rest and
59%, followed by word of mouth at 43%. relaxation.
Source: Skyscanner APAC Travel Trends 20183.3 Booking and planning: location, timing and devices
Device preferences (2018)* Location of travel research (2018)
Peak time of app usage
Home/bed 61% 11pm – 1am
Office 56%
Desktop
50% 50% Café 33%
Mobile
Transport 23%
Others 21%
Toilet 15%
Queue 12%
• Data from Skyscanner reveals that the majority of Hong Kong • These behaviours are relatively similar across other North
travel searching on the app takes place between 11pm and East Asian markets. The most popular location for travel
1am, matching typical bedtimes. This suggests that searching research for Japanese residents is also at home in bed, at
for inspiration is a part of evening routines. 91%, and for South Koreans at 50%.
• Linked to this is the fact that 61% of travel research happens at • However, Hong Kong is unique in the fact that market
home, in bed. The second most popular location for travel share for using a desktop for travel research remains
inspiration is at the office at 56%. Hong Kong residents are relatively high at 50%, compared with Japan where it falls
least likely to search for travel inspiration while queuing, to 32%, and 34% in South Korea. When it comes to
although 12% still do this. booking their trip, 40% of Hong Kong travellers used their
mobile phone.
Source: Skyscanner APAC Travel Trends 20183.4 Reaching the consumer
• Hong Kongers are well connected, and most use social media regularly, with
the majority accessing these platforms on mobile devices. Thus, optimising
content for social media sharing and mobile connection is critical.
• Online shopping is also popular; an average Hong Kong consumer spends
more than 6 hours per day on the internet, and 70% have purchased a product
online in the past month. The travel e-commerce category grew by 8.5% 78%
between 2018 and 2019. of Hong Kongers are active
• Hong Kong is home to one of the largest film industries in Asia. When it comes to social media users, and
TV, 4 commercial terrestrial TV networks each manage multiple stations. these users have an
average of 9 social media
• Newspapers and magazines are still important in Hong Kong. There is a large
accounts each
array of both English- and Chinese-language titles. Most of them also have an
online version, as news are more and more read online. Some news websites,
such as HK01 in Chinese or Hong Kong Free Press in English, have become
more prominent for their perceived independence.
Source: Statista, BBC Hong Kong media profile, Hootsuite3.4 Reaching the consumer: print media landscape
• Print media are still very relevant in Hong Kong: the territory Newspapers Other information
has long been a major centre for print journalism. The Standard (English),
• Hong Kong’s Basic Law secures freedom of speech and of the Headline Daily, AM730, Sky Free, daily newspapers
Post, Metro Daily
press. 30% of Hong Kongers stated they trusted news media South China Morning Post
most of the time in 2020, which is about on par with UK Daily newspapers
(English)
respondents (28%), and the US (29%). To make sure they Oriental Daily News, The Sun Owned by Oriental Press Group Limited
read independent news, Hong Kongers are increasingly
turning to news websites (HK01 in Chinese, Hong Kong Free Daily owned by Media Chinese International
Ming Pao
Limited, 2 Canadian editions (Toronto, Vancouver)
Press in English, or Stand News for example).
Widely read newspaper owned by Sing Tao News
• There are both Chinese-language dailies and a handful of Sing Tao Daily
Corporation Limited, many bureaus overseas
English-language titles. Most local papers have known political
Oldest Chinese-language newspaper in Hong
alignments. The print media landscape can appear quite Sing Pao Daily News
Kong
fragmented with large choice of titles. Major print media groups Leading newspapers, strong links with mainland
Ta Kung Pao, Wen Wei Po
expanded vertically and now offer online versions, adding China
video content and webcasts to their printed versions. Hong Kong Commercial Daily,
Hong Kong Economic Journal,
• Some of the main Chinese corporations can own some of the Hong Kong Economic Times,
Daily business newspapers
most important papers in Hong Kong: the South China Morning Wall Street Journal
post, an English-language paper, is owned by Alibaba for Tabloid-style, Hong-Kong based newspaper
Apple Daily
example. owned by Next Media Limited
• Some weekly magazines have tags on pages for mobile Sunday Examiner (English), Weekly newspapers owned by the Catholic
Kung Kao Po Diocese of Hong Kong
phones to scan and then open websites to download special One of few weekly newspapers in Japanese in
promotions and offers. Hong Kong Post (Japanese)
Hong Kong
Source: BBC Hong Kong media profile, StatistaYou can also read