Managing the net-zero transition
←
→
Page content transcription
If your browser does not render page correctly, please read the page content below

FOR PUBLIC DISTRIBUTION IN THE U.S., CANADA, HONG KONG, SINGAPORE AND AUSTRALIA.
FOR INSTITUTIONAL, PROFESSIONAL, QUALIFIED INVESTORS AND QUALIFIED CLIENTS IN OTHER PERMITTED COUNTRIES.

Managing
the net-zero
transition
The journey to net-zero carbon emissions is
unfolding now - and offers extraordinary
investment risks and opportunities.

February 2022

                                                                                                           BIIH0222U/M-2018076-1/16
FOR PUBLIC DISTRIBUTION IN THE U.S., CANADA, HONG KONG, SINGAPORE AND AUSTRALIA.
                                                 FOR INSTITUTIONAL, PROFESSIONAL, QUALIFIED INVESTORS AND QUALIFIED CLIENTS IN OTHER
                                                 PERMITTED COUNTRIES.

                                                 Introduction
                 Philipp Hildebrand              The transition to decarbonize the world is happening. Whether the
                 BlackRock Vice
                                                 goal of net-zero carbon emissions is achievable by 2050 is far from
                 Chairman
                                                 certain. What is clear: Ignoring the transition is no longer an option.
                                                 Understanding how the journey will unfold in years to come has
                                                 never been more important for companies and investors alike.

                                                 Planning for long-term decarbonization is challenging, especially at
                                                 a time of convulsions in the energy sector. Booming demand in the
                                                 powerful restart of economic activity and snarled supply have driven
                   Mark Wiedman
                                                 up prices of fossil fuels and their producers. This is happening even
                   Head – BlackRock
                   International and Corporate
                                                 as companies, financial institutions, and governments seek to
                   Strategy                      redouble their efforts to accelerate decarbonization to mitigate
                                                 climate risk. For investors, the resulting picture can be confusing.

                                                 Indeed, the path ahead is deeply uncertain and uneven, with
                                                 different parts of the economy moving at different speeds. The
                                                 transition will rewire economies, fundamentally reallocating
                                                 resources. This process will bring value creation—and destruction.
                                                 Spurred by government, consumer and investor actions, many
                                                 companies have already started to transform their business models.

                                                 A gradual and orderly transition will help mitigate pressure points
                                                 that could disrupt economic activity and drive up inflation, in our
                                                 view. This will allow time to make the necessary investments, phase
                                                 out carbon-intensive activities, redeploy workers, and develop new
                                                 technologies to power the net-zero economy.

                                                 Such a transition is the best macroeconomic outcome, we believe,
                                                 one that we see translating into a manageable rise in inflation and a
                                                 net gain for the global economy. Sure, economic outcomes would be
                                                 even better if there were no climate change. But that’s the wrong
                                                 starting point for comparisons because climate change is real.

                                                 A smooth transition, crucially, depends on government policy. The
                                                 risk to growth is that the current global drive to engineer an orderly
                                                 transition loses momentum. As each year passes without translating
                                                 commitments into sufficient action, the transition path becomes
                                                 steeper and more disruptive. This increases the risk of stranded
                                                 workers, communities and assets, higher inflation and economic
                                                 disruption amid an eventual rush to decarbonize.

                                                 Companies and investors must choose an approach to manage the
                                                 transition. All will need to navigate it by taking a view on how it will
                                                 unfold, and overhaul operations and portfolios accordingly. Some
Contents                                         will actively drive the transition with new investment or the financing
Summary                       3                  to enable it. And within that, some will focus on inventing the new
                                                 technologies needed to fully decarbonize. We see this creating
Rewiring the economy          4                  extraordinary investment opportunities in years to come.
Transition in action          6                  The transition won’t happen overnight, and the world will need to
Transition in practice        10                 pass through shades of brown to reach shades of green, as Larry
                                                 Fink’s 2022 letter to CEOs points out. Whether navigating, driving or
                                                 inventing, companies and investors need a map to plot their journey.
                                                 We aim to build out this map throughout the year, with more
                                                 insights on the speed and shape of the transition to come.

                                                                                                               BIIH0222U/M-2018076-2/16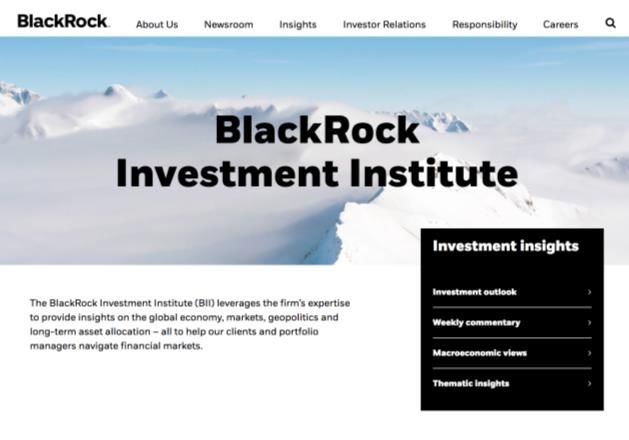
FOR PUBLIC DISTRIBUTION IN THE U.S., CANADA, HONG KONG, SINGAPORE AND AUSTRALIA.
FOR INSTITUTIONAL, PROFESSIONAL, QUALIFIED INVESTORS AND QUALIFIED CLIENTS IN OTHER PERMITTED COUNTRIES.

Summary
•   Climate risk is investment risk – and will be                              •   The transition’s value creation and destruction is
    determined by how the transition to a net-zero                                 being priced. We expected two years ago that a
    economy unfolds. On top of physical climate risks,                             tectonic shift toward sustainability would trigger a
    companies and asset owners must now grapple with                               great repricing of assets across the board. This is why
    the transition. Economies will be reshaped as carbon                           we incorporated climate change in our return and risk
    emissions are cut. The transition will involve a massive                       assumptions. We now have evidence of this repricing
    reallocation of resources. Supply and demand will shift,                       (page 8), and believe most of it is yet to come.
    with mismatches along the way. Value will be created
                                                                               •   The path of transition will shape the macro
    and destroyed across companies.
                                                                                   environment. A gradual, orderly transition, supported
•   The transition is happening, and companies and                                 by private capital and public aid for emerging markets,
    investors need to have view on how it’s evolving.                              should allow for a relatively smooth reallocation of
    Companies must decide how to revamp their business                             resources and moderate price increases. A sudden,
    models, where to invest and what operations to phase                           disorderly transition raises the risk of supply-demand
    out. Asset owners must decide where to put capital to                          mismatches, inflation spikes and growth disruptions.
    work, and how to use their shareholder votes to try to
                                                                               •   The popular notion that tackling climate change
    guard their long-term economic interests.
                                                                                   comes at a net economic cost is wrong, in our view.
•   Companies and investors are faced with great                                   Will the transition hurt growth? Will it trigger more
    uncertainty. The transition is underway, but its future                        inflation? Compared with the past, yes. But the rear-
    speed and shape are deeply uncertain. The outcome                              view mirror is irrelevant for what’s ahead, we believe.
    will be determined by an intricate interplay of evolving                       Climate change is real. An orderly transition should
    societal preferences, company strategies, capital                              boost growth and mitigate inflation versus no climate
    allocation, new technologies and government policies.                          action or an eventual rush to decarbonize, in our view.

•   The energy sector faces the starkest and most acute                        •   Our bottom line: Companies and investors cannot
    challenge. Its transition has so far been lopsided, with                       ignore the transition. It’s similar to how they had no
    extra investment in renewables failing to keep pace                            choice but to deal with China’s economic rise and the
    with reduced capex in fossil fuels. This mismatch has                          tech revolution. All companies and investors must
    contributed to energy price spikes in the economic                             navigate the way economies are being re-wired by
    restart, giving a glimpse of what a disorderly transition                      taking a view on how the transition will shape their
    could look like. The outlook for renewables is bright,                         operations or investments. Some may choose to drive
    and we see a need for lower-carbon fossil fuels to meet                        the transition via thematic or impact investments or
    global energy demands during the transition.                                   invent the net-zero world by funding new technologies.

Authors
                  Paul Bodnar                                      Jean Boivin                                Alex Brazier
                  Global Head – BlackRock                          Head – BlackRock                           Deputy Head –
                  Sustainable Investing                            Investment Institute                       BlackRock Investment
                                                                                                              Institute

                  Natalie Gill                                     Vivek Paul                                 Chris Weber
                  Portfolio Strategist –                           Senior Portfolio                           Head of Climate Research
                  BlackRock Investment                             Strategist – BlackRock                     – BlackRock Sustainable
                  Institute                                        Investment Institute                       Investing

3    Net-zero transition

                                                                                                                       BIIH0222U/M-2018076-3/16
Rewiring the
global
economy

A massive reallocation of resources lies at the
heart of the transition to a net-zero world. We
lay out the key drivers powering the transition
and show how the interplay between decision
makers results in macro and market changes.

4   Net-zero transition

                                              BIIH0222U/M-2018076-4/16
FOR PUBLIC DISTRIBUTION IN THE U.S., CANADA, HONG KONG, SINGAPORE AND AUSTRALIA.
FOR INSTITUTIONAL, PROFESSIONAL, QUALIFIED INVESTORS AND QUALIFIED CLIENTS IN OTHER PERMITTED COUNTRIES.
An economic rewiring
The transition is fundamentally a rewiring of economies, The result? A rewired economy. Supply and demand will
with similarly transformative effects as the integration of shift, not always in tandem. Capital will be created and
China into the world’s trading system or the tech redeployed. The reallocation of resources will ultimately
revolution. We see three drivers of this: be huge, we believe. An example: The world would need to
cut global emissions in half by 2030 to achieve net zero
• Societal preferences: Consumer and investor
by mid-century, according to the 2021 Intergovernmental
preferences for greener services, products and
Panel for Climate Change report. That’s a 7% annual
assets.
reduction, we calculate, the type of decline the world only
• Technology: Capital costs of incumbent and new managed in 2020 by freezing much of the global
technologies; evolution of energy prices; innovations. economy when the pandemic hit.
• Policy: Climate-specific policies; broader energy, At least one out of 50 employees worldwide will move
industrial, infrastructure and land use policies. sectors by 2050 as part of this reallocation, according to
the International Monetary Fund’s 2020 outlook. And
Companies and asset owners must make decisions that’s before taking into account those who will move
about how to respond to these drivers. Companies must within sectors as some companies thrive and others
decide how to alter business models, where to invest become challenged. We expect this reallocation to create
and what operations to phase out. Asset owners and and destroy company cashflows (page 7), reprice assets
managers must decide how to put capital to work and (page 8), and reshape the macroeconomy (page 9).
use their shareholder votes with the aim to guard their or
their clients’ long-term interests. This is a tough adjustment to manage, We see a risk that
resources and demand become misaligned through the
We see this interaction between companies and asset transition. Companies and investors need to manage this
owners shaping the transition – and transforming macro risk on top of the other changes triggered by the
businesses and portfolios. See the graphic below. transition’s drivers (pages 10-14).
Transition in action
BlackRock guide to the net-zero transition, February 2022
Decision makers
Drivers Channels Outcome
Transition approaches
Asset owners Fundamentals
Societal
Cash flows for
preferences companies
change Transformation
Navigate
Technology of companies
Drive Macroeconomy
and
Invent portfolios
Repricing
Policy
Market value of
companies
Companies changes
The transition is powered by three main change agents: shifting societal preferences, new technologies and evolving
climate policies. Key decision makers - companies and asset owners - position themselves for the changes, further
shaping the transition. They can use three transition approaches: all must navigate or adapt to it; some will help drive
it through decarbonization investments or invent it by creating or funding new technologies. We see three main
channels on how these approaches shape the transition further: changes in company fundamentals, in asset prices
and in the economy at large. What is the potential outcome? A transformation of both the corporate landscape and
investor portfolios.
Source: BlackRock Investment Institute, Feb. 1, 2022. Notes: For illustrative purposes only. Subject to change without notice.
5 Net-zero transition
BIIH0222U/M-2018076-5/16The transition
in action
Companies are revamping business models,
and we see a repricing of assets across the
board. A smooth transition should boost
growth and mitigate inflation; a disorderly one
heralds price spikes and growth disruptions.
6 Net-zero transition
BIIH0222U/M-2018076-6/16FOR PUBLIC DISTRIBUTION IN THE U.S., CANADA, HONG KONG, SINGAPORE AND AUSTRALIA.
FOR INSTITUTIONAL, PROFESSIONAL, QUALIFIED INVESTORS AND QUALIFIED CLIENTS IN OTHER PERMITTED COUNTRIES.
Drivers in motion The times they are a-changin’
Share of net-zero pledges by key players, 2015-2021
The key drivers of the transition are in motion, with
expanding climate policies and regulations, rapid 100%
Share of revenue/GDP
technological advancements and fast-changing societal
n Countries
attitudes. Some may think the transition is evolving too 75% n Financials
fast; others may see progress as too slow. That’s besides n Companies
the point for investors, in our view. What matters is that 50%
the transition is happening and will shape cashflows,
risks and capital costs for years to come. As a result, it’s
25%
crucial companies and asset owners form a judgement on
how the transition will further unfold, and reposition their
businesses and portfolios accordingly. 0%
2015 2017 2019 2021
They need to do this now, we believe, not at some faraway
Source: BlackRock Investment Institute, with data from Net Zero Tracker consortium, Feb
point in the future. The transition is gaining momentum. 1, 2022. Notes: The chart shows the progress of country, financial institution and
There’s been a sea change in how countries, companies company net zero commitments. Companies and financial commitments are shown as a
share of revenue, country commitments as a share of GDP. Countries include the 197
and financial institutions view climate change in just a members of the United Nations Climate Change secretariat. Companies are the 2,000
few years. Countries representing nearly 90% of the world largest publicly traded companies tracked by Net Zero Tracker, and financials are a
subset of this group.
economy now have net-zero commitments, while about
half of major companies and financial institutions do. See The transition is ultimately about the replacing or
the chart at the top right. They are increasingly turning retrofitting the physical assets that power the modern
pledges into concrete targets. For example, the number of economy – power plants, steel mills, buildings, cars, ships
companies setting specific greenhouse gas reduction and planes – and these are capital-intensive assets. For a
targets has accelerated. company making or operating such assets, reallocating
the required cashflow is no trivial matter.
The transition is transforming the key energy sector.
Renewables generation and electric vehicles are fast How is this playing out across the corporate landscape?
gaining market share, and hydrogen projects to We see the largest effects and risks in the utilities, energy
decarbonize carbon-intensive industries are and energy-intensive industrial sectors. Changing
mushrooming (page 12). production costs, including possible CO2 taxes, and
demand are reshaping cash flows and terminal values.
We see the transition driving financial risk in sectors and
Driving sectoral transition
Examples of key transition drivers by sector, 2022 regions at different speeds. Why? The changes in cost and
demand affect sectors differently due to differences
Sector Transition drivers between policy, pricing power and the cost of eliminating
a unit of carbon. Climate policies can target specific
▪ Changing demand and prices
Oil & gas sectors, so the impact varies greatly. Some sectors can
▪ Carbon costs
more easily pass on increased input costs. And the
Electric ▪ Power demand availability and cost of low-carbon technologies vary by
utilities ▪ Policy incentives for renewables sector. The table on the left shows examples of key drivers
▪ Global carbon costs for selected sectors that investors need to form a view on.
Airlines
▪ Shift to other transport modes The result: Decarbonization is taking place across
▪ Oil price and demand by segment different sectors and regions at different rates. For
Road & rail
▪ Capital costs of new vehicles example, the IEA expects the electric utilities sector to
change most quickly in an orderly transition. It sees light
Marine
▪ Cost of alternative fuels vehicles next, with heavy transport (shipping, aviation)
shipping
and industry (steel, cement) moving more slowly. These
▪ Carbon capture and storage different speeds are driven by the relative cost of
Steel
▪ Furnace retrofit costs decarbonization in each sector. The slower sectors need
Metals & innovation to make net zero possible.
▪ Demand for batteries, equipment
mining
Our bottom line: Policy, technology and societal
Source: BlackRock Investment Institute, Feb. 1, 2022. Notes: These are illustrative preferences are driving changes in company
examples of what we view as key drivers by sector of the net-zero transition. They should
not been seen as exhaustive nor construed as investment advice. fundamentals at different speeds in different sectors.
7 Net-zero transition
BIIH0222U/M-2018076-7/16FOR PUBLIC DISTRIBUTION IN THE U.S., CANADA, HONG KONG, SINGAPORE AND AUSTRALIA.
FOR INSTITUTIONAL, PROFESSIONAL, QUALIFIED INVESTORS AND QUALIFIED CLIENTS IN OTHER PERMITTED COUNTRIES.
Assets are repricing
The transition’s complex interplay between companies What did we find? Relatively green sectors such as IT and
and asset owners is not just changing company brown ones such as utilities experienced a positive and
fundamentals; it’s also causing changes in valuations. We negative repricing in 2020, respectively. See the middle
theorized two years ago that this would happen – and we bars in the chart below. Our analysis shows this effect is
now have evidence that it is. new as it was negligible in the period 2016-2019 (the left
bars). We also find the repricing is taking place not just
We posited in 2020 that there was a tectonic shift toward
between sectors but also within them.
sustainable assets underway as investors increasingly
embrace sustainability – and made this the cornerstone Is there a sustainable bubble building? Not yet, in our
of our sustainability framework for portfolio construction. view. We find that the cumulative repricing so far is only a
This theory built on the notion that financial markets fraction of sector repricings such as the 1998-2002 dot-
don’t immediately price in slow-moving trends such as com bubble and 2007-2008 financial crisis. In fact, we
the impact of an aging population. We believed the expect more repricing in the next four years, based on
transition would create a similar phenomenon. Capital factors such as investor preferences for greener assets
and investments would increasingly flow to more and historical changes in risk premia for similar long-run
sustainable assets and away from less sustainable ones. transitions such as demographics (the chart’s right bars).
We argued that this would cause a repricing over time as Our bottom line: The great repricing of sustainable
we believed markets would get ahead of the actual assets we anticipated is actually happening now, and we
transition to a greener world. We put theory to practice believe it has room to run.
with the launch of our climate-aware capital market
assumptions (CMAs) in February 2021, or our long-term Green repricing: It’s happening
expectations of risk and return across asset classes. Relative returns of green vs. brown sectors, 2016-2025
The new CMAs incorporated the effects of a 10%
sustainability-driven repricing of assets, along with the n Green repricing
changes in the macro backdrop and corporate n Brown repricing
fundamentals linked to the transition. The result: We see 5%
Relative returns
the transition driving a relative return advantage for
sectors such as tech and healthcare over other sectors
0%
such as energy, all else equal.
Our view went against the popular notion that there was
no return advantage to be had from the green transition. -5%
Critics claimed sustainability should already be in the
price if markets are efficient, making expected returns
from sustainable investments lower than those of less- -10%
sustainable assets. Since then, there’s been an 2016-2019 2020 2021-2025
expectation
acceleration of investment flows into sustainable funds.
We believe this supports our original theory – and our
Past performance is no guarantee of current or future results. Forward looking
latest work shows the repricing is actually playing out. estimates may not come to pass.
Our new analysis goes beyond the common approach of Sources: BlackRock Investment Institute, with data from the Center for Research on
Security Prices, Feb. 1, 2022. Notes: To estimate climate-driven repricing, we attribute
measuring correlations between climate emissions and historic returns to two drivers: cashflow news and discount rate (DR) news. We then
valuation measures. Our method accounts for the myriad identify the DR news associated with climate change using carbon emission intensity
other factors that influence returns, such as news on (CEI) as a proxy. To isolate the DR component of returns, we apply the standard
decomposition formula of Campbell (1991) using a standard factor model of expected
fundamentals, common risk exposures and risk premia.
returns (which embed well-known predictors such as value, momentum, and quality).
This way, we can directly measure the repricing via Attribution to climate scores is then given by forecasting regressions of DR news on a
changes in the cost of capital – the compensation measure of CEI. Sector returns are MSCI US Sector index- weighted averages of stock-
investors require to hold a stock – that can be explained level returns. Green represents the technology sector, the most “green” in our work,
whereas the utilities sector is the most “brown” in the repricing. The 2016-2019 bars
by the transition. We proxy the exposure of companies to represent the total repricing over this period; and the 2021-2025 expectation is the
the transition by measuring a company’s carbon- cumulative repricing we expect over that period.The estimate is highly uncertain and is
emission intensity, or CO2 emissions, as a share of its based on factors including risk premia effects in other long-run transitions such as
demographic trends, market pricing of green bonds, and investor survey data on how
enterprise value. The higher its CO2 intensity, the more a
much return they would be willing to give up to for more sustainable assets. See
company or sector is exposed. Sustainability: the tectonic shift transforming investing of February 2020 for details.
8 Net-zero transition
BIIH0222U/M-2018076-8/16FOR PUBLIC DISTRIBUTION IN THE U.S., CANADA, HONG KONG, SINGAPORE AND AUSTRALIA.
FOR INSTITUTIONAL, PROFESSIONAL, QUALIFIED INVESTORS AND QUALIFIED CLIENTS IN OTHER PERMITTED COUNTRIES.
Macro impact
The huge reallocation of resources in the transition will Increasing energy prices and a re-allocation of resources
transform the macro environment. Will it hurt growth? are the consequences of tackling climate change. They
Will it be inflationary? Compared with the past, yes. But will impose costs on economies relative to the past. But
we believe the rear-view mirror is irrelevant for what’s we cannot go back to the past – and it is pointless to
ahead. Climate change is here – and an orderly transition make comparisons with it. Yes, the outlook would be
should boost growth and mitigate inflation versus all better if climate change didn’t exist. The problem: Climate
alternatives, in our view. change is real.
Overall production costs will likely increase as the world From here, the only possible alternative to the net-zero
shifts away from carbon-intensive energy sources. We see transition is to allow temperatures to rise to levels that
this happening whether the shift is prompted by carbon cause devasting damage. Today’s damage from extreme
taxes, regulations or consumers simply choosing to pay weather events is only a small fraction of the likely
more to avoid climate damages. economic disruption in the world we are tracking toward
under current policies, in our view. This could even
The extra production costs could reach as much as $160
include famine, mass migration and resource wars.
USD per ton of carbon emissions by 2030, according to
the Network for Greening the Financial System from June The avoidance of such climate-related damages and
2021. The U.S. emits about 240 tons of carbon per $1 green infrastructure spending far outweigh transition
USD million of expenditure. Result: Consumer prices costs, we estimate. All in all, an orderly transition should
could rise by as much as 4% by the early 2030s if all result in a 25% net gain in global growth by 2040, we
additional cost ends up there, we estimate. A smooth believe, compared with doing nothing or a disruptive
transition would add about 0.4 percentage points to transition. See the chart below.
inflation a year as a result. It could be lower if renewables
Our bottom line: An orderly transition to a net-zero world
become even more competitive over time. If the shift
results in lower inflation, higher economic growth and
happens faster – compressing price rises into a shorter
more financial stability than other scenarios.
timeframe – the inflation impact could be much bigger,
we believe.
Transition results in net economic gain
The inflationary impact of net-zero will be supplemented Estimated cumulative GDP impact of transition, 2020-40
by the transition’s resource re-allocation as demand and
supply shift across companies and sectors. This is an n Green infrastructure spending
Cumulative impact as % of GDP
underappreciated factor detailed in our January 2022 40
n Climate damage avoided
Macro and market perspectives. n Transition costs
n Total
We see a risk of resources becoming misaligned,
particularly if the transition is rapid and disorderly. 2021 20
gave a glimpse of what that could look like. In the
powerful economic restart from pandemic-driven
shutdowns, demand moved toward spending on goods,
0
from services. Supply couldn’t adapt quickly enough. The
result: bottlenecks, disruption and high inflation, even
though economies had yet to fully recover overall.
-20
Monetary policy cannot magically make this sort of
2020 2025 2030 2035 2040
supply-driven inflation go away. Trying to stabilize this
sort of supply-driven inflation would require destroying Forward looking estimates may not come to pass. Sources: BlackRock Investment
demand to squeeze wages and prices. There is no way of Institute, Banque de France, International Energy Agency, OECD, Feb 1, 2022. Notes:
avoiding macro volatility, in our view: the price is either The bars show the overall estimated impact of three factors – avoidance of climate
damages (positive), green infrastructure spending (positive) and costs associated with
higher inflation or destroyed growth. the transition (negative). The black line shows the estimated net impact. Our estimates
of the impact under a climate-aware scenario are based on expected changes in energy
We believe the most effective way to contain inflation and consumption including composition, relative carbon and renewables pricing and on
maintain growth is to ensure the transition is gradual. potential losses due to global warming. Energy consumption is estimated as a function
Supply and demand would keep pace, and necessary of GDP and the relative price of energy per the Banque de France's working paper no.
investment would have time to take place. A disorderly 759 titled the Long-term growth impact of climate change and policies. GDP losses
from global warming are calibrated on analysis of Impact Assessment Models per W.
transition, by contrast, raises the risk of supply-demand Nordhaus and A.Moffat (2017). We assume green infrastructure spending programs of
mismatches, inflation spikes, growth disruptions, and 1% of GDP gradually phased out over the next 10 years.
stranded workers, communities and assets.
9 Net-zero transition
BIIH0222U/M-2018076-9/16The transition
in practice
The transition’s path is deeply uncertain,
making it crucial to manage its risks and
opportunities. We show how companies and
investors can navigate, drive and invent the
transition, zooming in on the energy sector.
Navigate Drive Invent
10 Navigating net-zero
BIIH0222U/M-2018076-10/16FOR PUBLIC DISTRIBUTION IN THE U.S., CANADA, HONG KONG, SINGAPORE AND AUSTRALIA.
FOR INSTITUTIONAL, PROFESSIONAL, QUALIFIED INVESTORS AND QUALIFIED CLIENTS IN OTHER PERMITTED COUNTRIES.
Navigate
Navigating transition uncertainty
There is huge uncertainty about how the transition’s How should companies and asset owners go about this?
drivers will evolve from here. Government commitments First, they need data, models, analytics and tools at a
to reach net zero are now nearly universal, yet they are not granular level as they become available. Navigation
enough to deliver net zero by 2050. Already enacted requires an increasingly precise map over time. Second,
policies are even further behind, creating an companies and asset owners need to act on the views they
“implementation gap” between current policies and have developed with the help of these new insights.
pledges and an “ambition gap” between pledges and the
goals of the COP 21 Paris Agreement. Companies are overhauling their business models,
choosing where to invest and what operations to phase
The question is whether governments will actually close out. Industry leaders are focusing on core competencies
these gaps. Could they even backtrack? New elections geared toward the transition or are diversifying into
could bring new approaches. A focus on the short term growth businesses of the net-zero future.
could start to crowd out climate considerations. The
answers to these questions are crucial to the transition’s Many asset owners are navigating the transition through
path, or how fast and smoothly carbon emissions are security selection strategies that aim to manage the value
reduced to net zero. creation and destruction from these shifts. Two principal
navigation approaches have been used at scale: removing
The stylized charts below show the two key measures: companies or sectors viewed as not aligned with the
speed and shape. Transition speed (left chart) describes transition (screening), and over- or underweighting
how quickly the economy reaches net zero. Various policy companies based on static, backward-looking
paths give a wide range of outcomes for how fast CO2 Environmental, Social and Governance (ESG) metrics.
emissions can be cut, as the left chart shows. Transition
shape (right chart) describes how smooth the path will be, We think asset owners can do more to effectively navigate
or how orderly. The shape ranges from smooth to abrupt the transition. First, investors can measure transition
amid an eventual rush to decarbonize. readiness with forward-looking indicators, like emissions
targets or other data sources that give insight into how
The speed and shape of the transition are likely to power issuers are progressing along several ESG dimensions
risk and returns in coming years, so companies and and positioning themselves for the future. Second,
investors need to navigate this. To do so, they must stewardship—corporate engagement and the use of
develop informed views about the evolution of climate shareholder votes—can help make sure portfolio
policy, societal preferences and technological innovation; companies properly manage transition risks. And third,
the size and timing of mismatches in supply and demand ESG integration—using transition metrics throughout the
between and within sectors; and the timeframe and shape investment process—can help ensure that even portfolios
of the key energy transition (pages 12-13). without a climate focus are managing their transition risk.
Speed and shape key
Illustrative net-zero transition scenarios and stylized transition shape, 2022
No policy Shape
Speed
Enacted policies
Historical
CO2 Emissions
Implementation
Pledges gap
Ambition
Net-zero 2050
gap
2005 2020 2035 2050 2020 2040 2060
Year Year
Source: BlackRock Investment Institute, Feb. 1, 2022. Notes: The diagrams above serve as a general summary and should not been seen exhaustive nor construed as investment
advice. The left chart describes how quickly the economy reaches net zero. The implementation gap is the difference between current policies and pledges ; the ambition gap is the
difference between pledges and the goals of the COP 21 Paris Agreement. For illustrative purposes only.
11 Net-zero transition
BIIH0222U/M-2018076-11/16FOR PUBLIC DISTRIBUTION IN THE U.S., CANADA, HONG KONG, SINGAPORE AND AUSTRALIA.
FOR INSTITUTIONAL, PROFESSIONAL, QUALIFIED INVESTORS AND QUALIFIED CLIENTS IN OTHER PERMITTED COUNTRIES.
Navigate
Navigation in the energy sector
The energy and utilities sectors face perhaps the starkest Second, consumer and investor preferences are changing,
challenges in navigating the transition. These sectors as shown in consumer markets for EVs, electric heat
have long had the difficulty of trying to plan for long-term pumps and LED lighting. Investor-driven shifts toward
capital assets in an uncertain policy and resources sustainable investing are also driving repricing (page 8).
landscape. The drivers powering the entire net-zero We see many of these shifts accelerating, creating
transition are magnified in this space: uncertain future demand for energy and changing the
• Technology: Rapid technological change, driving cost of capital for traditional energy and renewables.
uncertainty in future production costs and demand. Third, and most importantly, the policy landscape is fast
evolving and highly uncertain. Consider how the huge
• Preferences: Shifting consumer demand for energy
ambition and implementation gaps between
and investor preferences for greener assets.
governments’ climate goals, pledges and actual policies
• Policy: A highly uncertain and fast-evolving affect the energy sector. If the world wants to achieve net-
environment, with great regional differences. zero emissions by 2050, the use of coal, gas and oil needs
to decline at a much faster clip than it would under
First, technological advances have upended the long-
current policies or pledges. See the green bars versus the
term outlook for energy demand. The role of renewables in
red and pink ones in the chart below. Renewables offer the
global electricity generation jumped to 29% in 2020, from
mirror image: They need to clock up much higher growth
27% in 2019, according to the IEA’s 2021 renewable
than they are currently tracking.
review. The price of renewables has dropped to levels near
or below fossil fuel-based generation in most regions, Government policy is instrumental in enabling a smooth
also helped by sharply rising fossil fuel prices. This means transition, in our view. As each year passes without
renewables are driving almost all new power capacity translating commitments into sufficient action, the
growth now, even as they face headwinds from the surge transition path becomes steeper and more disruptive.
in the prices of commodities, from copper and aluminium
to silicon. An energy mismatch
Energy growth needed vs. policies and pledges by 2050
Electric vehicles (EV) are becoming mainstream and are
showing early signs of eating into oil demand, supported
by a range of government policies, voluntary automaker Coal
pledges and consumer preferences. EV’s total global
market share rose above 7% in 2021, according to
BloombergNEF, driven by large growth in China. The Gas
adoption of EVs is set to spread from passenger vehicles
to commercial zero-emission vehicles. Oil
And there is optimism about the role of hydrogen to
decarbonize energy-intensive sectors. Seventeen Electricity
countries have developed hydrogen strategies, with 20
more on the way, according to the IEA’s Global Hydrogen
Review 2021. Hydrogen currently is made nearly Renewables
exclusively from fossil fuels, but projects for carbon
capture and storage and electrolyzers (the equipment to -12 -9 -6 -3 0 3 6
make hydrogen from electricity) are experiencing fast Annual growth rate (%)
growth. The IEA has identified nearly 400 green hydrogen
projects in development. The recent U.S. infrastructure bill n Current policies n Pledges n Net zero 2050
devoted $8 billion to the U.S. Department of Energy for a
regional clean hydrogen hub. At the same time, Sources: BlackRock Investment Institute and IEA, Feb. 1, 2022. Notes: The chart shows
estimated growth changes in energy consumption by source under different scenarios
emissions-free hydrogen is currently expensive, and outlined in the IEA World Energy Outlook 2021. Current policies represent the changes
government policy and incentives for it are needed to resulting from stated policies. The pledges scenario shows changes if governments
implement pledged changes to consumption. The IEA’s net-zero scenario shows the
move beyond demonstration and reach scale, in our view. estimated change needed to achieve net-zero carbon emissions by 2050.
12 Net-zero transition
BIIH0222U/M-2018076-12/16FOR PUBLIC DISTRIBUTION IN THE U.S., CANADA, HONG KONG, SINGAPORE AND AUSTRALIA.
FOR INSTITUTIONAL, PROFESSIONAL, QUALIFIED INVESTORS AND QUALIFIED CLIENTS IN OTHER PERMITTED COUNTRIES.
Navigate
Shades of brown to go green
Navigating the energy sector is tough as even relatively Uncertainty is at play here. If governments enact policies
small changes can prove very disruptive. The powerful to meet their commitments, fossil fuel companies face the
economic restart from the Covid-19 shock in 2021 risk of stranded assets. If governments don’t deliver on
exposed mismatches in supply and demand, providing a those commitments, clean energy firms and companies
glimpse of what a disorderly transition could look like. The seeking to transform their business face the risk of seeing
fragility in power markets was exposed by a mix of their investments go to waste.
geopolitical factors and weather-related supply
The result of this uncertainty? Underinvestment across
disruptions of renewables and coal just as European
the board. This means energy markets are sensitive to
inventories were low. The result: surging energy prices.
shocks. And governments for now may find themselves –
This has driven sharp gains in shares of traditional energy for political reasons – supporting fossil fuel use in tight
companies over the past year, whereas clean power stocks energy markets to mitigate the hit to consumer budgets.
lagged. This doesn’t say anything about the speed of the
The uncertainty about policy and other transition drivers
transition or the future shape of the economy, in our view.
need not be paralyzing. Sitting out the sector altogether
It’s only natural that energy stocks would rally at a time
risks missing out on an investment opportunity, in our
the economy restarted from its pandemic-induced
view. Companies and asset owners can navigate the
slumber. It’s impossible today to kickstart activity without
sector’s transition by following three trends we see as
fossil fuels, we believe, as the economy has not been
robust against policy uncertainty:
rewired yet. The rewiring will take time, and there will be
periods when the traditional energy sector can benefit • Exponential growth in renewables: The outlook for
from mismatches in supply and demand. These periods renewables is bright even under currently enacted
should not be seen as being counter to the transition, in policies. Renewables supply will likely jump under all
our view, but part of it. feasible transition speeds, in our view. We see the
sector’s cost of capital further decreasing due to
Transition risk is about mismatches in resources. Indeed,
changing investor preferences, regardless of policy
the energy market’s underlying issue is a mismatch in
support.
investments. Capex in fossil fuels has slowed to levels
consistent with a net-zero future, but investment in • Continued oil and gas capex: Investment in fossil fuel
renewables has lagged. See the chart below. and energy-intensive sectors will be needed to enable
the transition, in our view, even in ambitious scenarios
to reach net zero by 2050. Case in point: The IEA’s net-
Energy investment needed
zero 2050 scenario envisions $360 billion per year of
Annual energy capex needs, actual vs. estimates
ongoing capex in oil and gas fields this decade to meet
4 demand in the transition. These fuels are needed to
reduce (dirtier) coal usage and require capex during
the transition’s early stages after years of under-
investment. We see potential opportunities in oil and
Investment (trillion USD)
3 gas companies with solid transition plans.
2016-2021 average
Stated policies • A place for gas: We believe natural gas will play an
Net zero 2050 important role in the transition given its lower carbon
2
intensity compared with other fossil fuels. Gas remains
controversial because it contributes to global methane
emissions. Its longer-term role is unclear as
1 renewables and battery storage costs keep dropping.
We see potential opportunities to invest in low-cost
assets with relatively low-greenhouse gas emissions
0 that could be retrofitted to new fuels like hydrogen.
Oil & gas Clean energy Our bottom line: A smooth transition to a net-zero world
requires the world to go from shades of brown to shades
Forward looking estimates may not come to pass. Sources: BlackRock Investment
Institute, with data from IEA, Feb. 1, 2022. Notes: The chart shows historical and of green. Making no investment choice at all risks missing
50%
estimated capex needs by energy sector under different policy paths. See the IEA World out on a core part of the transition.
Energy Outlook 2021 report for details.
13 Net-zero transition
BIIH0222U/M-2018076-13/16FOR PUBLIC DISTRIBUTION IN THE U.S., CANADA, HONG KONG, SINGAPORE AND AUSTRALIA.
FOR INSTITUTIONAL, PROFESSIONAL, QUALIFIED INVESTORS AND QUALIFIED CLIENTS IN OTHER PERMITTED COUNTRIES.
Drive Invent
Driving and inventing net zero Mismatched resources
Distribution of global resources, pollution and assets
Some companies and investors want to go beyond
Emerging markets (excluding China)
navigating the transition to drive it forward or even help
China
invent it. They help shape the transition by accelerating its High-income economies
advance or by enabling future progress. The latter is
critical because many sectors do not yet have viable, cost-
Market cap
competitive technology to get to net zero. Some of these
technologies are only at the prototype phase; others have
CO2 emissions
yet to be invented. We see this chance to invent the net-
zero world as an extraordinary investment opportunity.
GDP
For companies, to drive the transition means proactively
revamping business models and to invent it can take the Population
form of funneling R&D toward new technologies. A utility
might phase out a coal-fired power plant and invest in 0% 20% 40% 60% 80% 100%
grid-scale battery technology. A steel producer might Share
replace traditional blast furnaces with electric arc
Sources: BlackRock Investment Institute, IMF, World Bank, MSCI, using data from Haver
furnaces. An automaker might commit to an all-electric
Analytics and Refinitiv DataStream, February 2022. Note: The chart shows the shares in
vehicle platform and devote R&D toward that goal. different concepts of EMs (excluding China), China and high-income economies (i.e. rest of
the world). EMs are those classified as low and middle-income countries by the World Bank.
For investors, to drive means mean identifying For market cap, this is the share of each group/country in total world stock market
opportunities in companies making these changes. capitalization measured by the MSCI world stock market capitalization, as of 4 October
Investing in early-stage technologies is about helping 2021. For CO2 emissions, this is the share of each group in total world CO2 emissions in
invent the net zero economy. Dialogue between 2018 (latest data point). For GDP this is the share of each group in world GDP measured
using purchasing power parity exchange rates, as of 2019 (before the Covid shock). For
companies and investors on transition plans and capital population, it is the share of each group in world population in 2020.
needs is crucial to delivering the capital to the right
places at the right time, in our view. This goes beyond A quarter of this capex, or USD $32 trillion, is needed by
channeling capital to companies with green business 2030. See the chart below left. We see a large investment
models, we believe, and includes funding carbon- opportunity here – if governments do their part. Public
intensive companies leading decarbonization within their investment will be needed to de-risk private capital,
industries. Withholding capital or divesting from these especially in emerging markets (EMs). Climate change is
firms is counterproductive to the transition, in our view. a global problem. Without a successful transition to net
All these changes require massive amounts of capital zero everywhere, climate risk is unmanageable anywhere.
from investors and the public sector. Reaching net zero by The problem: EMs have too little capital to address
2050 would require USD $125 trillion flowing into low- growing populations and CO2 emissions, as the chart
carbon energy supply (primarily electric power) and above shows. We estimate EMs will need at least USD $1
demand (transport, buildings and industrial equipment), trillion per year to achieve net-zero emissions by 2050 –
according to the Glasgow Financial Alliance for Net Zero. more than six times current investment. See Financing
the EM transition from October 2021.
Our bottom line: The transition is happening, and we
Wanted: Net-zero investment
believe companies and investors need to have view on
Breakdown of capex needs by 2030 by region and sector
Agriculture, 5% how it’s evolving. A gradual and orderly transition will help
Other 17% Low emission fuels, 5% mitigate pressure points that could disrupt economic
Industry, 7% activity and drive up inflation. This will allow time to make
North America 19% 16% Buildings the necessary investments, phase out carbon-intensive
$32 17% Transport activities, redeploy workers, and develop new technologies
Europe 21% trillion to power the net-zero economy. Such a transition is the
Other Asia best macroeconomic outcome, we believe, one that we see
Pacific, 9%
translating into a manageable rise in inflation and a net
Corporations
India, 8% 50% Electricity gain for the global economy. All companies and investors
China 26% must navigate the way economies are being re-wired by
taking a view on how the transition will shape their
Sources: BlackRock Investment Institute and the Glasgow Financial Alliance for Net Zero, operations or investments. Some may choose to drive the
Feb. 1, 2022. Note: The charts show the estimated capex needed across regions and transition via thematic or impact investments or invent
economic sectors by 2030 to be on track for achieving net-zero emissions by 2050,
according to Glasgow Financial Alliance for Net Zero. the net-zero world by funding new technologies.
14 Net-zero transition
BIIH0222U/M-2018076-14/16BlackRock Investment Institute
The BlackRock Investment Institute (BII) leverages the firm’s expertise and generates proprietary research to provide
insights on the global economy, markets, geopolitics and long-term asset allocation – all to help our clients and
portfolio managers navigate financial markets. BII offers strategic and tactical market views, publications and digital
tools that are underpinned by proprietary research.
General disclosure: This material is intended for information purposes only, and does not constitute investment advice, a recommendation or an offer or solicitation to purchase or
sell any securities to any person in any jurisdiction in which an offer, solicitation, purchase or sale would be unlawful under the securities laws of such jurisdiction. The opinions
expressed are as of February 2022 and are subject to change without notice. Reliance upon information in this material is at the sole discretion of the reader. Investing involves risks.
In the U.S. and Canada, this material is intended for public distribution. In EMEA, until 31 December 2020, issued by BlackRock Investment Management (UK) Limited, authorised
and regulated by the Financial Conduct Authority. Registered office: 12 Throgmorton Avenue, London, EC2N 2DL. Tel: + 44 (0)20 7743 3000. Registered in England and Wales No.
2020394, has issued this document for access by Professional Clients only and no other person should rely upon the information contained within it. For your protection telephone
calls are usually recorded. Please refer to the Financial Conduct Authority website for a list of authorised activities conducted by BlackRock. From 1 January 2021, in the event the
United Kingdom and the European Union do not enter into an arrangement which permits United Kingdom firms to offer and provide financial services into the European Union, the
issuer of this material is: (i) BlackRock Investment Management (UK) Limited for all outside of the European Union; and(ii) BlackRock (Netherlands) B.V. for in the European Union,
BlackRock (Netherlands) B.V. is authorised and regulated by the Netherlands Authority for the Financial Markets. Registered office Amstelplein 1, 1096 HA, Amsterdam, Tel: 020 –
549 5200, Tel: 31-20-549-5200. Trade Register No. 17068311 For your protection telephone calls are usually recorded. In Switzerland, for qualified investors in Switzerland: This
document is marketing material. Until 31 December 2021, this document shall be exclusively made available to, and directed at, qualified investors as defined in the Swiss Collective
Investment Schemes Act of 23 June 2006 (“CISA”), as amended. From 1 January 2022, this document shall be exclusively made available to, and directed at, qualified investors as
defined in Article 10 (3) of the CISA of 23 June 2006, as amended, at the exclusion of qualified investors with an opting-out pursuant to Art. 5 (1) of the Swiss Federal Act on
Financial Services ("FinSA"). For information on art. 8 / 9 Financial Services Act (FinSA) and on your client segmentation under art. 4 FinSA, please see the following website:
www.blackrock.com/finsa. For investors in Israel: BlackRock Investment Management (UK) Limited is not licensed under Israel’s Regulation of Investment Advice, Investment
Marketing and Portfolio Management Law, 5755-1995 (the “Advice Law”), nor does it carry insurance thereunder. In South Africa, please be advised that BlackRock Investment
Management (UK) Limited is an authorized financial services provider with the South African Financial Services Board, FSP No. 43288. In the DIFC this material can be distributed in
and from the Dubai International Financial Centre (DIFC) by BlackRock Advisors (UK) Limited — Dubai Branch which is regulated by the Dubai Financial Services Authority (DFSA).
This material is only directed at 'Professional Clients’ and no other person should rely upon the information contained within it. Blackrock Advisors (UK) Limited - Dubai Branch is a
DIFC Foreign Recognised Company registered with the DIFC Registrar of Companies (DIFC Registered Number 546), with its office at Unit L15 - 01A, ICD Brookfield Place, Dubai
International Financial Centre, PO Box 506661, Dubai, UAE, and is regulated by the DFSA to engage in the regulated activities of ‘Advising on Financial Products’ and ‘Arranging
Deals in Investments’ in or from the DIFC, both of which are limited to units in a collective investment fund (DFSA Reference Number F000738). In the Kingdom of Saudi Arabia,
issued in the Kingdom of Saudi Arabia (KSA) by BlackRock Saudi Arabia (BSA), authorised and regulated by the Capital Market Authority (CMA), License No. 18-192-30. Registered
under the laws of KSA. Registered office: 29th floor, Olaya Towers – Tower B, 3074 Prince Mohammed bin Abdulaziz St., Olaya District, Riyadh 12213 – 8022, KSA, Tel: +966 11
838 3600. The information contained within is intended strictly for Sophisticated Investors as defined in the CMA Implementing Regulations. Neither the CMA or any other authority
or regulator located in KSA has approved this information. The information contained within, does not constitute and should not be construed as an offer of, invitation or proposal to
make an offer for, recommendation to apply for or an opinion or guidance on a financial product, service and/or strategy. Any distribution, by whatever means, of the information
within and related material to persons other than those referred to above is strictly prohibited. In the United Arab Emirates this material is only intended for non-natural Qualified
Investor as defined by the Securities and Commodities Authority (SCA) Chairman Decision No. 3/R.M. of 2017 concerning Promoting and Introducing Regulations. Neither the DFSA
or any other authority or regulator located in the GCC or MENA region has approved this information. In the State of Kuwait, those who meet the description of a Professional Client as
defined under the Kuwait Capital Markets Law and its Executive Bylaws. In the Sultanate of Oman, to sophisticated institutions who have experience in investing in local and
international securities, are financially solvent and have knowledge of the risks associated with investing in securities. In Qatar, for distribution with pre-selected institutional
investors or high net worth investors. In the Kingdom of Bahrain, to Central Bank of Bahrain (CBB) Category 1 or Category 2 licensed investment firms, CBB licensed banks or those
who would meet the description of an Expert Investor or Accredited Investors as defined in the CBB Rulebook. The information contained in this document, does not constitute and
should not be construed as an offer of, invitation, inducement or proposal to make an offer for, recommendation to apply for or an opinion or guidance on a financial product, service
and/or strategy. In Singapore, this is issued by BlackRock (Singapore) Limited (Co. registration no. 200010143N). This advertisement or publication has not been reviewed by the
Monetary Authority of Singapore. In Hong Kong, this material is issued by BlackRock Asset Management North Asia Limited and has not been reviewed by the Securities and Futures
Commission of Hong Kong. In South Korea, this material is for distribution to the Qualified Professional Investors (as defined in the Financial Investment Services and Capital Market
Act and its sub-regulations). In Taiwan, independently operated by BlackRock Investment Management (Taiwan) Limited. Address: 28F., No. 100, Songren Rd., Xinyi Dist., Taipei City
110, Taiwan. Tel: (02)23261600. In Japan, this is issued by BlackRock Japan. Co., Ltd. (Financial Instruments Business Operator: The Kanto Regional Financial Bureau. License
No375, Association Memberships: Japan Investment Advisers Association, the Investment Trusts Association, Japan, Japan Securities Dealers Association, Type II Financial
Instruments Firms Association.) For Professional Investors only (Professional Investor is defined in Financial Instruments and Exchange Act). In Australia, issued by BlackRock
Investment Management (Australia) Limited ABN 13 006 165 975 AFSL 230 523 (BIMAL). The material provides general information only and does not take into account your
individual objectives, financial situation, needs or circumstances. In China, this material may not be distributed to individuals resident in the People’s Republic of China (“PRC”, for
such purposes, excluding Hong Kong, Macau and Taiwan) or entities registered in the PRC unless such parties have received all the required PRC government approvals to participate
in any investment or receive any investment advisory or investment management services. For Other APAC Countries, this material is issued for Institutional Investors only (or
professional/sophisticated /qualified investors, as such term may apply in local jurisdictions). In Latin America, for institutional investors and financial intermediaries only (not for
public distribution). No securities regulator within Latin America has confirmed the accuracy of any information contained herein. The provision of investment management and
investment advisory services is a regulated activity in Mexico thus is subject to strict rules. For more information on the Investment Advisory Services offered by BlackRock Mexico
please refer to the Investment Services Guide available at www.blackrock.com/mx
©2022 BlackRock, Inc. All Rights Reserved. BLACKROCK is a trademark of BlackRock, Inc., or its subsidiaries in the United States and elsewhere. All other trademarks are those of
their respective owners.
BIIH0222U/M-2018076-15/16You can also read