Rubicon Technologies, LLC
←
→
Page content transcription
If your browser does not render page correctly, please read the page content below
Rubicon
                INVESTOR PRESENTATION
                JULY 2022

Technologies,
LLC
Disclaimer
Disclaimer
This confidential presentation (the “presentation”) is being delivered to you by Rubicon Technologies, LLC (“Rubicon”) and Founder SPAC (“SPAC”) in connection with the potential business combination of Rubicon and SPAC (the “Transaction”). This presentation is for information purposes only. Any reproduction
or distribution of this presentation, in whole or in part, or the disclosure of its contents, without the prior consent of Rubicon is prohibited.

This presentation and any oral statements made in connection with this presentation shall neither constitute an offer to sell nor the solicitation of an offer to buy any securities, or the solicitation of any proxy, vote, consent or approval in any jurisdiction in connection with the proposed business combination. This
communication is restricted by law; it is not intended for distribution to, or use by any person in, any jurisdiction where such distribution or use would be contrary to local law or regulation.

No Representations and Warranties
This presentation is for informational purposes only and does not purport to contain all of the information with respect to Rubicon or the post-business combination company (the “Combined Co”). The recipient agrees and acknowledges that this presentation is not intended to form the basis of any investment
decision by the recipient and does not constitute financial investment, tax or legal advice. No representation or warranty, express or implied, is or will be given by Rubicon, SPAC or any of their respective affiliates, directors, officers, employees or advisers or any other person as to the accuracy or completeness of
the information (including as to the accuracy, completeness or reasonableness of statements, estimates, targets, projections, assumptions or judgments) in this presentation or in any other written, oral or other communications transmitted or otherwise made available to any party and no responsibility or liability
whatsoever is accepted for the accuracy or sufficiency thereof or for any errors, omissions or misstatements, negligent or otherwise, relating thereto. The recipient also acknowledges and agrees that the information contained in this presentation is preliminary in nature and is subject to change, and any such
changes may be material. Rubicon and SPAC disclaim any duty to update the information contained in this presentation.

Forward-Looking Statements
This presentation includes forward-looking statements. Rubicon’s and Combined Co’s actual results may differ from their expectations, estimates and projections and consequently, you should not rely on these forward-looking statements as predictions of future events. Words such as “expect,” “estimate,” “project,”
“budget,” “forecast,” “anticipate,” “intend,” “plan,” “may,” “will,” “could,” “should,” “believes,” “predicts,” “potential,” “continue,” and similar expressions are intended to identify such forward-looking statements. These forward-looking statements include, without limitation, Rubicon’s and SPAC’s expectations with
respect to future performance. These forward-looking statements also involve significant risks and uncertainties that could cause the actual results to differ materially from the expected results. Factors that may cause such differences include, but are not limited to: (1) the outcome of any legal proceedings that may
be instituted in connection with any proposed business combination; (2) the inability to complete any proposed business combination; (3) delays in obtaining, adverse conditions contained in, or the inability to obtain necessary regulatory approvals or complete regulatory reviews required to complete any business
combination; (4) the risk that any proposed business combination disrupts current plans and operations; (5) the inability to recognize the anticipated benefits of any proposed business combination, which may be affected by, among other things, competition, the ability of the combined company to grow and manage
growth profitably, maintain relationships with customers and suppliers and retain key employees; (6) costs related to the any proposed business combination; (7) changes in the applicable laws or regulations; (8) the possibility that Rubicon or Combined Co may be adversely affected by other economic, business,
and/or competitive factors; (9) the impact of the global COVID-19 pandemic; and (10) other risks and uncertainties separately provided to you and indicated from time to time in filings and potential filings by Rubicon, SPAC and Combined Co with the U.S. Securities and Exchange Commission (the “SEC”). Rubicon
and SPAC caution that the foregoing list of factors is not exclusive and not to place undue reliance upon any forward-looking statements, including projections, which speak only as of the date made. Rubicon and SPAC undertake no obligation to and accept no obligation to release publicly any updates or revisions
to any forward-looking statements to reflect any change in their expectations or any change in events, conditions or circumstances on which any such statement is based.

Industry, Market Data and Partnerships
In this presentation, Rubicon and SPAC rely on and refer to certain information and statistics regarding the markets and industries in which Rubicon competes. Such information and statistics are based on management’s estimates and/or obtained from third-party sources, including reports by market research firms
and company filings. While Rubicon and SPAC believe such third-party information is reliable, there can be no assurance as to the accuracy or completeness of the indicated information. Rubicon and SPAC have not independently verified the accuracy or completeness of the information provided by the third-party
sources.

This Presentation contains descriptions of certain key business partnerships with Rubicon. These descriptions are based on the Rubicon management team’s discussion with such counterparties, certain non-binding written agreements and the latest available information and estimates as of the date of this
Presentation. These descriptions are subject to negotiation and execution of definitive agreements with certain of such counterparties which have not been completed as of the date of this Presentation.

                                                                                                                                                                                                                                                                                                                               1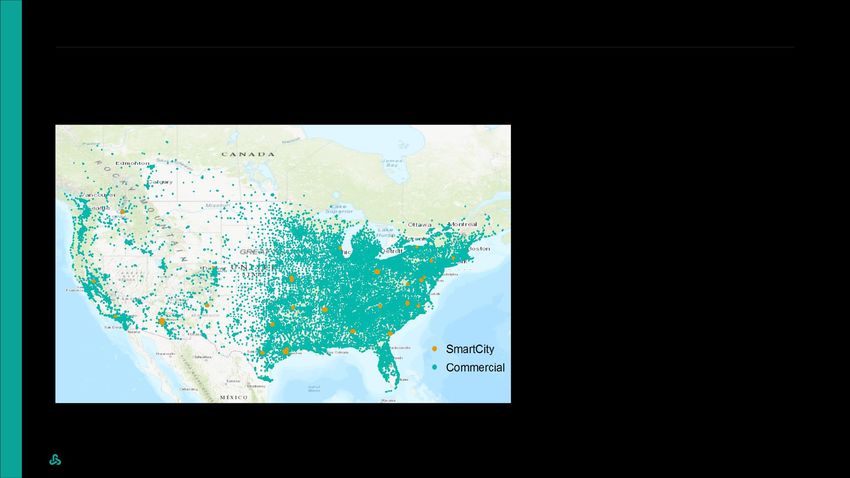
Disclaimer (Continued)
Use of Projections
This Presentation contains projected financial information with respect to Rubicon. Such projected financial information constitutes forward-looking information, and is for illustrative purposes only and should not be relied upon as necessarily being indicative of future results. Further, illustrative presentations are not
necessarily based on management’s projections, estimates, expectations, or targets but are presented for illustrative purposes only. Rubicon’s independent auditors have not audited, reviewed, compiled or performed any procedures with respect to the projections for the purpose of their inclusion in this
Presentation, and accordingly, they did not express an opinion or provide any other form of assurance with respect thereto for the purpose of this Presentation. The assumptions and estimates underlying such financial forecast information are inherently uncertain and are subject to a wide variety of significant
business, economic, competitive and other risks and uncertainties. See “Forward-Looking Statements” above. Actual results may differ materially from the results contemplated by the financial forecast information contained in this Presentation, and the inclusion of such information in this Presentation is not
intended, and should not be regarded, as a representation by any person that the results reflected in such forecasts will be achieved. Further, the metrics referenced in this Presentation regarding select aspects of Rubicon’s operations were selected by SPAC and Rubicon on a subjective basis. Such metrics are
provided solely for illustrative purposes to demonstrate elements of Rubicon’s business, are incomplete, and are not necessarily indicative of Rubicon’s performance or future performance or overall operations. There can be no assurance that historical trends will continue.

Non-GAAP Financial Measures
This Presentation includes certain financial measures not presented in accordance with generally accepted accounting principles (“GAAP”) including, but not limited to earnings before interest, taxes, depreciation, and amortization (“EBITDA”), EBITDA adjusted for various non-recurring items (“Adjusted EBITDA”),
adjusted gross profit and certain ratios and other metrics derived therefrom. Note that other companies may calculate these non-GAAP financial measures differently, and therefore such financial measures may not be directly comparable to similarly titled measures of other companies. Further, these non-GAAP
financial measures are not measures of financial performance in accordance with GAAP and may exclude items that may occur in the future and are significant in understanding and assessing Rubicon’s financial results. Therefore, these measures should not be considered in isolation or as an alternative to net
income or other measures of profitability under GAAP. You should be aware that Rubicon’s presentation of these measures may not be comparable to similarly-titled measures used by other companies. Rubicon believes these non-GAAP measures of financial results provide useful information to management and
investors regarding certain financial and business trends relating to Rubicon’s financial condition and results of operations. Rubicon believes that the use of these non-GAAP financial measures provides an additional tool for investors to use in evaluating ongoing operating results and trends in Rubicon, and in
comparing Rubicon’s financial measures with those of other similar companies, many of which present similar non-GAAP financial measures to investors. These non-GAAP financial measures are subject to inherent limitations as they reflect the exercise of judgments by management about which items of expense
and income are excluded or included in determining these non-GAAP financial measures. Please refer to footnotes where presented on each page of this Presentation or to the tables therein for a reconciliation of these measures to what Rubicon believes are the most directly comparable measure evaluated in
accordance with GAAP. This Presentation also includes certain projections of non-GAAP financial measures. Rubicon does not provide reconciliations of Adjusted Gross Profit or Adjusted Gross Profit Margin (the result obtained from dividing Adjusted Gross Profit by revenue) to gross profit or gross profit margin or
EBITDA, Adjusted EBITDA, or Adjusted EBITDA margin (the result obtained from dividing Adjusted EBITDA by revenue) to net income on a forward-looking basis because Rubicon is unable to reliably forecast the amount or significance of certain items required to develop meaningful projections of the comparable
GAAP financial measures without unreasonable efforts. These items include gains or losses on sale or consolidation transactions, accelerated depreciation or amortization, impairment charges, gains or losses on retirement of debt, variations in effective tax rate, and fluctuations in net working capital, which are
difficult to predict and estimate and are primarily dependent on future events, but which are excluded from Rubicon’s calculations of these non-GAAP measures. We expect the variability of these items could have a significant impact on our reported GAAP financial results.

Trademarks
This Presentation contains trademarks, service marks, trade names and copyrights of Rubicon and other companies, which are the property of their respective owners. Solely for convenience, some of the trademarks, service marks, trade names and copyrights referred to in this Presentation may be listed without
the TM, SM © or ® symbols, but Rubicon and SPAC will assert, to the fullest extent under applicable law, the rights of the applicable owners, if any, to these trademarks, service marks, trade names and copyrights. Further, third-party logos included in this Presentation may represent past or present vendors or
suppliers of materials and/ or products to Rubicon for use in in connection with its business and/or installation and sale of solar systems or may be provided simply for illustrative purposes only. Inclusion of such logos does not necessarily imply affiliation with or endorsement by such firms or businesses. There is no
guarantee that either SPAC or Rubicon will work, or continue to work, with any of the firms or businesses whose logos are included herein in the future.

Important Information About the Business Combination and Where to Find It
SPAC’s shareholders and other interested persons are advised to read, carefully and in their entirety, the definitive proxy statement/consent solicitation statement/prospectus, as well as other documents filed with the SEC, as these materials will contain important information about SPAC, Rubicon and the other
parties to the Merger Agreement (as defined in the Registration Statement), and the Business Combination (as defined in the Registration Statement). The definitive proxy statement/consent solicitation statement/prospectus will be mailed to shareholders of SPAC as of a record date to be established for voting on
the Business Combination and other matters described in the Registration Statement. SPAC shareholders will also be able to obtain copies of the proxy statement/consent solicitation statement/prospectus and other documents filed with the SEC that will be incorporated by reference in the proxy statement/consent
solicitation statement/prospectus, without charge, once available, at the SEC’s web site at sec.gov, or by directing a request to: SPAC at WINSTON & STRAWN LLP, 800 CAPITOL STREET, SUITE 2400, HOUSTON, TX, 77002.

Participants in the Solicitation for the Proposed Business Combination
SPAC and its directors and executive officers may be deemed participants in the solicitation of proxies from SPAC’s shareholders with respect to the proposed business combination. A list of the names of those directors and executive officers and a description of their interests in SPAC is contained in the
Registration Statement which was filed with the SEC and is available free of charge at the SEC’s web site at www.sec.gov, or by directing a written request to SPAC at WINSTON & STRAWN LLP, 800 CAPITOL STREET, SUITE 2400, HOUSTON, TX, 77002. Rubicon and its members and executive officers may
also be deemed to be participants in the solicitation of proxies from the shareholders of SPAC in connection with the proposed business combination. A list of the names of such members and executive officers and information regarding their interests in the proposed business combination is included in the
Registration Statement filed with the SEC.

                                                                                                                                                                                                                                                                                                                              2
Agenda
         1. Founder SPAC Overview                                      5

         2. Executive Summary                                          8

         3. Reimagining The Product Experience for Waste & Recycling   20

         4. Financial Overview & Projections                           30

         5. Transaction Overview                                       39

         Appendix                                                      42
4

Today’s Presenters

Nate Morris               Phil Rodoni                Michael Allegretti       Jevan Anderson            Chris Spooner   Osman Ahmed
Chief Executive Officer   Chief Technology Officer   Chief Strategy Officer   Chief Financial Officer   SVP, Finance    Chief Executive Officer
5

Founder SPAC
Overview
6

Founder SPAC Overview & Investment Thesis

                                                                 Investment
                                                                 Thesis
Focused on investing in companies enabling or benefiting from    High growth, digital marketplace focused on disrupting a mature
digital transformation – the movement of processes online        industry

Founder’s team has multiple decades of success in the Digital    Pioneer in the waste and recycling digital marketplace with
Transformation sector as operators, board members and            proprietary technology and data stack, plus an early-mover
investors, collectively having taken multiple companies public   advantage with creating a digital ecosystem for all constituents
                                                                 in waste and recycling
Prior success executing SPAC transactions across multiple
industries                                                       Revenue today and a proven playbook to fuel future growth

                                                                 Founder SPAC merger expected to fully fund Rubicon and will
                                                                 provide growth capital to accelerate M&A and execute on
                                                                 management’s strategic growth initiatives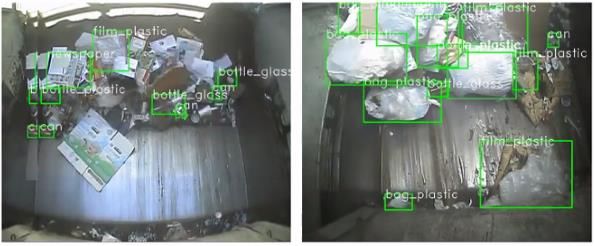
7

Transaction Summary

                                                                               $1.7B                                                                                                                     $432M
TRANSACTION STRUCTURE                                                          VALUATION                                                                                                                 CAPITAL STRUCTURE

Rubicon and Founder SPAC (Nasdaq:FOUN) have                                                                                                                                                              Proceeds from the transaction will be comprised of
                                                                               The business combination reflects an implied pro forma
entered in a definitive agreement to consummate a                                                                                                                                                        Founder SPAC cash in trust and proceeds from a
                                                                               valuation of ~$1.7B
business combination                                                                                                                                                                                     concurrent PIPE

                                                                                                                                                                                                         Transaction is expected to result in up to
The transaction is anticipated to                                              Valuation implies 9.4x 2023E Adjusted Gross Profit                                                                        $432M total cash proceeds which will be used to fund
close in Q3 2022                                                               multiple(1)                                                                                                               organic and inorganic growth; proceeds
                                                                                                                                                                                                         are comprised of $321M cash in trust and the $111M PIPE

Following the close of the transaction, Rubicon to list                        Rubicon shareholders will rollover 100% of outstanding                                                                    Post-transaction capital structure assumes zero
on the NYSE with the ticker symbol “RBT”                                       equity and own 75% of the pro forma entity                                                                                redemptions and a fully-subscribed $111M PIPE

                                             1.   Adjusted Gross Profit (AGP) is a non-GAAP measure and represents revenue less payments to third party suppliers for waste services and waste generators for the
                                                  value of commodity streams. See the introduction to this presentation for a discussion of non-GAAP measures and the appendix for a reconciliation of historical
                                                  amounts to gross profit, the most directly-comparable GAAP measure.
8

Executive
Summary
9

Investment Highlights
                                                            Massive addressable market in a                                                                                                 First-mover advantage in a self-created
                                  01.                       fragmented industry ripe for innovation                                                                                   06.   market, with deep, protected moats

                                                            Long-term topline visibility with multiple                                                                                      Digital infrastructure model with robust
                                  02.                       contractual, recurring revenue streams and
                                                            100%+ revenue net retention (1)
                                                                                                                                                                                      07.   technology product development pipeline

                                                            Capital-light and efficient operating model                                                                                     Environmental & sustainability proposition
                                  03.                       supports continued attractive growth                                                                                      08.
                                                            Scaled platform with 8,000+ customers,                                                                                          Path to profitability at scale
                                  04.                       > $500M revenue                                                                                                           09.
                                                            Proven customer acquisition and wallet                                                                                          Robust M&A pipeline with proven synergy
                                  05.                       share expansion strategies, with robust
                                                            client base of marquee companies and
                                                                                                                                                                                      10.   extraction playbook

                                                            municipalities

               1. Revenue net retention is calculated on an annualized basis as the percentage of prior period revenue retained from existing customers within the period, inclusive of
                  customer churn, as well as revenue expansion or contraction within an existing customer account..
10
Who is Rubicon?
Rubicon is a software platform that arranges and fulfills waste and
Rubicon is the Digital recycling services for businesses and governments
Challenger to the We provide cost containment, tax-payer savings, and sustainable
outcomes through long-term contracts
Status Quo in Waste The data we aggregate on our platform offers a single source of
truth to drive the circular economy
& Recycling
Digital
Cloud-Based
No Trucks
No Landfills11
Waste & Recycling is a Massive Market
MASSIVE AND GLOBAL COMPLETELY NONCYCLICAL HIGHLY FRAGMENTED
$2.1T ~5.3%
Global Waste Blended “Big 3”
and Recycling EBITDA CAGR
Industry(1) 2001-2021A(3)
5.3% 4.9% 85%
CAGR 2020-2027E(1) Blended “Big 3” Revenue CAGR Of Market Comprised of
2001-2021A(3) non-Big 3 Haulers(2)(3)
$208B $156B $177B
North American Waste “Big 3” Aggregate Annual Revenue to Non-Big-3
Management Market(2) Revenues 2017- Haulers in North America(2)(3)
2021A(3)
1. Statista ‘Waste Management Market Worldwide (2019-2027), January 2021; Technavio
‘Global Smart City Market’ report; World Bank Group ‘What a Waste 2.0’
2. Allied Market Research
3. FactSet as of 7/19/202212
Old World Approach Rubicon’s Approach
to Waste Management to Waste Management
Little has changed since the late 18th Rubicon’s Integrated waste management
century; the industry is ripe for disruption platform changes how we think about waste
Asset heavy, landfill-based model makes ~50% of EBITDA on Data-centric approach to waste management is powering sustainability
frequency and tonnage disposed in the landfill for businesses and cities
Landfill incentives outweigh recycling incentives Digital, cloud-based model’s utilization of lower-cost resources results in
Example: Waste Management’s recycling rate of 13% is more efficient use of growth capital
approximately half the industry average
Rubicon monetizes commodities diverted from landfills,
Disjointed, antiquated technology with no visibility into waste data incentivizing recycling efforts and reducing total customer waste spend
Lack of competition results in inflated pricing for all Holistic audit of customer waste streams results in increased
transparency and reduced costs
Source: Annual Reports; Earnings Calls; Waste Business Journal13
Rubicon’s First Mover Advantage = Significant Scale & Capabilities
Rubicon unique service locations (North America)
8,000+
Size of hauler network
8,000+
Customers across a variety of industries
8M+
Number of unique service locations
20+
Number of countries Rubicon currently
operates in
50+
Patents awarded
All managed without owning trucks, landfills, recycling operations or containers
Note: Unique Service Location is a location where a waste or recycling service occurs and can include multiple services / containers14
Customer Base Anchored by Marquee Companies & Governments
SELECT CUSTOMERS
RUBICON
ConnectTM
RUBICON
SmartCityTM
Houston, TX Santa Fe, NM Washington DC Asheville, NC Memphis, TN Baltimore, MD Columbus, OH Kansas City, MO San Antonio, TX
&
RUBICON
PremierTM
Japan Montgomery, AL Spokane, WA Hartford, CT Scranton, PA Denton, TX Roseville, CA15
Rubicon’s Proposition Enables Meaningful Business &
Environmental Impact for its Clients
Rubicon was founded Rubicon has built a leading brand profile in a category that, until now, was viewed
as a utility-like experience. Our culture, our campaigns, and our communications
with a simple but all speak directly to the next generation of decision-makers.
powerful mission:
TO END
WASTE
Confidential – For Discussion & General Information Purposes Only16
Rubicon Has Built a Leading Digital Platform
for Waste & Recycling
Scalable digital marketplace connecting waste generators with
haulers for the $2.1T (1) waste and recycling industry
Software-centered product solutions transform the customer
experience
Authentic, free-market environmental proposition to reduce
emissions with end-to-end transparency. One of the first and now
one of the largest B Corps(2)
Diverse, blue-chip customer base in business and government, all
under long-term contracts
Experienced management team supported by seasoned investors
and advisors
1. Statista ‘Waste Management Market Worldwide (2019-2027)’, January 12, 2021, Technavio ‘Global Smart City Market’ Report, World Bank Group ‘What a Waste 2.0’
2. Certified as a B Corporation since April 201217
Waste is One of the Few Remaining Industries on the Disruption Curve
Traditional Model - Offline Reimagined Customer Experience
Acutely positioned for disruption and - Rubicon is a decade ahead of the sector
more importantly - customer and is actively disintermediating the
disintermediation incumbents to become the nexus between
customer and hauler
Model centered around real estate assets Built on a foundation of technology / online buying
Inability to adapt in digital world Optimized logistics
Poor customer experience, excessive and hidden fees Consumer-centric approach
Structured to ignore significant capacity from independents Business revolves around users
Vulnerable to growing awareness of, and opposition to, landfill Data-driven
Not structured to capture and monetize the wealth of data potentially Ability to expand into adjacent markets
at their disposal18
“… if the other guys
(Waste Management
and Republic) can get to
$50 billion, I don’t see
why Rubicon can’t...”
Marc Benioff
CEO, Salesforce
(Rubicon Investor)
Source: Forbes, January 201719
Recent Press & Announcements
• Rubicon Enters Strategic Partnership with Palantir Technologies (link)
• Rubicon Enters Into Three Year Smart City Partnership with the City of Houston (link)
• RUBICONSmartCity™ Featured in New Amazon Documentary Series (link)
• Rubicon and City of Harrisonburg, Virginia Win Prestigious Smart 50 Award (link)
• Rubicon Certified as a Great Place to Work® for Remarkable Fifth Consecutive Year (link)
• Rubicon Announces New Multi-Year Agreement with SRS Distribution (link)
• Rubicon Enters Nationwide Technology Agreement with Japanese Transportation Conglomerate,
Odakyu (link)
• Rubicon Acquires CIVIX, a Routing Software and Solutions Company (link)20 Reimagining the Product Experience for Waste & Recycling
21
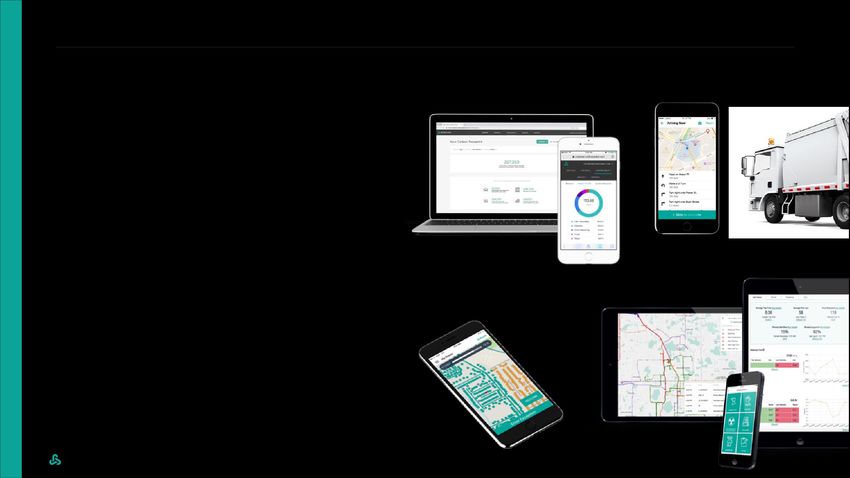
The Operating System for the Waste & Recycling Industry
Using technology to enable product solutions for business and government that
unlock economic value and reduce environmental liabilities
RUBICONConnectTM RUBICONSmartCityTM
Commercial Waste Generators Cities & Residential Waste
Solutions that unlock the economic and A data collection platform using the latest in
environmental value of their waste telematics and computer vision technology to
deliver better public services
RUBICONPremierTM RUBICONProTM
International Applications Haulers
A 3PL solution that integrates vehicle tracking and IoT solutions that provide haulers a wealth of
confirmations directly into back-office operations tools and capabilities to help them efficiently
manage their business
Combines proprietary technology expertise and
deep waste and recycling industry knowledge22
Rubicon Has Built a Highly Connected Digital Ecosystem for All Constituents in Waste and Recycling
COMMERCIAL WASTE GENERATORS HAULERS
Rubicon services waste generators’ needs through its network
of haulers, with vendor management, compliance, invoicing,
payments and receipts managed on the digital platform
Manufacturing Commercial Hospitality Restaurant
& Industrial Property A network of more than 8,000 hauling and
recycling partners, including national and local
Solutions address full waste operators
and recycling value chain Rubicon equips haulers with
technology to detect location, load
and capacity…hauler receives
Multi-Family Logistics Retail Grocery digitally dispatched order to be
configured into existing route
Rubicon technology helps implement advanced recycling programs,
coordinating multiple vendors, directing the waste feedstock to processing
facilities, and tracking end-destinations for traceability
SMART CITIES
INTEGRATED RECYCLING & SORTING
LANDFILL OPERATORS AI toolkit is applied to waste streams to
monetize customers’ overlooked assets
and reduce environmental liability
Municipal fleets are equipped with telematics, and AI
cameras to collect data for asset optimization…driving
tax payer savings…and creating a roaming data center Recycled waste re-enters the
that deliver critical infrastructure assessments, and fleet
and route optimization tools Rubicon enables data-driven waste management for all its supply chain and avoids landfill
partners and integrated landfill operators process volumes
contracted to Rubicon23
RUBICONConnect™ Disrupts Legacy Solutions by Offering a Digital Ecosystem with a Differentiated
1
Customer Experience for All Constituents in the Supply Chain
AGGREGATING DEMAND THROUGH A CURATED SUPPLIER NETWORK WITH BROAD
DIFFERENTIATED CUSTOMER EXPERIENCE CAPABILITIES
▪ Immediately available real-time quotes for 150+ ▪ 8,000+ approved vendors bid on jobs digitally to be selected
categories of waste and commodities by Rubicon – expanding customer base and revenues
▪ Global service capabilities ▪ Jobs are routed intelligently to maximize route density and
efficiency
▪ Supplier redundancy in almost every US market
▪ Modernizing a fragmented industry, streamlining prospecting
▪ Offers digital oversight and environmental
and back-office functions
performance transparency
▪ AI tech-enabled ecosystem facilitates greater program
▪ Modernizing procurement with integrated
compliance and improved customer satisfaction
3PL platform
DIGITAL ONE-STOP SHOP COST MINIMIZATION
VERIFIED ENVIRONMENTAL & BILL AUDITING & PAYMENTS
SUSTAINABILITY REPORTING
FMS / WMS INTEGRATIONS INCREASED DIVERSION24
Rubicon’s Value Proposition for Clients / Waste Generators
Rubicon’s platform addresses the most salient customer frustrations with traditional solutions
LEGACY SOLUTIONS PAIN POINTS RUBICON OFFERS…
1. Ongoing cost increases Fully Digital, Transparent Experience
2. Lack of transparency and data
3. Lack of customer focus
Improved Environmental Performance
4. Lack of support of sustainability goals through diversion
5. Reputational issues
6. Too many service providers to monitor Efficiencies Create Significant Economic Upside
BEFORE RUBICONConnect AFTER RUBICONConnect
▪ Continual price increases
▪ Competitive sourcing
▪ Bin over-servicing
$$$ ▪
▪
▪
High tipping fees for landfills
Hidden charges
Errors in billing
Cost Containment & SG&A
Expense Relief $ ▪
▪
▪
Service right sizing
Lower tipping fees for landfills
Invoice auditing
▪ New industry platform
▪ Lack of service confirmations Reliable, Easy-to-Work-With ▪ Easy to use interfaces
▪ Paper invoices and checks ▪ Service confirmations
Providers ▪ Automated, paperless billing and payments
▪ Holistic supply chain transparency
▪ Limited tracking of pricing data Transparency into Billing & ▪ Real-time metrics
▪ Limited transparency into billing and diversion
Diversion ▪ CSR reporting
▪ ~30% diversion rate
▪ ~10% of waste diverted by the Big-3 ▪ Diversion innovation
▪ Incumbents incentivized to send as much as possible to High Diversion Rates ▪ Waste stream audits
landfills ▪ Revenue from recyclables
▪ Dedicated solutions SMEs
Source: Annual Reports; Earnings Calls; Waste Business Journal25
Rubicon’s Value Proposition for Haulers & Recyclers
Rubicon’s platform streamlines operations for smaller independent waste vendors by offering:
TECHNOLOGY PLATFORM ACCESS TO CUSTOMERS AND VOLUME SMART ROUTING DISCOUNTS
All-in-one fleet management system Local access to national chains that Optimized routing Aggregates local hauler buying power
would have otherwise been unattainable to save on:
Service confirmations and Increased route density from AI powered
verifiable data trail Effective reseller channel for local infill job allocation, improving efficiency Fuel
opportunities Equipment
Back-office management Parts
Smartphones
Insurance26
Legacy Waste Broker Acquisitions Add Immediate Value to Our Digital Marketplace
How We Transform Acquired Books of Business Synergy Track Record
Order Flow & Back Office Digitization
SG&A
✓ Streamlined pricing, job bidding and routing REVENUE SYNERGIES
SYNERGIES
✓ Simplified 3PL solutions for customers
✓ Back-office automation
Revenue & SG&A Synergies Rubicon acquired WestRock’s solid waste +36% (59%)
✓ Easy to use platform drives cross-selling and management brokerage services business
increases wallet-share
✓ Streamlining of manual processes allows for
elimination of redundant personnel
AI & Machine Learning
Rubicon acquired Charter Waste Management +20% (32%)
✓ Legacy data on pricing, service detail, customers, that operates through its subsidiary RiverRoad
and market dynamics makes the platform more Waste Solutions
intelligent
✓ Intelligent pricing optimized for hauler’s fleet and
route
Note: All comparisons put on an “apples-to-apples” basis, principally excluding impact of accounts that filed for bankruptcy amidst COVID-19 pandemic and excluding impact of new
customer accounts that were closed and launched under the acquired legal entities post-acquisition.27
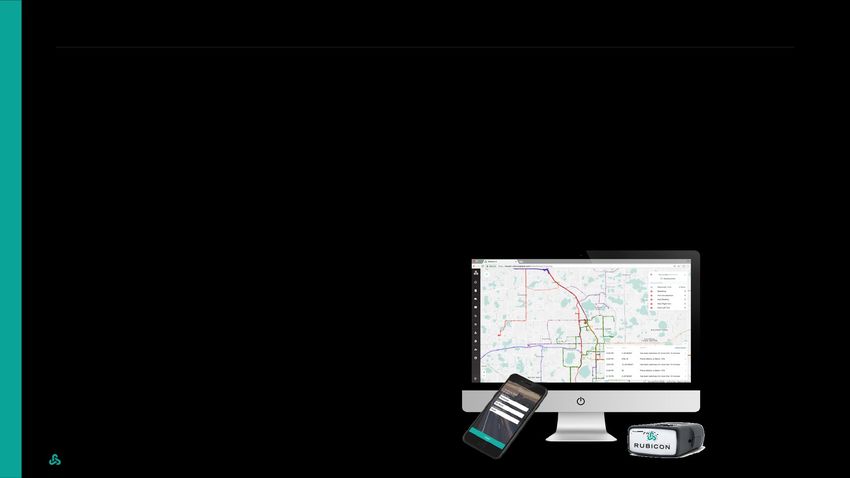
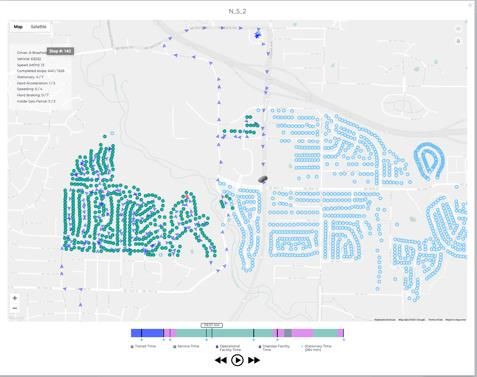
RUBICONSmartCityTM
Award-winning IoT solution helps city governments deliver more efficient, effective, and sustainable public services,
becoming the operating system for citywide infrastructure management
Data Generation
Digital platform gathering data on routes, infrastructure,
management of waste, and collection vehicles performance
Taxpayer Savings
Communication Platform
Drivers and supervisors can communicate back and forth
on issues in the field Deployed in more than
Real Time Analytics Recycling Improvements 70 cities to help achieve
Showcase to the city real time route updates, daily
reporting, operational insights, and service confirmation “Zero Waste” &
Image Recognition Models
Taxpayer Savings
Machine learning model that recognizes recyclable material Quality of Life Gains
and critical infrastructure issues28
Case Studies on RUBICONSmartCityTM
Kansas City, Missouri Montgomery, Alabama
In October 2019, Rubicon and the city of Kansas City, MO In March 2018, a 6-month pilot in the city of Montgomery, AL
signed a 3-year contract worth ~$1M converted to a 3-year paying contract worth ~$750k
▪ 80 vehicles (solid waste only) & 160,000 ▪ 80 sanitation vehicles servicing
unique service locations 67,500 residential and commercial
customers
▪ Drivers have registered more than 17,000
exceptions since installation ▪ During the pilot period drivers
documented over 57,000 issues
▪ ~$2 million dollars in documented taxpayer
along their routes
savings since installation
▪ Nearly 20% increase in customer satisfaction with ▪ This equipped city employees with the information they needed
solid waste services since installation when investigating citizen inquiries and complaints
▪ City expanded contract in October 2021 to include 300 snow ▪ ~$375k tax-payer savings per year post Rubicon route efficiency
removal vehicles, worth an additional ~$350k recommendation29
RUBICONPremierTM
Rubicon licenses the breadth of its customer-facing, back-office, and integrated fleet technology as an annual software
subscription to other environmental companies internationally
Single application with different views for
customers, service providers and back-office staff, Leading European Hauler
including:
▪ Customer management Leading developer of transport
infrastructure and urban services,
▪ Contract and price management with over 96,000 employees in
more than 25 countries
▪ Dispatch management
▪ Resource management
▪ Sub-contractor management
23%
Decrease in idle time
▪ Billing and invoice management
Integrates vehicle tracking and service confirmation 39%
directly into back-office Increase in productivity
through IoT fleet solutions
TAM = $6B(1)
1. World Bank Group ‘What a Waste 2.0’30 Financial Overview & Projections
31

Rubicon’s Revenue Model
▪ Volume-based services transacted over the platform,
   all under long-term contracts

▪ Commodities transacted over the platform, all under
   long-term contracts                                                           SUBSCRIPTION SOFTWARE
▪ Subscription software revenue for access to Rubicon’s
   platform

                                                          COMMODITIES EXCHANGE        RUBICONPremier

                            WASTE SERVICES                    RUBICONConnect         RUBICONSmartCity

                                   RUBICONConnect             RUBICONSmartCity        RUBICONConnect
32
Product & Operational Focus Has Set the
Stage for Profitable Growth Extend Deeper
into Supply Chain
Accelerate ~ 40% CAGR over
Investment in Growth Forecast Period
Digitize Acquisitions
+ Deploy Products ~ 5x Increase in
Customer Acquisition Spend
M&A Integration & ~ $1.6M Revenue / Non-Sales FTE
Synergy Capture 60th SmartCityTM Deployed
4th acquisition completed
Expand Core Business • ~ 27% Revenue Synergies
and into Adjacencies • ~ 50% SG&A Synergies
SmartCityTM Launched
PremierTM Launched
ConnectTM passes $500M
8K+ Haulers
150+ Waste Categories
2016A 2017A 2018A 2019A 2020A 2021A 2022E 2023E 2024E33
Our Financial Profile
REVENUE GROWTH EXPANDING MARGINS DRIVERS
Growth 42% 6% 8% 26% 57% 38% Growth 59% 21% 12% 64% 135% 70%
(1) (2)
Adjusted Gross Profit Adjusted Gross Profit Margin
19%
Revenue Growth:
($ in millions) $1,596 ($ in millions) 16% $308
▪ New customer acquisitions
▪ Expansion within existing
10% customers
▪ International growth
$1,152 8%
7%
7%
Gross Margin Expansion:
6%
$181
▪ Landfill diversion
$736 ▪ Procurement efficiencies
▪ Supplier density
$583 ▪ SaaS growth
$539
$509
$77
$359
$47
$42
$35
$22
2018A 2019A 2020A 2021A 2022E 2023E 2024E 2018A 2019A 2020A 2021A 2022E 2023E 2024E
1. Adjusted Gross Profit (AGP) is a non-GAAP measure. See the introduction to this presentation for a discussion of non-GAAP measures and the appendix for a reconciliation of historical amounts to gross profit, the most directly-comparable GAAP
measure.
2. Adjusted Gross Profit Margin is calculated as Adjusted Gross Profit divided by Revenue34
Bridge through 2023E Revenue
$1,152
($ Millions) Rubicon has significant
additional opportunities to
expand with existing
customers and estimates it
currently has 28% of its $222
customers’ wallet
$194
$105
Substantially all of 2022E
revenues are already
under contract
$89
$736
$124 $29
$48
$76
$583
FYE 2021A Reported Already Contracted Additional Growth 2022E Revenue (1) Organic Growth Contract Portfolio 2023E Revenue (1)
(Estimated) Acquisitions
Contracted in 2021 Expansion with Existing Customers
Contracted through Q2 2022 New Customers
1. Rubicon primarily recognizes revenue on a gross basis as the principal in its waste service and commodities sale transactions. Rubicon’s financial projections contemplate future
acquisitions and account for all acquired contract portfolios on a gross basis for consistency. Rubicon may effect future acquisitions for which individual contracts, or portfolios of
contracts, are deemed agents of the waste generator and accounted for on a net basis. The revenue accounting treatment for such acquisitions may differ from Rubicon’s financial
projections.(1) 35
Bridge through 2023E Adjusted Gross Profit
$181
($ Millions) Existing customer expansion
conservatively assumes ~
5% penetration on > $2B
pipeline opportunity $40
$65
Customer acquisition pipeline
supports > $400M adjusted
$40 gross profit opportunity across
> 100 identified targets
$6M annualized SaaS
$11
adjusted gross profit forecast
to convert from pilots within
$14
next 6 months $77
$19 $11
$7 Optimization assumes ~
180bp margin expansion
$47 $12 (consistent with historical
experience)
FYE 2021A Reported Already Contracted Additional Growth 2022E Adjusted Organic Growth Contract Portfolio 2023E Adjusted
(Estimated) Gross Profit Acquisitions Gross Profit
Contracted in 2021 Service Optimization & Landfill Diversion
Contracted through Q2 2022 Expansion with Existing Customers
New Customers
1. Adjusted Gross Profit is a non-GAAP measure. See the introduction to this presentation for a discussion of non-GAAP measures and the appendix for a reconciliation of historical amounts to gross profit, the most directly-comparable GAAP
measure.36
Strong Alignment of Financial Incentives Drives High Customer Retention
RUBICON DELIVERS CUSTOMER SAVINGS AND IMPROVES ENVIRONMENTAL IMPACT
Rubicon Adjusted Gross Profit Margin
Customer Net Savings (2)
(1) 18%
5-15%
Net Customer
Savings
10%
18%
9%
4%
7%
100-105%
10%3%
Revenue Net
2% (3)
Retention
7% 0%
2%
4%
(3%)
15-20yr.
(4%)
Est. Customer
Subscription Bill Auditing Optimization Procurement Recycling Lifetime (4)
Customer Journey
1. Adjusted Gross Profit is a non-GAAP measure. See the introduction to this presentation for a discussion of non-GAAP measures and the appendix for a reconciliation of
historical amounts to gross profit, the most directly-comparable GAAP measure. Adjusted Gross Profit Margin is calculated as Adjusted Gross Profit divided by Revenue.
2. Customer net savings calculated against incumbent service provider total cost baseline versus at the end of the first contract term, typically three years. Savings estimated
by management based on a $10 million revenue customer and Rubicon average internal operating key performance indicators..
3. Revenue net retention is calculated on an annualized basis as the percentage of prior period revenue retained from existing customers within the period, inclusive of
customer churn, as well as revenue expansion or contraction within an existing customer account.
4. Customer lifetime estimated based on the inverse of historical annualized customer revenue churn rates.37
Established Track Record of Gaining Customer Wallet-Share
REVENUE GROWTH FROM SELECTED CUSTOMERS
Annual Revenue ($ in thousands)
National Convenience Chain Southern US City
117% CAGR
58% CAGR
$21,836 $23,490 $741
$671
$17,301
$10,596
$3,736 $157
2017A 2018A 2019A 2020A 2021A 2019A 2020A 2021A
Global Logistics Fast Casual Dining
44% CAGR
61% CAGR
$23,143 $2,354
$1,664
$12,021 $1,157
$5,329 $6,440 $6,837 $664
$352
2017A 2018A 2019A 2020A 2021A 2017A 2018A 2019A 2020A 2021A38
Long-Term Model
($ in millions) 2021A 2022E 2023E 2024E Long-Term Target
Revenue $583 $736 $1,152 $1,596
(1)
Adjusted Gross Profit (Non-GAAP) 8.0% 10.5% 15.7% 19.3% 30.0% - 35.0%
Platform Support Costs 3.9% 4.6% 6.0% 7.5% 7.5% - 10.0%
% of Revenue
Sales & Marketing 2.5% 2.4% 2.8% 2.7% 2.0% - 3.0%
Product Development 3.9% 4.7% 4.0% 3.8% 3.0% - 5.0%
General & Administrative 7.7% 5.6% 4.5% 4.4% 3.5% - 5.0%
Adjusted EBITDA (Non-GAAP) (2) NM NM NM 1.0% 12.5% - 15.0%
1. Adjusted Gross Profit is a non-GAAP measure. See the introduction to this presentation for a discussion of non-GAAP measures and the appendix for a
reconciliation of historical amounts to gross profit, the most directly-comparable GAAP measure.
2. Adjusted EBITDA is a non-GAAP measure. See the introduction to this presentation for a discussion of non-GAAP measures and the appendix for a reconciliation
of historical amounts to net income, the most directly-comparable GAAP measure.39 Transaction Overview
40

Transaction Overview                                                                                                                                                                                          Pro Forma Ownership (1)(2)
($ Millions, Except per Share Price)
                                                                                                                                                                                                                                                        Rubicon Equity Rollover   74.5%
 ▪   Pro forma enterprise value of ~$1.7B
                                                                                                                                                                                                                                                        Founder SPAC Equity       15.9%
 ▪   The transaction will be funded by a combination of ~$321M of cash and
                                                                                                                                                                                                                                                        PIPE                      5.6%
     proceeds from a $111M PIPE (3)

 ▪   100% rollover by existing Rubicon equity holders                                                                                                                                                                                                   Founder Sponsor Shares    4.0%

 ▪   Completion of transaction is expected in Q3 2022

                                           PRO FORMA VALUATION                                                   (1)                                                                                                                           SOURCES & USES (3)

  Share Price (1)                                                                                                                                                     $10.00                                   Rubicon Equity Rollover   (4)                                         $1,483
  Pro Forma Shares Outstanding (2)(3)                                                                                                                                  198.9                                   Founder SPAC Cash in the Trust                                             321
 Total Equity Value                                                                                                                                                   $1,989                                   PIPE                                                                       111
                                                                                                                                                                                                               Founder Sponsor Shares                                                     79
  (+) Pro Forma Debt                                                                                                                                                      60
                                                                                                                                                                                                              Total Sources                                                          $1,994
  (-) Cash to Balance Sheet                                                                                                                                            (352)
 Total Enterprise Value                                                                                                                                               $1,697                                                             (4)
                                                                                                                                                                                                               Rubicon Equity Rollover                                               $1,483
                                                                                                                                                                                                               Cash to Balance Sheet                                                      352
 2023E Adjusted Gross Profit Multiple                                                                                                 $181                                  9.4x
                                                                                                                                                                                                               Founder Sponsor Shares                                                     79
                                                                                                                                                                                                               Estimated Transaction Costs                                                45
                                                                                                                                                                                                               Company Transaction Bonuses                                                35
                   Note: Adjusted Gross Profit (AGP) is a non-GAAP measure and represents revenue less payments to third party suppliers for waste services and waste generators for the value of             Total Uses                                                             $1,994
                   commodity streams. See the introduction to this presentation for a discussion of non-GAAP measures and the appendix for a reconciliation of historical amounts to gross profit, the most
                   directly-comparable GAAP measure;

                   1.        Assumes Rubicon rollover shares, FOUN public shares, FOUN sponsor shares and PIPE shares offered at $10.00 per share
                   2.        Pro forma share count includes: 148.250M Rubicon rollover shares (assumes no adjustment to Transaction Consideration for Excess Transaction Bonuses), 11.100M PIPE
                             shares, 31.625M FOUN public shares, 7.906M FOUN sponsor promote. Pro forma share count excludes the dilutive impact from public and private placement warrants as well
                             as earnout shares.
                   3.        Assumes no redemptions from SPAC public stockholders and fully subscribed PIPE
                   4.        Assumes no adjustment to Transaction Consideration for debt in excess of $60M or Excess Transaction Bonuses
41
Well-Positioned Against Peers
OTHER
CONSUMER FACING
BUSINESS FACING MARKETPLACES MARKETPLACE
MARKETPLACES
SOFTWARE
MEDIAN
9.4x EV / 2023
13.0x 12.5x 12.0x 10.1x 6.6x 4.6x 11.1x
EV / 2023 AGP NR
101% ’21-23 NR
’21-23 CAGR 33% 12% 27% 16% 25% 24% 13%
AGP CAGR
Source: Company management, CapitalIQ, Refinitiv, and public filings as of 12/08/2021
Note: Adjusted gross profit (AGP) is a non-GAAP measure and represents revenue less payments to third party suppliers for waste services and waste generators for the value of
commodity streams. See the introduction to this presentation for a discussion of non-GAAP measures and the appendix for a reconciliation of historical amounts to gross profit, the most
directly-comparable GAAP measure;42 Appendix
43

Statements of Operations & Other Financial KPIs

($ in millions)                                                                             For the Year Ended / Ending December 31,
                                                                  2018A        2019A         2020A           2021A           2022E        2023E             2024E

Revenue                                                             $358.9       $509.4         $539.4          $583.0          $736.1     $1,152.4          $1,596.0
  Cost of Revenue exclusive of Amortization and Depreciation         351.2        491.8          516.9           558.7           692.8      1,040.9           1,407.6
  Operating Expenses                                                  76.2         73.2           73.8            97.0           109.7        167.4             219.0
Operating Income / (Loss)                                           ($68.5)      ($55.7)        ($51.4)         ($72.6)         ($66.4)      ($56.0)           ($30.5)

Gross Profit (GAAP) Calculation
Revenue                                                             $358.9       $509.4         $539.4          $583.0
  Cost of Revenue exclusive of Amortization and Depreciation         351.2        491.8          516.9           558.7
  Amortization & Depreciation for Revenue Generating Activities        1.1          1.6            1.8             2.9
Gross Profit (GAAP)                                                   $6.6        $15.9          $20.6           $21.4

Balance Sheet Metrics
Long-Term Debt                                                            —        18.0           47.0            51.0

Cashflow Metrics
Net Cash from Operating Activities                                    (79.6)       (65.1)        (31.5)          (59.9)
Net Cash from Investing Activities                                    (49.1)        (1.3)         (1.5)           (4.0)
Net Cash from Financing Activities                                     80.2         72.8          21.3            68.5
44
Reconciliation of Non-GAAP Financials
($ in millions) 2018A 2019A 2020A 2021A
Gross Profit (GAAP) $6.6 $15.9 $20.6 $21.4
Amortization & Depreciation for Revenue Generating Activities 1.1 1.6 1.8 2.9
Platform Support Costs 14.1 17.3 19.8 22.6
(1)
Adjusted Gross Profit (Non-GAAP) $21.9 $34.8 $42.3 $46.9
Gross Profit Margin 1.8% 3.1% 3.8% 3.7%
(2)
Adjusted Gross Profit Margin 6.1% 6.8% 7.8% 8.0%
($ in millions) 2018A 2019A 2020A 2021A
Net Income (GAAP) ($70.8) ($60.4) ($58.6) ($73.2)
Income Tax Expense / (Benefit) 0.2 (0.4) (1.5) (1.7)
Other Expense / (Income) 0.9 0.6 0.4 (9.2)
Interest Expense / (Earned) 1.2 4.6 8.2 11.5
Depreciation & Amortization 4.2 6.4 6.5 7.1
Other Non-Cash Items 2.1 1.2 0.7 7.8
Adjusted EBITDA (Non-GAAP) (1) ($62.2) ($48.1) ($44.2) ($57.7)
1. Adjusted Gross Profit and Adjusted EBITDA are non-GAAP measures. See the introduction to this presentation for a discussion of non-GAAP measures.
2. Adjusted Gross Profit Margin is calculated as Adjusted Gross Profit divided by Revenue.45
Rubicon’s World Class Leadership Aims to Create a Future without Waste
Founded Rubicon in 2008 with the vision to Led Esurance’s expansion of offerings and Led public policy for the Manhattan Institute for Highly accomplished technology executive with
solve the environmental threats posed by global geographic footprint. Served as VP at Charles Policy Research, a national think tank focused 30 years of experience in corporate leadership,
waste. Also founded Morris Industries in 2010, a Schwab building a technology platform that on solving urban issues with free market including CFO and COO roles at Finjan
Kentucky based conglomerate that is supported 100,000 users. Well-versed in solutions. Oversaw public policy for Uber in Holdings. Executed transactions with over $20
reimagining the industrial economy. financial services, mobile internet and NYC and served as a Director for Partnership billion in aggregate consideration.
software development. for NYC.
Nate Morris Phil Rodoni Michael Allegretti Jevan Anderson
Chairman & Chief Technology Chief Strategy Chief Financial
Chief Executive Officer Officer Officer
Officer Since 2015 Since 2016 Since 2021
Since 2008
Served as Manager of Capital Strategy at Worked for Big Four accounting and national Served as General Manager at Veolia, a global Served as an Associate at Kilpatrick Townsend
Novelis, a global leader in sustainable law firms in venture financing, buy and sell side solutions company focused on addressing & Stockton LLP, prior to which he was an
manufacturing. transactions and strategic business partnership sustainability challenges. Associate at King & Spalding LLP. Earned his
structuring. Doctor of Jurisprudence (J.D.) from the
University of Virginia School of Law.
Chris Spooner Michael Heller Renaud de William Meyer
Senior Vice Chief Viel Castel General Counsel and
President, Finance Administrative and Chief Operations Corporate Secretary
Since 2015 People Officer Officer Since 2016
Since 2011 Since 2016
Served as strategic account director for Bigbelly Served as Director of Programs and Led the development of IHG’s Green Engage Led global marketing and communications
(waste IoT technology) and account executive at Communications at the Humanities Council of platform that provides cost-effective programs for NYSE-listed companies. Held
Mercatus (vertical software for energy Washington, D.C. sustainability solutions. senior marketing roles for some of the world’s
management). Served as District Manager for largest brands including Marriott International
ADP. and CBS Corporation.
Tom Owston Elizabeth Montoya David Rachelson Dan Sampson
Interim Chief Chief of Protocol and Chief Sustainability Chief Marketing &
Commercial Officer Investor Relations Officer Communications Officer
Since 2015 Since 2011 Since 2015 Since 2019
Served as Executive Vice President at Oakleaf Served as Director of Human Resources at
Waste Management LLC, working directly with Precyse Solutions, directing overall function of
Walmart, CVS, Dollar General and other major human Resources services, policies and
accounts. Honed his expertise at Champion programs.
International and Smurfit-Stone Container
Corporation, where he led a waste and
recycling subsidiary.
Perry Moss Stacie Moore
Chief Advisor Vice President of
Since 2011 Human Resources
Since 2018
Source: Company WebsiteYou can also read