LOW TEMPERATURE SYNTHESIS OF BIFEO3 NANOPARTICLES WITH ENHANCED MAGNETIZATION AND PROMISING PHOTOCATALYTIC PERFORMANCE IN DYE DEGRADATION AND HYDROGEN
←
→
Page content transcription
If your browser does not render page correctly, please read the page content below
Low temperature synthesis of BiFeO3 nanoparticles with enhanced magnetization
                                                       and promising photocatalytic performance in dye degradation and hydrogen
                                                                                       evolution
                                                                                     M. A. Basith∗ , Nilufar Yesmin, and Rana Hossain
                                                                                  Nanotechnology Research Laboratory, Department of Physics,
                                                                                    Bangladesh University of Engineering and Technology,
                                                                                                   Dhaka-1000, Bangladesh.
                                                                                       *
                                                                                         Corresponding author: mabasith@phy.buet.ac.bd

                                                                                                     DOI: 10.1039/c8ra04599b
arXiv:2202.02505v1 [cond-mat.mtrl-sci] 5 Feb 2022

                                                                  In this investigation, we have synthesized BiFeO3 nanoparticles by varying hydrothermal reaction
                                                               temperatures from 200 ◦ C to 120 ◦ C to assess their visible-light driven photocatalytic activity along
                                                               with their applicability for hydrogen production via water splitting. The rhombohedral perovskite
                                                               structure of BiFeO3 is formed for hydrothermal reaction temperature up to 160 ◦ C, however, for a
                                                               further decrement of reaction temperature a mixed sillenite phase is observed. The XRD Rietveld
                                                               analysis, XPS analysis and FESEM imaging ensure the formation of single-phase and well crystalline
                                                               nanoparticles at 160 ◦ C reaction temperature with 20 nm of average size. The nanoparticles fabri-
                                                               cated at this particular reaction temperature also exhibit improved magnetization, reduced leakage
                                                               current density and excellent ferroelectric behavior. These nanoparticles demonstrate considerably
                                                               high absorbance in the visible range with low band gap (2.1 eV). The experimentally observed band
                                                               gap is in excellent agreement to the calculated band gap using the first-principles calculations. The
                                                               favorable photocatalytic performance of these nanoparticles has been able to generate more than
                                                               two times of solar hydrogen compared to that produced by bulk BiFeO3 as well as commercially
                                                               available Degussa P25 titania. Notably, the experimentally observed band gap is almost equal for
                                                               both bulk material and nanoparticles prepared at different reaction temperatures. Therefore, in
                                                               solar energy applications, the superiority of BFO nanoparticles prepared at 160 ◦ C reaction temper-
                                                               ature may be attributed not only to solely their band gap but also to other factors, such as reduced
                                                               particle size, excellent morphology, well crystallinity, large surface to volume ratio, ferroelectricity
                                                               and so on.

                                                                    I.   INTRODUCTION                               many propositions along with numerous researches have
                                                                                                                    been conducted on hydrogen production via water split-
                                                       Nanotechnology has made tremendous impact in con-            ting [8]. In the past decade, extensive studies were per-
                                                    tribution to the solution of local as well as global en-        formed on a broad range of materials, including mod-
                                                    ergy crisis by converting sunlight directly into elec-          ified TiO2 [9], SrTiO3 [10] and metal oxide-metal hy-
                                                    tric/chemical power. A promising area for the applica-          brids like ZnO/(La,Sr)CoO3 [11] and CdS/TiO2 /Pt [12]
                                                    tion of nanotechnology is the hydrogen economy. As a            to improve their photocatalytic water splitting ability
                                                    non-polluting source of energy, hydrogen (H2 ) can be a         under UV-visible light irradiation. Recently, significant
                                                    good alternative fuel of the future [1–3] without pollut-       amount of research is being done with a view to improv-
                                                    ing the environment. H2 production can be performed             ing the photocatalytic activity of the multiferroic mate-
                                                    from different domestic feedstock including hydrocar-           rials such as bismuth iron oxide (BiFeO3 ) to investigate
                                                    bon fossil fuels and water. Notably, H2 produced by             its potentiality for solar hydrogen generation [1, 13].
                                                    splitting of water [4–6] under solar light illumination         BiFeO3 (BFO) intrigues with its multiferroic proper-
                                                    are of great promise as a fuel that is essentially car-         ties being potentially applicable in energy-related prob-
                                                    bon free and inexhaustible in nature with potential for         lems especially for photocatalytic hydrogen production
                                                    generating low cost power in power plants as well as in         imputed to its relatively small band-gap (2.6 eV) [14–
                                                    vehicles of next generation.                                    17]. It is reported that BiFeO3 generates hydrogen at
                                                             Photocatalytic disintegration of water [7] into        a greater amount than commercially available titania
                                                    H2 and O2 while irradiated by light in the visible re-          under exact parametric conditions [13]. Utilization of a
                                                    gion has been considered as one of the promising routes         somewhat broader sunlight spectrum along with a large
                                                    for H2 production as an endless source of clean fuel            polarization value of BFO efficiently generated electron-
                                                    for many applications. In 1972, Fujishima and Honda             hole pairs [18]. Notably, BFO could potentially sup-
                                                    used successfully titania (TiO2 ) photoelectrode for the        plant the widely investigated photocatalyst TiO2 that
                                                    decomposition of water [3] under illumination with sun-         has an inherent limitation of wide band gap (3.2 eV),
                                                    light and without any applied electric power. Since then        qualifying its utilization to only 4% of the solar spec-
2

trum [19]. Despite the great potential it possesses, the      of BFO nanoparticles adapting a facile hydrothermal
somewhat inferior photocatalytic performance of bulk          process for different reaction temperatures and a fixed
BiFeO3 restrains its commercialization [20, 21].              KOH concentration of 10 M [27]. With a view to know-
          Multiferroic BiFeO3 was discovered in 1960,         ing the crystallographic phases, we scrutinized Rietveld
however, it remains difficult to synthesize single phase      refinement on powder XRD data of the samples synthe-
BFO nanoparticles with excellent morphology owing to          sized over a wide range of temperatures varying from
the fact that the temperature range for stability is in       200 ◦ C to 120 ◦ C. Notably, in most of the previous hy-
fact quite narrow for this material. If the synthesis con-    drothermal investigations either crystallographic phases
dition, particularly the processing temperature is not        of BFO nanoparticles were not identified by Rietveld
subject to accurate control, other impurity phases such       or related analysis and/or it was done at a particular
as Bi2 Fe4 O9 appears in BFO nanoparticles. Therefore,        temperature [27, 28] not like here over a wide range of
a number of synthesis techniques for BFO nanoparticles        temperatures. We observed that well-dispersed, single-
have been developed at different temperatures. These          phase perovskite BFO nanoparticles with average parti-
include soft chemical routes (e.g. sol-gel method) [22],      cle size 20 nm can be produced by hydrothermal process
ultrasonication technique [23], microemulsion technique       at temperature as low as 160 ◦ C (from here this mate-
[24] and microwave-hydrothermal process [25]. Most of         rial is referred as BFO 160 unless otherwise specified).
these synthesis techniques, inherently cost inefficient,      A further reduction of temperature to 140 ◦ C did not
comprise of higher than 400 o C calcination tempera-          allow fabrication of single phase perovskite structure
tures for achieving phase purity for BFO which intro-         rather produce sillinite type mixed phases nanoparti-
duces irregular morphology and broad particle size dis-       cles. Interestingly, the single-phase BFO 160 nanopar-
tribution. While sol-gel has gained popularity among          ticles demonstrate excellent multiferroic, optical and
different wet chemical techniques, it has a stringent re-     photocatalytic properties. The hydrogen evolution ex-
quirement of an annealing temperature of 600 o C as           periment exhibited that BFO 160 nanoparticles gener-
the concluding step as well as a post treatment simi-         ated more than two times hydrogen than that of BFO
lar to solid-state synthesis techniques for elimination of    bulk material and commercially available TiO2 under
impurity phases. Combustion synthesis can yield nano-         the same experimental conditions.
sized BFO powder at the expense of phase purity [26]
being inferior to the ones synthesized by the soft chem-
ical route [22]. Hence, synthesis of phase pure BFO
nanoparticles at a moderate preparation condition has
become quite challenging. Since many years, hydrother-
mal synthesis of phase pure BFO powders gained inten-                  II.   EXPERIMENTAL DETAILS
sive research interest due to its potential in synthesizing
crystalline ceramics at a temperature of 200 ◦ C or even                     A.   Sample Preparation
lower without any further step of calcination. This is
a cost effective and simple method, and the primacy of
this technique is its significantly lower required temper-       In the present investigation, the chemical reagents
ature than both solid-state and sol-gel syntheses. Dur-       are analytical grade bismuth nitrate (Bi(NO3 )3 .5H2 O),
ing the preparation of BFO, such a low processing tem-        ferric nitrate (Fe(NO3 )3 .9H2 O), and potassium hydrox-
perature qualifies the reactants from getting volatilized     ide (KOH). In a typical procedure, 1mmol bismuth ni-
as well as minimizing the calcination introduced impu-        trate pentahydrate [Bi(NO3 )3 .5H2 O] and 1mmol ferric
rities.                                                       nitrate nonahydrate [Fe(NO3 )3 .9H2 O] in stoichiomet-
          Therefore, it is obvious that enormous effort       ric proportions were dissolved in 50mL of 10M KOH
was paid to conduct extensive research to synthesize          solution and stirred it for 4h [27–29]. The mixture was
pure BFO nanoparticles using hydrothermal technique.          transferred to a Teflon-lined autoclave (stainless steel,
However, there is still lack of a thorough investigation      capacity 100 ml) and was heated at different reaction
on synthesis, characterization and application of pure        temperatures between 200 ◦ C to 120 ◦ C for 6 hours
BFO nanoparticles with desired phase and crystallinity        followed by natural cooling to bring it to room temper-
prepared at very low temperature using a facile, low          ature. Centrifugation was applied to collect the final
cost synthesis route like hydrothermal. It is indeed          products and consequent rinsing was performed with
very essential to shed light to know different crystal-       distilled water and ethanol. Prior to further character-
lographic phases formed at different reaction temper-         ization, they were dried at 90 ◦ C for 6 hours. Bulk
atures and finally figure out the appropriate reaction        BiFeO3 sample had also been prepared from high pu-
temperature to obtain phase pure BFO nanoparticles            rity oxides using solid state reaction method with an
ensuring their quality as required for practical applica-     objective of comparing its properties to the synthesized
tions. In this investigation, we delineate the synthesis      nanoparticles [30].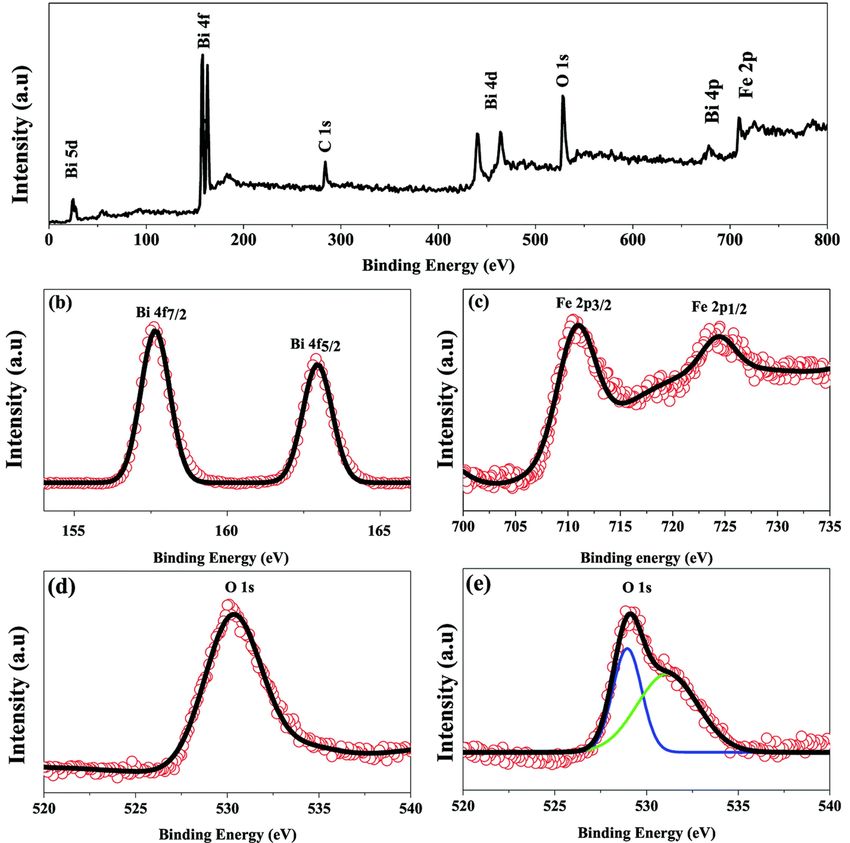
3

           B.   Materials Characterization                  with interval 0.5 eV for Fe 3d orbital [35]. The op-
                                                            tical absorption coefficient
                                                                                rq         was obtained by the equa-
   The crystal structures and phase composition of the                   √
                                                            tion α = 2μ0 ω            ε21 (ω) + ε22 (ω) – ε1 (ω), where
synthesized samples were determined from XRD data
using a diffractometer (PANalytical Empyrean) with          ε1 (ω) and ε2 (ω) are frequency dependent real and
a Cu X-ray source (Wavelength, λ: Kα1 = 1.540598            imaginary parts of dielectric function, ω is photon fre-
Åand Kα2 = 1.544426 Å. The particle size along with         quency, μ0 is the permeability of free space [36]. The
morphology was observed with help of field emission         real part of the dielectric function ε1 (ω) can be eval-
scanning electron microscopy (FESEM) (XL30SFEG;             uated from the imaginary part ε2 (ω) by the famous
Philips, Netherlands and S4300; HITACHI, Japan). X-         Kramers-Kronig relationship [37]. Direct optical band
ray photoelectron spectroscopy (XPS) was used to in-        gap of the samples was  obtained from the equation
vestigate the chemical states of synthesized nanopar-       (αhυ)n = A hυ – Eopt , where A is a constant and n
ticles. A vibrating sample magnetometer (VSM) was           denotes the transition type as follows: n = 2 for direct
used for measuring the magnetic properties of the BFO       allowed, 2/3 for direct forbidden, 1/2 for indirect al-
powders at room temperature. The leakage current den-       lowed and 1/3 for indirect forbidden transitions [38]. By
sity along with polarization vs electric field hysteresis   extrapolating the linear proportion of the (αhυ)n vs hυ
loops were measured using a ferroelectric loop tracer       plot to (αhυ)n = 0 the optical band gap of the samples
in conjunction with external amplifier (10 kV). Pellets     was calculated using Tauc plot [39].
were prepared by pressing the powders with a hydraulic
press followed by annealing at 750 ◦ C with high heating
rate (20 ◦ C/min) with a view to measuring the elec-
trical properties [31]. An Ultraviolet-visible (UV-vis)
spectrophotometer (UV-2600, Shimadzu) was used to
obtain diffuse reflectance spectra (DRS) of the samples
for wavelength ranging from 200 to 800 nm. BaSO4
powder, a nonabsorbing standard material, was used as                 D.    Photocatalytic performance
the reference for total reflectance with the focused beam
spot size being approximately of 2 mm2 .
                                                               The photocatalytic performance of BFO bulk mate-
                                                            rial and hydrothermally prepared nanoparticles at dif-
                                                            ferent reaction temperatures were subject to evaluation
C.   Theoretical Calculation of Optical Properties
                                                            by photodegradation of Rhodamine B (RhB) [40] under
                                                            illumination of visible light in aqueous solutions using a
   With a view to understanding the optical proper-         500 W Xe lamp as a solar simulator accompanied with
ties of BFO bulk and BFO 160 nanoparticles, the             a visible cutoff filter (λ ≥ 420 nm). Beginning with
optical absorption was calculated based on crystallo-       a concentration of 15 mg/L of RhB, 80 mg of cata-
graphic structural parameters obtained from Rietveld        lyst was later added to the solution in a quartz glass
refinement [32] of this investigation. The calculations     reactor for each experiment. Before illumination, the
were performed using first-principles density functional    mixture was magnetically stirred in the dark for 1 hour
theory (DFT) within the plane wave pseudopotential          for achieving the equilibrium between adsorption and
(PWPP) framework as implemented in the Cambridge            desorption processes. After sufficient agitation, 4 mL
Serial Total Energy Package (CASTEP) [33]. The              of mixture was taken followed by centrifugation at 5000
generalized gradient approximation (GGA) with the           rpm for 10 min so that the catalyst powders are re-
Perdew-Burke-Ernzerhof (PBE) exchange-correlation           moved. The concentration of RhB was then estimated
functional within ultrasoft pseudopotentials (USP) was      from the measurement of the maximum absorbance at
implemented to describe the electron-ion      interaction   553 nm with a UV-visible spectrophotometer. Testing
of valance electrons of Bi 6s2 6p3 , Fe 3d6 4s2 and

                                                            for stability, the remaining photocatalyst powders in
O 1s2 2p4 [34]. Plane wave cutoff and k-point sam-

                                                            suspension were separated by centrifugation after pho-
pling, tested with a cutoff of 400 eV and a k-point sam-    tocatalytic degradation of RhB and distilled water was
pling of 6×6×6, was found sufficient for the rhombo-        used to wash them to remove the residual RhB. Prior
hedral unit cell of the samples. Spin polarized mode        to using them in another photocatalytic reaction, they
during self-consistent field (SCF) calculations was en-     were further dried. The same procedure was followed
dorsed and a SCF tolerance of 10–7 eV/atoms was             three times. For comparison commercially available De-
used. To assure a precise agreement with experimental       gussa P25 titania nanoparticles were used to perform
results, the on-site Coulomb interaction was included       dye degradation experiment under the same experimen-
in the DFT+ U approach with U = 3 eV to 7 eV                tal conditions.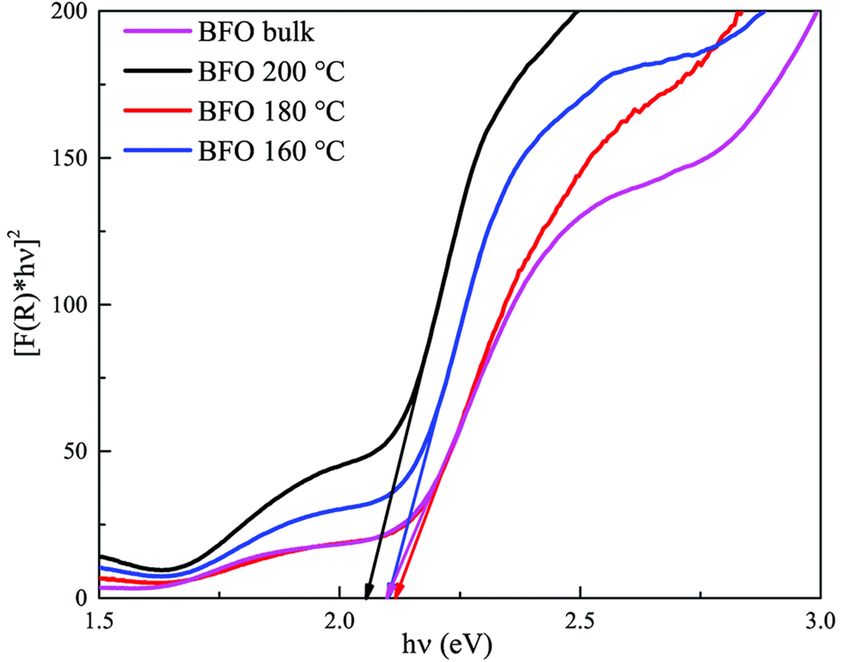
4

                E.   Hydrogen Generation                    impurity phase (like Fe2 O3 , Fe3 O4 , Bi2 Fe4 O9 etc,) has
                                                            been determined to the precision limit of XRD. More-
   A photocatalytic hydrogen generation experiment          over, it is seen that for hydrothermal reaction temper-
has been performed in a slurry-type photochemical re-       ature up to 160 ◦ C, the nanoparticles (Fig. ?? (b-
actor. In a typical experiment, 20mg of catalyst parti-     d)) present a single-phase structure. For a further de-
cles is measured and initiated in the reaction container    crease of reaction temperature to 140 ◦ C and 120 ◦ C
with 30ml water. Magnetic stirring is applied to mix        a structural transition to sillenite type Bi25 FeO40 (Fig.
the solution while purging the system with argon gas        1 (e-f)) phase is formed. Thus, the structural scrutiny
for 30min to ensure an atmosphere, necessarily inert in     clearly indicates that the minimal reaction temperature
nature as required for the splitting process. A 500W        for obtaining perovskite type pure BFO phase is 160 ◦ C.
Xenon lamp was used for photoillumination. The gas          Therefore, we have carried out further characterization
was collected when each of the experiments ended and        for nanoparticles prepared hydrothermally at reaction
scrutinized in the gas chromatography (GC) device that      temperatures of 200 ◦ C-160 ◦ C.
is equipped with a thermal conductivity detector (TCD)                 From the refinements of the XRD patterns, the
and a gas analyzer for identifying the gas components.      Fe-O-Fe bond angle and FeO6 octahedral tilt angle ω
The GC programming, set up with a reverse polariza-         are recapitulated in Table 1. The Fe-O-Fe bond an-
tion, made the hydrogen peaks occur in an upwards           gle of BFO bulk material and nanoparticles prepared
direction so that we can make a comparative analysis        at 200 ◦ C, 180 ◦ C and 160 ◦ C reaction temperatures
of the peak intensities of the different gases that were    are 160.8753◦ , 158.6353◦ , 158.3842◦ , 152.8377◦ , respec-
produced. The hydrogen evolution test was also per-         tively as shown in Table 1. The average Fe-o-Fe bond
formed for commercially available Degussa P25 titania       angle is maximum for bulk BFO material, however, a
nanoparticles under the same experimental conditions.       monotonic decrease of the average Fe-O-Fe angle from
                                                            158.6353◦ to 152.8377◦ is observed with decrease of hy-
                                                            drothermal reaction temperatures. Correspondingly, we
                                                            observed an increase of the FeO6 octahedral tilt angle
       III.     RESULTS AND DISCUSSIONS
                                                            (ω) with the decrease of reaction temperatures. The al-
                                                            terations in the Fe-O-Fe bond angle and FeO6 octahe-
           A.    Structural characterization                dral tilt angle play role to modify the magnetic behavior
                                                            of the synthesized nanoparticles.
   Fig. 1 shows the Rietveld refined XRD patterns of
BFO nanoparticles synthesized by hydrothermal pro-
cess at reaction temperatures 200 ◦ C, 180 ◦ C, 160 ◦ C,                   B.   Morphology analysis
140 ◦ C and 120 ◦ C with the peaks indexed on the basis
of Rhombohedral structure (JCPDS File No. 71-2494).            The morphology of the surface and the size of the fab-
For the comparison, XRD pattern of BFO bulk poly-           ricated particles were analyzed by using FESEM imag-
crystalline sample prepared via conventional solid state    ing. The surface morphology and their corresponding
reaction is also depicted in Fig. 1 (a). Rietveld re-       histograms of bulk BFO sample produced by solid state
finement was performed with the FULLPROF package            reaction technique and BFO materials synthesized by
[41]. The structural variables and constituent phases (in   hydrothermal method at 200 ◦ C, 180 ◦ C and 160 ◦ C
wt%) calculated from the Rietveld refined XRD spectra       reaction temperatures are shown in Fig. 2. According
of the synthesized materials have been provided in Sup-     to Fig. 2 (a) and corresponding histogram Fig. 2 (b),
plemental Table 1 [42]. The small values of Rwp and         the average grain size of bulk BFO material is around
Rp shown in Supplemental Table 1 [42] indicate very         1 μm. The size of the bulk BiFeO3 was also determined
good fit for hydrothermally prepared BFO nanoparti-         from the XRD pattern (maximum intensity peak) us-
cles to the Rhombohedral structure. Reproduction of         ing Scherrer equation and found to be around 600 nm
all the observed reflections can be performed from this     which is comparable to the value obtained from FE-
structural model. Calculated lattice parameters (a and      SEM image (Fig. 2 (a) and (b)). FESEM images in
c) have been listed in Table 1 for all the major phases.    figure 2 (c-d) show BFO materials synthesized for the
          As was mentioned, the major phase of the syn-     reaction temperatures 200 ◦ C, and 180 ◦ C, respectively.
thesized materials is observed to be of Rhombohedral        Fig. 2 (e-f) depicts the BFO nanoparticles synthesized
crystal structure belonging to space group R3c. How-        at 160 ◦ C reaction temperature and their corresponding
ever, some secondary impurity phases are present for        histogram for size distribution.
both bulk polycrystalline material and hydrothermally                 The electronic micrographs obtained by FE-
prepared nanoparticles at reaction temperatures 140 ◦ C     SEM, Fig. 2 (c-d), show the particles are prone to
and 120 ◦ C. For nanoparticles prepared at hydrother-       get interconnected with one another and aggregating to
mal reaction temperatures 200 ◦ C to 160 ◦ C no obvious     larger particles at higher reaction temperatures i.e. at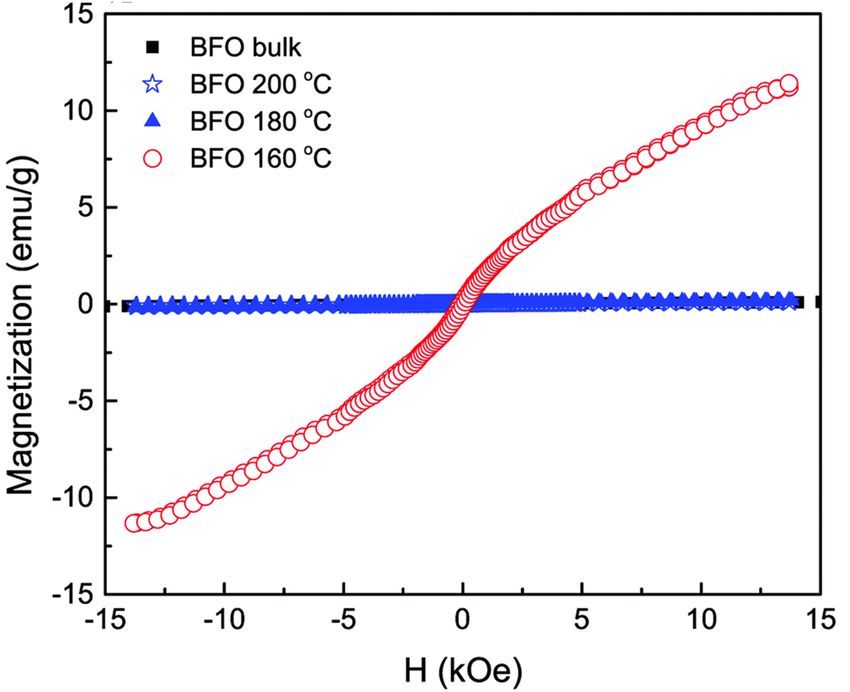
5

Figure 1. Rietveld plots of XRD patterns of (a) BFO bulk material synthesized by solid state reaction technique and
hydrothermally prepared nanoparticles at reaction temperatures (b) 200 ◦ C (c) 180 ◦ C (d) 160 ◦ C (e) 140 ◦ C (f) 120 ◦ C.

                              Table I. Structural parameters determined from XRD spectra

  Sample                   a=b              c                  Volume bond angle FeO6 tilt
                           (Å)              (Å)                (Å)3           Fe-O-Fe (◦ ) angle (ω in ◦ )
  BFO Bulk                 5.5775(1) 13.8663(1) 373.577 160.8753                                   10.310
  BFO (200 ◦ C) 5.5743(1) 13.8612(3) 373.003 158.6353                                              10.682
  BFO (180 ◦ C) 5.5761(1) 13.8634(3) 373.314 158.3842                                              10.807
  BFO (160 ◦ C) 5.5758(1) 13.8656(4) 373.327 152.8377                                              15.857

200 ◦ C and 180 ◦ C. However, for a comparatively lower        to 160 ◦ C. Previous investigation also reported such a
reaction temperature of 160 ◦ C, spherical and well dis-       change in morphology of BFO nanoparticles by varying
persed BFO nanoparticles, Fig. 2 (e-f) with sizes rang-        the concentration of KOH for a fixed hydrothermal reac-
ing from 20 nm to 30 nm is formed. Our investigation           tion temperature of 200 ◦ C [43]. We think, from energy
demonstrates that the morphology of the synthesized            consumption point of view it is much more desirable to
BiFeO3 materials changed from agglomerations to reg-           control the surface morphology at a lower hydrother-
ular spherical shape with a narrow distribution of size        mal reaction temperature of 160 ◦ C under a fixed con-
when the reaction temperature is reduced from 200 ◦ C          centration of KOH. Moreover, Bi is highly volatile and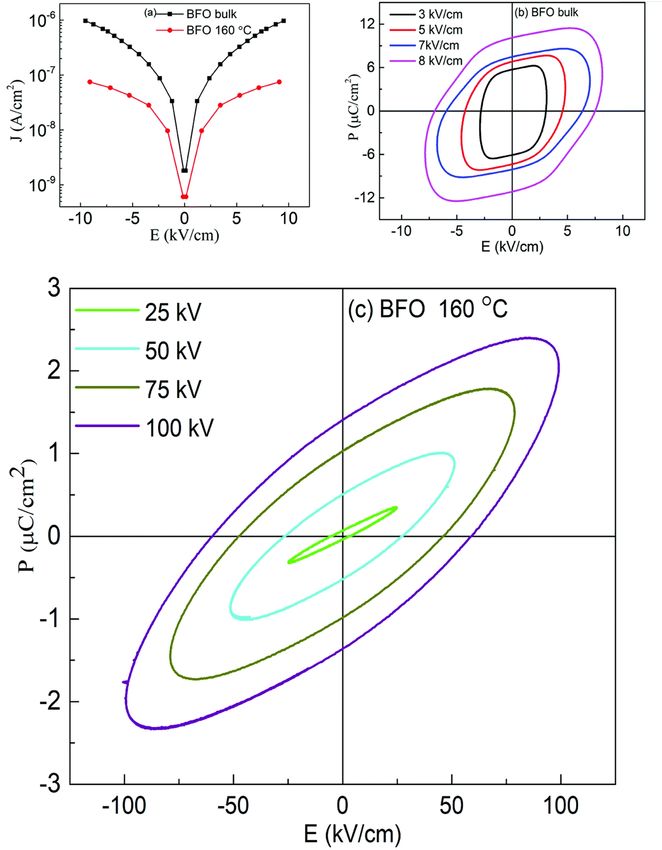
6

                                                                 C.   X-ray photoelectron spectroscopic analysis

                                                                  The XRD analysis and FESEM imaging confirmed
                                                               that single phase, well crystalline BFO nanoparticles
                                                               formed at 160 ◦ C reaction temperature may meet the
                                                               demand of practical applications. Therefore, X-ray pho-
                                                               toelectron spectroscopy was carried out to further iden-
                                                               tify the chemical composition of BFO 160 nanoparticles
                                                               which were prepared at hydrothermal reaction temper-
                                                               ature 160 ◦ C. Fig. 3 shows the typical full survey of
                                                               XPS spectrum of BFO 160 nanoparticles. Observing
                                                               the survey spectrum, aside from the weak peak of C 1s,
                                                               only O, Fe, and Bi core levels were detected, indicating
                                                               that the resulting product is highly pure. Fig. 3 (b-d)
                                                               shows the high resolution XPS spectra of the Bi 4f, Fe
                                                               2p and O 1s core levels for the BFO 160 nanoparticles,
                                                               respectively. The core level XPS spectrum of Bi can be
                                                               distinguished by two Gaussian peaks at 4 f7/2 and 4 f5/2
                                                               corresponding to the binding energy of 157.64 eV and
                                                               162.93 eV, respectively. The spin-orbit splitting energy
                                                               of the Bi 4f is 5.3 eV [45, 46]. Fig. 3 (c) shows a high
                                                               resolution of XPS measurements for Fe contents. Two
                                                               main peaks: one at 710.9 eV and another at 724.7 eV
                                                               have been assigned to corresponding states of Fe 2p3/2
                                                               and 2p1/2 with the energy for spin-orbit splitting be-
                                                               ing 13.35 eV for Fe 2p [45]. For a better insight of
                                                               the chemical composition we have scrutinized the O 1s
                                                               peak of BFO 160 nanoparticles (Fig. 3 (d)) and bulk
Figure 2. FESEM images of surface morphology of (a) BFO        BiFeO3 materials Fig. 3(e). The uniformly single XPS
bulk material synthesized by solid state reaction technique    peak of O 1s (530.29 eV) demonstrated that the BiFeO3
and (b) corresponding histogram. Hydrothermally prepared       nanoparticles synthesized at 160 ◦ C hydrothermal reac-
nanoparticles at reaction temperatures (c) 200 ◦ C (d) 180
◦                                                              tion temperature prepared in this investigation is indeed
  C, respectively. The nanoparticles and their corresponding
histogram prepared at hydrothermal reaction temperature        a compound of single-phase. The XPS spectrum of O 1s
160 ◦ C are depicted in (e) and (f), respectively.             core level for bulk BiFeO3 materials, as shown in Fig.3
                                                               (e), can be de-convoluted into two symmetric Gaussian
                                                               peaks. The lower binding energy peak at 529.8 eV cor-
                                                               responds to the O 1s core spectrum, while the higher
                                                               binding energy peak is related to the oxygen vacancy in
such a low processing temperature prevents reactants           the bulk BFO sample.
from getting volatilized during the formation of BFO
powders and minimize the amount of impurities as was
mentioned earlier.
                                                                          D.   Magnetic characterization
   During the hydrothermal preparation of BFO pow-
ders, the size of the final products depends on two mutu-         The field dependent magnetic hysteresis loops (M-
ally competitive processes: crystal nucleation and crys-       H) of bulk BFO material and hydrothermally synthe-
tal growth [44]. Provided the rate of crystal nucleation       sized nanoparticles are investigated at room tempera-
is greater than that of growth, then the product parti-        ture with an applied magnetic field of up to ±15 kOe.
cle size becomes smaller. We expect that in our exper-         In Fig. 4, the obtained magnetization for bulk BFO
iment with the decrease of reaction temperature to 160         prepared by solid state reaction technique changes lin-
◦ C, the growth rate was decreased, however, nucleation        early with magnetic field which demonstrates its anti-
rate was increased and consequently the average size           ferromagnetic nature [47, 48]. However, the magnetic
of the particles was significantly reduced. The smaller        behavior of BFO nanoparticles varies depending on hy-
particle size may provide an increased surface area to         drothermal reaction temperatures. We have calculated
volume ratio and substantial adsorption capacity, that         the remanent magnetization (Mr ) of the synthesized
is required to obtain a high photocatalytic performance.       samples from the M-H hysteresis loops [49, 50]. The
7 Figure 3. XPS spectra of the as-synthesized BFO 160 nanopowders (a) a typical XPS survey spectrum, (b–d) high-resolution XPS core spectra of Bi 4f, Fe 2p, and O 1s, respectively. (e) XPS spectra of O 1s of BFO bulk materials. maximum magnetization (Ms ) at an applied magnetic size of 14 nm were prepared using sol-gel method for an- field of 13 kOe is also calculated from the hysteresis nealing temperature of 400 ◦ C and the obtained Ms was loops. Both Mr and Ms are higher for BFO nanoparti- 1.55 emu/g at 50 kOe. The observed Ms was 1.4 emu/g cles prepared at 160 ◦ C hydrothermal reaction temper- at 70 kOe for 18 nm BFO nanoparticles fabricated by ature. In particular at 13 kOe applied magnetic field, sol-gel method with annealing temperature 425 ◦ C [52]. the Ms value is 11.3 emu/g which is exceptionally high In our investigation, such a remarkable high value of compared to the values reported in literature [51, 52]. magnetization (11.3 emu/g) of the hydrothermally syn- In investigation [51], BFO nanoparticles with a particle thesized nanoparticles at reaction temperature 160 ◦ C
8

                                                                        From Fig. 5 (a), it can be implied that the
                                                              leakage current density of the hydrothermally synthe-
                                                              sized BFO 160 nanoparticles is smaller compared to
                                                              that of the bulk. Impurity phases along with oxygen
                                                              vacancies contribute to the high leakage current of bulk
                                                              material [52, 55]. Previous demonstration from Fig. 1
                                                              (d) for BFO 160 nanoparticles indicate inhibition of im-
                                                              purity phases. Furthermore, Fig. 3 shows that in BFO
                                                              160 nanoparticles, we observed only O 1s core spec-
                                                              trum, and obviously no oxygen vacancy related defects.
                                                              Therefore, we think that the oxygen vacancies, princi-
                                                              pally induced by volatilized Bi3+ ion in the bulk ma-
                                                              terial, were suppressed in BFO 160 nanoparticles and
                                                              consequently the density of leakage current was reduced.
                                                                        Fig. 5 (b-c) shows the polarization of ferro-
                                                              electric hysteresis loops of (b) bulk BFO and (c) BFO
                                                              160 nanoparticles measured for varying electric fields.
                                                              Driving frequency maintained at 50 Hz, continuously
                                                              increasing electric field resulted in the increase of re-
Figure 4. The room temperature M–H hysteresis loops of
BFO bulk material synthesized by solid state reaction tech-   manent polarization as stronger electric field with its
nique and hydrothermally prepared nanoparticles at reac-      higher level of driving power contributed to the rever-
tion temperatures 200 ◦ C, 180 ◦ C and 160 ◦ C.               sal of ferroelectric domains [56].
                                                                        Freely movable charges are expected to con-
                                                              tribute more to the electrical hysteresis loop for bulk
demands an extensive investigation of the magnetic be-        BFO. Thus, the bulk BFO material shows a round
havior of this material.                                      shaped P-E loop as observed in Fig. 5 (b) owing to
          The rationale behind improved magnetization         high leakage current which is evident from Fig. 5 (a).
can be imputed to several factors, such as: (i) The Ri-       For BFO 160 nanoparticles, the contribution of the dy-
etveld refinement of XRD data (Table I) clearly reveals       namic charges to the polarization is reduced due to the
that the Fe-O-Fe bond angle is minimum for nanopar-           decrease in rounded shapes of the loops. Furthermore,
ticles with average size 20 nm produced at hydrother-         the P-E loops of BFO nanoparticles tend to become
mal reaction temperature 160 ◦ C. Such a decrement in         increasingly typical which can be associated with the
Fe-O-Fe bond angle is crucial for developing ferromag-        reduction in leakage current density [57] and decreased
netism due to the strengthening of magnetic interaction       space charge defect [58] compared to that of bulk ma-
caused by decreased Fe-O-Fe bond angle. This is con-          terial. Thus, the measurement of electrical properties
sistent with previous investigations which reported that      shows an improvement in ferroelectric behavior of BFO
ferromagnetism can be realized in BFO by tuning Fe-           160 nanoparticles. While comparing the P-E loops be-
O-Fe bong angle with reduced particle size [53, 54]. (ii)     tween BFO bulk and BFO 160 nanoparticles, Fig. 5
At room temperature, magnetization in G-type anti-            (b) and (c) also demonstrate that the significantly im-
ferromagnetic bulk BFO is subdued along with a spin           proved breakdown voltage up to 100 kV/cm for BFO
helical ordering structure showing a periodicity of 62        160 nanoparticles compared to 10 kV/cm for bulk ma-
nm. Compared to bulk materials, in the case of phase          terial.
pure nanoparticles, the periodic spiral-regulated spin
structure can be modified with the decrease in size of
particles, and hence magnetization increases.(iii) The                    E.   Optical characterization
enhanced ferromagnetism in BFO nanoparticles with
average particle 20 nm may be due to the reduced size            Photocatalytic performance of a material depends on
of the phase pure nanoparticles. With decrease in par-        its ability to effectively absorb visible light. Optical
ticle size, the surface-to-volume ratio is enhanced and       band gap signifies the minimum energy of the photons
hence the surface spins contribute more to the arrant         that a material can absorb to generate electron-hole
magnetic moment of the particle [23, 49, 51, 52].             pairs via interband transition. To determine the optical
          To further confirm the multiferroicity of hy-       band gap, the diffuse reflectance spectra of the synthe-
drothermally prepared BFO 160 nanoparticles, P–E              sized materials were obtained from UV-vis spectropho-
hysteresis loops were investigated. Prior to conducting       tometric measurements. Determining F(R), a parame-
P-E hysteresis, the leakage current density (J) versus        ter proportional to the absorption coefficient, from the
electric field (E) measurements were carried out.             diffuse reflectance value using Kubelka-Munk function,
9 Figure 5. (a) Leakage current density of BFO bulk material and nanoparticles prepared at 160 ◦ C hydrothermal reaction temperature. The polarization vs. electric field (P–E) hysteresis loops of (b) BFO bulk material and (c) nanoparticles prepared at 160 ◦ C hydrothermal reaction temperature.
10

                                                             tocatalysts since they are capable of absorbing visible
                                                             range photons effectively. However, all the synthesized
                                                             materials have almost equal band gaps and hence, supe-
                                                             riority of a particular sample in photocatalytic applica-
                                                             tions cannot attributed solely to its band gap. Rather,
                                                             there are other factors which will also play important
                                                             roles in determining the efficiency of a material as pho-
                                                             tocatalyst such as particle size, surface morphology,
                                                             phase purity, ability to suppress electron-hole recom-
                                                             bination etc.

                                                                       1.   Theoretical calculation of band gap

                                                                BFO bulk and BFO 160 nanoparticles were subject
                                                             to First-principles calculation with a view to compar-
                                                             ing the experimentally obtained values of band gap to
                                                             the theoretically calculated ones. While standard DFT
Figure 6. Tauc plots for band gap estimation of BFO bulk
                                                             methods are widely in use for such calculations, ex-
material synthesized by solid state reaction technique and
hydrothermally prepared nanoparticles at reaction temper-    perimentally obtained outcomes of BiFeO3 are more
atures 200 ◦ C, 180 ◦ C and 160 ◦ C.                         closely comparable to the DFT calculated values when
                                                             Hubbard U parameter, a measure of effective on-site
                                                             Coulomb interaction, is chosen carefully [61–65]. Exper-
                                                             imentally obtained crystallographic parameters were re-
we can have an estimate of the optical band gap[59],
                                                             fined by Rietveld method and their geometry was opti-
                                                             mized prior to using them for DFT calculations. PDOS,
                            (1 – R)2                         electronic band structure and Optical absorption spec-
                   F(R) =            .                (1)    tra of both BFO bulk and BFO 160 nanoparticles were
                               2R
                                                             obtained via DFT calculations using GGA-PBE func-
The band gap of the materials can be calculated by           tionals. While performing DFT calculations, U value
forming the Tauc plot using the following equation [59],     was varied from 3.0 eV to 7.0 eV at 0.5 eV interval.
                                                             DFT calculated absorption spectra closely match the
                F(R)∗ hν = A(hν – Eg )n ,             (2)    experimentally obtained ones for U = 4.5 eV and there-
                                                             fore, further observations were carried out for this value
   where, hν, A, and Eg denote the energy of photons,        of U. As we can observe from the PDOS spectra (Fig.
constant of proportionality, and optical band gap, re-       7(a) and 7(b)) of both BFO bulk and BFO 160, conduc-
spectively. n is a number that takes the value of 1/2        tion band minima(CBM) is dominated by 3d orbital of
and 2 for direct and indirect transitions, respectively.     Fe atoms and 2p orbital of oxygen atoms dominate the
Since, BFO is widely regarded as a material with direct      valence band maxima(VBM). We can infer from this
band gap, we have considered n=2 and obtained the            observation that the electron transitions from VBM to
Tauc plots accordingly as shown in Fig. 6.                   CBM can be attributed to these two orbitals and there
          Fig. 6 displays [F(R) ∗ hν]2 vs hν curves for      are no major d-d transitions involved. From the elec-
optical band gap calculation of BFO bulk materials           tronic band structures as shown in Fig. 7(c) and 7(d),
and nanoparticles hydrothermally synthesized at dif-         VBM lies between Z and L point for BFO bulk and
ferent reaction temperatures. Extrapolating the linear       BFO 160 nanoparticles and hence the calculated direct
region of the curve to the energy axis, we can deter-        band gap for both materials found to be 2.1 eV. Since,
mine the band gap. Optical band gap for bulk BFO             transition from 2p orbital of oxygen atoms to 3d or-
material is found to be 2.1 eV. For hydrothermally pre-      bitals of Fe atoms is allowed and direct, our use of n
pared nanoparticles at reactions temperatures 200 ◦ C,       = 2 in the formation of Tauc plot from experimentally
180 ◦ C and 160 ◦ C, the direct band gaps are 2.05 eV,       obtained absorption coefficients is justified. Fig. 7 (e)
2.11 eV and 2.1 eV, respectively. This energy band gap       shows the theoretical optical absorption coefficients of
is consistent with value reported in Ref. [20, 60]. How-     BFO bulk and BFO 160 obtained from our DFT cal-
ever, in those investigations, nanoparticles were pro-       culation. These absorption spectra were transformed
duced at considerably higher annealing temperatures.         into Tauc plots as shown in Fig. 7 (f) and tangents
The small band gap exhibited by synthesized BFO bulk         were drawn to the linear region of the plot. Extrapo-
and nanoparticles indicates their potential as good pho-     lating the tangent to the energy axis, optical band gap
11
of the corresponding material was found from the en- periment. Moreover, the optical band gap of the par-
ergy axis intercept. As observed from Fig. 7 (f), both ticles was 2.1 eV which is also consistent with that of
BFO bulk and BFO 160 exhibit the same direct optical the nanoparticles synthesized in the present investiga-
band gap of 2.1 eV. These theoretically calculated val- tion. However, in Ref. [[67]] it was observed that only
ues are in excellent agreement with the ones experimen- 40% of RhB was decomposed after 4 h visible-light ir-
tally determined (2.1 eV for both BFO bulk and BFO radiation. Though the band gap of the BFO particles
160). With this agreement between theoretical and ex- synthesized both in Ref. [[67]] and in our investigation
perimental calculation, we can conclude that there has was same, however, the photoctalytic dye degradation
been no significant change in the optical band gap for is much higher while BFO 160 nanoparticles are used
BFO bulk and nanoparticles. as photocatalysts. In another recent investigation [68],
the photocatalytic activity of BFO nanoparticles with a
particle size of 40 nm was evaluated by photocatalytic
F. Photocatalytic activity decomposition of RhB in aqueous solution under visi-
ble light irradiation. It is observed that the pure BFO
The photocatalytic performance of the fabricated ma- photocatalyst could decompose 22.3% of RhB after 270
terials was studied extensively through degradation of min visible light irradiation.
the typical organic contaminant Rhodamine-B (RhB) The photodegradation of BFO 160 nanoparti-
under visible light illumination [66] at λ ≥ 420 nm. Fig. cles is much higher compared to that of other materials
8 (a) shows how intensity of the absorbance peak of RhB in particular commercially available Degussa P25 tita-
for BFO 160 nanoparticles typically varies under visible- nia nanoparticles and BFO bulk materials. For compar-
light irradiation. The absorbance peak corresponding ison, the photodegradation efficiency of BFO 140 and
to RhB decreases gradually with increasing time, im- BFO 120 materials was also evaluted under the same
plying that RhB has been decomposed by BFO. Due to experimental condition. The degradation efficiency was
the well known fact that RhB dye shows a general resis- found to 53 % and 42 % for using BFO 140 and BFO 120
tance to decomposition, the implication of the results is particles, respectively. Our investigation clearly demon-
that the photocatalytic activity of BFO nanoparticles is strated that the photocatalytic activity of BFO 160
quite efficient and hence indicates the promise as visible nanoparticles for photocatalytic decomposition of RhB
light photocatalysts for BFO nanoparticles. in aqueous solution under visible light irradiation is
For evaluating the efficiency of degradation of higher compared than that of other materials under in-
RhB, the maximum intensity ratio C/C0 is plotted in vestigation. The enhanced photodegradation efficiency
Fig. 8 (b), in which C0 and C are the maximum ini- of BFO 160 nanoparticles might have resulted from the
tial intensity (0 h) and maximum intensity at a specific reduced particle size with excellent crystallinity. Look-
time (1-4 h) respectively for the absorption spectra of ing at the SEM image, Fig. 2 (e-f), significantly greater
RhB under stimulated sunlight irradiation. A blank surface area of the BFO 160 nanoparticles can be at-
test is evaluated for RhB (Fig. 8 (b)) and it exhibits a tributed to the higher photodegradation efficiency. It
negligible degradation efficiency which clearly shows a should also be noted that compared to commercially
nominal self-degradation potential of RhB. For exam- available photocatalyst TiO2 , that responds only to UV
ple, after 4 hours of irradiation without BFO materials, irradiation, BFO nanoparticles are more advantageous
RhB was degraded by less than 3%, whereas the bulk as they make use of the visible portion of the spectrum.
BFO photocatalyst could decompose 56% of RhB af- For quantitative investigation of the rate of
ter 4 h irradiation. Notably, when hydrothermally pre- degradation, the experimental data were fitted adapt-
pared nanoparticles were used as photocatalysts, the ing a first-order model as elucidated by the following
degradation efficiency was increased to 59 % and 61 % equation, ln(C0 /C) = kt [69], where C0 and C denote
for nanoparticles prepared at 200 ◦ C and 180 ◦ C hy- the respective concentrations of RhB at distinct irra-
drothermal reaction temperatures. Interestingly, RhB diation times of t0 and t, k is the first-order rate con-
photodegradation attains a significant improvement in stant and can be regarded as a basic kinetic parameter
efficiency to 79 % for BFO 160 nanoparticles which were for a number of different photocatalysts. For the pho-
prepared at 160 ◦ C reaction temperature. todegradation of RhB, the pseudo-first order kinetics
In a similar investigation BiFeO3 particles with fitting data has been shown in Fig. 8 (c). The cor-
the size of 100-150 nm were synthesized at the tempera- responding reaction rate constant (k) values were cal-
ture as low as 120 ◦ C via a urea-assisted hydrothermal culated to be 7.66 x 10⁻³ , 2.27 x 10⁻¹ , 2.47 x 10⁻¹ ,
process [67]. Their photocatalytic activity was evalu- 2.72 x 10⁻¹ , and 3.23 x 10⁻¹ min–1 for the blank sam-
ated by the degradation of RhB in aqueous solution ple, bulk BFO, hydrothermally prepared nanoparticles
under visible-light irradiation using a 500 W Xe lamp at reaction temperatures 200 ◦ C, 180 ◦ C and 160 ◦ C,
with a cutoff filter (λ ≥ 420 nm). The condition for respectively. Among them, the BFO 160 nanoparticles
photocatalytic experiment was same as that of our ex- exhibited the highest k value, which is 1.42 times higher12 Figure 7. DFT calculated PDOS spectra of (a) BFO bulk and (b) BFO 160; band structures of (c) BFO bulk and (d) BFO 160; DFT calculated absorption spectra of (e) BFO bulk and BFO 160; (f) plot of DFT calculated (αhν)2 vs. hν for BFO bulk and BFO 160.
13

Figure 8. (a) Absorption spectra of rhodamine B (RhB) under visible-light irradiation in the presence of BFO nanoparticles
prepared at 160 ◦ C hydrothermal reaction temperature. (b) Photocatalytic degradation of RhB as a function of the visible
light irradiation time for blank sample, Degussa P25 titania, BFO bulk material and hydrothermally prepared nanoparticles
at reaction temperatures 200 ◦ C, 180 ◦ C and 160 ◦ C. (c) Pseudo-first order kinetics fitting data for the photodegradation of
RhB. (d) Volume of H2 evolution as a function of irradiation time during the photocatalytic splitting of water. (e) Schematic
illustration of RhB degradation and water splitting mechanism using BFO nanoparticles as catalysts under visible light
irradiation.
14

                                                                        H.   Photocatalytic Mechanism
Table II. Calculated band gap energy (Eg ), rate constant
(K), and degradation efficiency of BFO bulk and hydrother-
mally prepared nanoparticles.                                   The photocatalytic performance under visible light
     Sample        Eg      Rate constant   Degradation       irradiation depends on a number of parameters cooper-
                                                             ating with each other ultimately ameliorating the pho-
                   in eV   (K) x 10 –1     (%) after 4 h
                                                             tocatalytic performance. Fig. 8 (e) schematically illus-
     BFO Bulk      2.1     2.27            56                trates degradation of RhB and water splitting mecha-
              ◦
     BFO (200 C) 2.05      2.47            59                nism using BFO nanoparticles under visible light irra-
     BFO (180 ◦ C) 2.11    2.72            61                diation [5].
     BFO (160 ◦ C) 2.1     3.23            71                          Photocatalysis is an electrochemical process
                                                             that involves the transfer of the photogenerated elec-
                                                             trons and holes between a semiconductor and an elec-
                                                             trolyte. The semiconductor in this investigation is BFO,
than that of bulk BFO. Notably, BFO 160 nanoparti-           and the electrolyte is the RhB solution. When the BFO
cles were subject to recyclability test under the same       nanoparticles are dispersed in the RhB solution under
test conditions. The test result indicates excellent sta-    visible light irradiation, the electrons in their valence
bility of these nanoparticles after 4 cycles.                band are excited to the conduction band by absorbing
                                                             the photons of the visible light. This transition creates
                                                             holes in the valence band of BFO. On the other hand, an
                                                             electrolyte in equilibrium has one or more redox couples
                                                             with specific redox potentials. If the potential of the
                                                             photogenerated electrons in a semiconductor is lower
       G.     Photocatalytic Hydrogen Production
                                                             than any of these redox couples, the electrons will flow
                                                             into the electrolyte to perform reduction of that couple.
   Now, we have examined the potential of BFO mate-          Similarly, if the potential of the photogenerated holes
rials for hydrogen generation via water splitting under      of the semiconductor is higher than a redox couple, the
visible light irradiation [4]. No hydrogen evolution could   holes will flow into the electrolyte to oxidize it. The re-
be detected when a blank experiment without any pho-         duced and oxidized species can initiate further reactions
tocatalyst was performed in dark conditions. Fig. 8 (d)      that are responsible for degrading the electrolyte. Be-
shows the hydrogen evolution rate of BFO bulk material       sides determining the potentials of the conduction band
as well as hydrothermally prepared BFO 160 nanopar-          minima (CBM) and valence band maxima (VBM) of
ticles in mL H2 /g catalyst plotted against visible light    BFO, we need to investigate the redox potentials of the
irradiation time in hours (h). For comparison, we have       redox couples that dictate the degradation of RhB to
inserted in Fig. 8 (d) the hydrogen production rate of       learn about the photocatalytic mechanism behind the
commercially available Degussa P25 titania nanopar-          degradation of RhB. The potentials of CBM and VBM
ticles. The outcome of our investigation demonstrates        of BFO have been determined to be 0.3 V and 2.4 V
that BFO 160 nanoparticles prepared hydrothermally at        respectively using the absolute electronegativity theory
reaction temperatures 160 ◦ C generate nearly two times      by Nethercot and Butl and et al. [70, 71].
hydrogen compared to that of bulk BFO material after 4                 The degradation of RhB dye depends primar-
h of illumination. Compared to commercially available        ily on two critical redox reactions. First, the photo-
TiO2 , the production rate of BFO 160 nanoparticles is       generated electron can react with the surface adsorbed
more than double after 4 h of illumination. In a separate    O2 (redox potential: -0.16 V vs. NHE) to form O–2 ,
investigation [13], BFO nanoparticles as photocatalyst       which will further react with RhB to cause degrada-
were also used for solar hydrogen generation from water      tion [72, 73]. Second, the photogenerated holes can re-
and the production rate after 4 h illumination is equiv-     act with the OH– ionized from the water molecules to
alent with that of our investigation. But here the note-     produce ·OH (redox potential: 2.38 V vs. NHE). This
worthy point is that, in Ref. [[13]], the nanoparticles of   ·OH can further oxidize the RhB molecules. There-
size 50-60 nm were produced at comparatively high tem-       fore, a photocatalyst needs to possess a CBM 2.38 V to drive
used for hydrogen production in Ref. [[13]] was subject      the second one efficiently. Therefore, only the photo-
to annealing at 600 ◦ C for 2 hours in N2 atmosphere.        generated holes are capable of performing the second
Whereas in the present investigation a facile, low cost      reaction. However, when photons with energy higher
hydrothermal process has been used for fabrication of        than 2.56 eV are incident on BFO nanoparticles, the
nanoparticles and the reaction temperature was only          electrons in their valence band can be excited to the
160 ◦ C which ensures the less energy consumption.           higher states of the conduction band where their po-
15
tential can be more negative than -0.16 V. These pho- BFO nanoparticles, especially for BFO 160 with small-
togenerated electrons will be able to perform the first est particle sizes as evident from our experimental val-
reaction. Since BFO can absorb visible light photons ues. The BFO 160 nanoparticles, assumed to be cre-
with energies higher than 2.56 eV, both these reactions ating electrical field in the surrounding medium, im-
can contribute to the degradation of RhB [74]. In ad- proves redox reactions along with the adsorption of dye
dition, RhB self-photoexcitation may also play a role molecules, especially polar molecules such as water on
in assisting the photodegradation process. The RhB the photocatalyst surface. This adsorption helps the
molecules can absorb the visible range photons to reach redox reactions to commence easily as the carrier trans-
an excited state of a potential of -1.09 V [75]. Since port is now relatively easier. Furthermore, it is antici-
the potential of electrons in this state is more negative pated that ferroelectrics can create channels to transfer
than the CBM of BFO nanoparticles, the electrons of the charge carriers to the surface of photocatalyst and
the photoexcited state will be transferred to the con- significantly reduce the recombination probabilities as
duction band of BFO. However, these electrons cannot the photogenerated electron-hole pairs are driven to op-
participate in the photocatalytic degradation process posite directions by the electric field they possess.
as they cannot reduce O2 to O–2 . Consequently, these
electrons will be accumulated in the conduction band
of BFO and the transfer of electrons from the photoex- IV. CONCLUSIONS
cited state of RhB will stop when both states reach the
same potential. Hence, the self-photoexcitation of RhB
may not have a significant effect on the photocatalytic We have produced single-phase, well crystalline
degradation of RhB. BiFeO3 nanoparticles with favorable morphology using
a facile, low cost hydrothermal process at reaction tem-
It is well known that the size of the particles
perature as low as 160 ◦ C. The experimentally observed
and surface area significantly effect the enhancement
band gap (2.1 eV) was almost equal for both bulk and
of the photocatalytic degradation. In our investiga-
all nanoparticles prepared at different reaction temper-
tion, the degradation of RhB with BFO 160 nanoparti-
atures and was well consistent with value obtained from
cles is considerably greater than that of bulk BFO ow-
the first principles calculation. However, the BFO 160
ing to their smaller size and higher surface area. The
nanoparticles prepared at temperature 160 ◦ C demon-
band gap is another important parameter as the low
strated much higher photocatalytic activity compared
band gap of photocatalysts might increase the photo-
to the photocatalytic performance showed by bulk BFO
catalytic activities [76]. We observed that the band gap
and other nanoparticles. The enhanced photocatalytic
is almost same (2.1 eV) for nanoparticles prepared at
activities of BFO 160 nanoparticles may be associated
all hydrothermal reaction temperatures as well as the
with their crystallinity, phase purity, excellent morphol-
bulk BFO. While sunlight hits the photocatalyst, pho-
ogy, higher surface to volume ratio, and the efficient sep-
tons possessing greater energy than the optical band
aration and migration of photogenerated charge carri-
gap of the photocatalyst cause stronger light absorp-
ers. As efficient photocatalyst, the synthesized BFO 160
tion. The estimated band gap 2.1 eV for both BFO
nanoparticles generated more than two times of solar
bulk and nanoparticles implied that light with λ less
hydrogen via water splitting than that of bulk BiFeO3
than 590 nm could be absorbed by e– to jump from va-
as well as commercially available Degussa P25 titania.
lence band (VB) to conduction band (CB) which covers
The outcome of this investigation also demonstrated an
a broad region of the solar energy spectrum. With all
improved multiferroic properties of technologically im-
the materials under scrutiny having almost equal band
portant BiFeO3 nanoparticles prepared at temperature
gap, the other factors prove to be more important for
as low as 160 ◦ C which is cost effective with less en-
achieving higher photocatalytic efficiency of BFO 160
ergy consumption. BiFeO3 nano-structured particles
nanoparticles rather than band gap itself.
prepared through this investigation have shown a great
It was mentioned already in introduction sec- promise in enhancing the production of solar H2 , a car-
tion that, BFO is an well known multiferroic materials. bon free fuel, using two important renewable sources:
It is evident that the ferroelectric property of a ma- water and solar energy.
terial enhances its ability to decolorize Rhodamine-B,
a typical dye molecule, while irradiated by solar light
[77]. Ferroelectric materials have a spontaneous polar-
ization that is caused by the non-centrosymmetry of the V. ACKNOWLEDGEMENTS
crystal structure. As nanoparticles are more strained
than their bulk counterparts, their crystal structures This work was financially supported by Ministry of
deviate from the bulk structure and give rise to even Education, Government of Bangladesh (Grant No. PS
greater non-centrosymmetry for BFO. This essentially 14267) and the Infrastructure Development Company
increases the magnitude of spontaneous polarization of Limited (IDCOL), Dhaka, Bangladesh.16
VI. APPENDIX A. SUPPLEMENTARY DATA VII. DATA AVAILABILITY
The raw and processed data required to reproduce
Supplementary data to this article can be found on- these findings cannot be shared at this time due to tech-
line. nical or time limitations.
[1] R. Guo, L. Fang, W. Dong, F. Zheng, M. Shen, J. Phys. 2014, 6, 14336.
Chemi. C, 2013, 114, 21390-21396. [24] N. Das, R. Majumdar, A. Sen, H.S. Maiti, Mater. Lett.,
[2] J. Shi, L. Guo, Progress in Natural Science: Materials 2007, 61, 2100.
International, 2012, 22, 592. [25] K K. Sridhar, M.V. C., L.Q. H., R. Rustum, A. F.,J.
[3] B. Wang, C. Li, D. Hirabayashi, K. Suzuki, Interna- Am. Ceram. Soci.,1996, 79, 1409-1412.
tional Journal of Hydrogen Energy, 2010, 35, 3306-3312. [26] T.T. Carvalho, P.B. TavaresMater. Lett., 2008, 62,
[4] Kang-Qiang Lu, Xin Xin, Nan Zhang, Zi-Rong Tang 3984.
and Yi-Jun Xu, J. Mater. Chem. A, 2018, 6, 4590-4604. [27] S.H. Han, K.S. Kim, H.G. Kim, H.-G. Lee, H.-W. Kang,
[5] Lan Yuana, Chuang Hana, Min-Quan Yanga, and Yi- J.S. Kim, C.I. Cheon, Ceram. Int. 2010, 36, 1365.
Jun Xu, International Reviews in Physical Chemistry, [28] S. Li, Y.-H. Lin, B.-P. Zhang, Y. Wang, C.-W. Nan, J.
2016, 35 (1), 1-36. Phys. Chem. C, 2010, 114, 2903-2908.
[6] Nan Zhang, Min-Quan Yang, Siqi Liu, Yugang Sun, and [29] Y. Wang,G. Xu, Z. Ren, X. Wei, W. Weng, P. Du, G.
Yi-Jun Xu, Chem. Rev. 2015, 115, 10307-10377. Shen andG. Han, Ceram. Int. 2008, 34, 1569.
[7] F. Wang, T. Shen, Z. Fu, Y. Lu, C. Chen, Nanotech- [30] M.A. Basith, O. Kurni, M.S. Alam, B.L. Sinha, B. Ah-
nology, 2018, 29, 035702 mmad, J. App. Phys. 2014, 115, 024102.
[8] A. Fujishima, K. Honda, Nature, 1972, 238, 37-38. [31] S.S. Chowdhury, A.H.M. Kamal, R. Hossain, M. Hasan,
[9] A.A. Nada, M.H. Barakat, H.A. Hamed, N.R. Mo- M.F. Islam, B. Ahmmad, M.A. Basith, Ceram. Int.
hamed, T.N. Veziroglu, Int. J. Hydrog. Energy, 2005, 2017, 43, 9191.
30, 687-691. [32] R.G. Freitas, F.W.S. Lucas, M.A. Santanna, R.A.
[10] Y. Liu, L. Xie, Y. Li, R. Yang, J. Qu, Y. Li, X. Li, J. Mendes, A.J. Terezo, G.L.C. de Souza, L.H. Mascaro,
Power Sources, 2008, 183, 701. E.C. Pereira, Phys. Chem. Chem. Phys., 2016, 18,
[11] D. Jian, P.-X. Gao, W. Cai, B.S. Allimi, S. Pamir Alpay, 26885.
Y. Ding, Z.L. Wang, C. Brooks, J. Mater. Chem., 2009, [33] J. Clark Stewart, D. Segall Matthew, J. Pickard Chris,
19, 970. J. Hasnip Phil, I.J. Probert Matt, K. Refson, C. Payne
[12] H. Park, W. Choi, M.R. Hoffmann, J. Mater. Chem., Mike, Crystalline Materials, 2005, 220, 567.
2008, 18, 2379. [34] B. Himmetoglu, A. Floris, S. Gironcoli and M. Cococ-
[13] J. Deng, S. Banerjee, S. K. Mohapatra, Y. R. Smith, cioni, Int. J. Quant. Chemi., 2014 114, 14-49.
and M. Misra, J. Fundam. Renewable Eng. Applica- [35] G. Kresse, D. Joubert, Phys. Rev. B, 1999, 59, 1758.
tions, 2011, 1, 10. [36] M. Tamer, AIP Adv., 2016, 6, 065115.
[14] T. Choi, S. Lee, Y.J. Choi, V. Kiryukhin, S.-W. [37] X.D. Zhang, M.L. Guo, W.X. Li, C.L. Liu, J. App.
Cheong, Science, 2009, 324, 63-66. Phys. 2008, 103, 063721.
[15] A.B. Murphy, P.R.F. Barnes, L.K. Randeniya, I.C. [38] N. Serpone, D. Lawless, R. Khairutdinov,J. Phys.
Plumb, I.E. Grey, M.D. Horne, J.A. Glasscock, Int. J. Chemi., 1995, 99, 16646-16654.
Hydrog. Energy, 2006, 31, 1999. [39] Gao N, Quan C, Ma Y, Han Y, Wu Z, Mao W, Zhang J,
[16] F.E. Osterloh, Chem. Mater, 2008, 20, 35-54. Yang J, Li X a and Huang W 2016 Phys. B: Condens.
[17] K. Rajeshwar , R. McConnell and S. Licht, Springer: Matt. 481 45.
New York, 2008. [40] C. Regmi ,D. Dhakal, T-H. Kim, T. Yamaguchi and S.
[18] Y. Yang, I.C. Infante, B. Dkhil, L. Bellaiche, Comptes W. Lee, Nanotechnology, 2018, 29, 154001.
Rendus Physique , 2015, 16, 193. [41] J. Rodriguez-Carvajal , Book of Abstracts Toulouse
[19] J. Schneider, M. Matsuoka, M. Takeuchi, J. Zhang, Y. France, 1990, 127.
Horiuchi, M. Anpo, D.W. Bahnemann, Chemi. Rev., [42] Supplemental information: Rietveld Refined structural
2014, 114, 9919-9986. parameters and phases present (in wt%) obtained from
[20] F. Gao X. Y. Chen K. B. Yin S. Dong Z. F. Ren F. XRD analysis
Yuan T. Yu Z. G. Zou J.-M. Liu, Adv. Mater., 2007, [43] J.-P. Zhou, R.-L. Yang, R.-J. Xiao, X.-M. Chen, C.-Y.
19, 2889. Deng, Mater. Res. Bull., 2012, 47, 3630-3636.
[21] C.C. Moo, N.J. Hong, C. In-Sun, A. Jae-Sul, H.K. Sun, [44] S. Er-Wei, X. Chang-Tai, Z. Wei-Zhou, W. Bu-Guo, F.
K.J. Young, J. Am. Ceram. Soc., 2008, 91, 3753. Chu-De, J. Am. Ceram. Soc., 1997, 80, 1567.
[22] G. Sushmita, D. Subrata, S. Amarnath, S.M. Himadri, [45] S. Han and C. S. Kim, J. App. Phys. 2013, 113, 17D92.
J. Am. Ceram Soc., 2005, 88, 1349. [46] R. Das, S. Sharma, K. Mandal, J. Magn. Magn. Mater.,
[23] M.A. Basith, D.T. Ngo, A. Quader, M.A. Rahman, B.L. 2016, 401, 129-137.
Sinha, B. Ahmmad, F. Hirose, K. Molhave, Nanoscale,You can also read