Look Forward A World in Disruption - Volume 1 | January 2023 - S&P Global
←
→
Page content transcription
If your browser does not render page correctly, please read the page content below

Look Forward
A World in Disruption
Volume 1 | January 2023

T
                                      he world has reached a unique
                                      moment. In my 40-plus years
                                      in business, I’ve never seen a
                                      time quite like the one we’re
                                      living through now.

                                       This is a period marked by
                                       uncertainty. Households,
                                       the private sector and
                                       governments around the globe
              face an energy security crisis and climate change,
              food shortages, high inflation, ongoing supply chain
              challenges, volatility in financial markets and a host of
              geopolitical risks.

              In this first issue of Look Forward, our economists,
              analysts, researchers and data experts survey the current state of affairs and connect the
              dots to explain what it all means in an era of instability. The purpose of Look Forward is to help
              decision-makers in asset managers, asset owners, companies, multilateral institutions, nonprofit
              organizations and governments look beyond the near term and explore the trends that will
              shape our future.

              Readers will benefit from the smart analysis of our cross-divisional Research Council at S&P Global,
              which produced this journal. The Council has identified six interconnected themes with the greatest
              potential for large-scale disruption well into the future.

              The Council’s critical work, as you will read, is focused on energy security, climate and
              sustainability, technology and digital disruptions, supply chains, capital markets and geopolitical
              shocks. We have unique datasets and insights in all these areas, and we see the Research Council
              as a way to make sure that our insights deliver maximum impact to our customers and the markets.

              In this age of turbulence and change, the following articles are designed to help navigate
              the path ahead.

                                                                                Douglas L. Peterson
                                                                                President and CEO, S&P Global

2 Look Forward Journal                                                                                               January 2023
A World in Disruption
In the last few years, it has seemed as if the world is spinning ever faster.

A global pandemic. A land war in Eastern Europe and increasing superpower tensions. More frequent and catastrophic weather
events. Runaway inflation, stock markets falling and cryptocurrencies collapsing, with global debt reaching record levels.
A worldwide energy crisis amid the ongoing energy transition. Soaring commodities prices and jammed supply chains.

The disruptions at play are reshaping the global economy, capital markets and geopolitical order for the long term. Both
challenges and opportunities will emerge from this period of profound transformation. That’s why we have asked some of
our most experienced research leaders to pause, reflect and look forward to 2030 to help you understand the forces that
are disrupting the world and creating the future. This journal, the inaugural edition of S&P Global’s Look Forward series, is
the result. Guided by S&P Global’s Research Council, these authors have drawn on their deep expertise, insights and data to
examine subjects as diverse as physical climate risk, the end of the “cheap-money” era, a nearly $25 trillion funding gap to
meet Paris Agreement decarbonization goals and the emergence of a new style of leadership powered by female CEOs.

This is not a forecasting exercise, but six key themes emerge: The energy transition is gaining speed but is still not proceeding
fast enough to meet Paris climate targets. Investments in adaptation need to step up to protect wealth and lives from rising
physical risks from climate change. The end of the era of extremely low interest rates will lead to structural changes in the
economy. The world has more debt than ever before, and policymakers will need to make trade-offs to limit the risks of a debt
crisis. New forms of pragmatic cooperation might emerge, where countries cooperate across spheres of mutual interest while
contesting across spheres of national interest. The world is moving from the oil age to an era of batteries and electrification
amid the electric vehicle and digital revolutions, leading to a commodity supercycle.

And, centrally, the next eight years will demonstrate once again the truth of the Chinese proverb: “Chaos equals opportunity.”
A world in disruption is one of not only heightened risk, but also expanding opportunities. The articles in this journal
are intended to help you take advantage of those opportunities. We hope you find it valuable and we look forward to
hearing your feedback.

With great anticipation,                             Key Research Themes

Alexandra Dimitrijevic
Global Head of Research &
Development, S&P Global Ratings
Co-chair, S&P Global Research Council                                                            1 Sustainability & Climate
alexandra.dimitrijevic@spglobal.com
                                                                                                 2 Trade, Resources & Supply Chains
Atul Arya
Chief Energy Strategist,                                                                         3 Geopolitical Shocks
S&P Global Commodity Insights
Co-chair, S&P Global Research Council                                                            4 Future of Capital Markets
atul.arya@spglobal.com
                                                                                                 5 Digital Disruption

                                                                                                 6 Balancing Energy Security
                                                                                                   & Energy Transition

3 Look Forward Journal                                                                                                  January 2023
Contents
Geopolitical Shocks Future of Capital Markets
A Pragmatic World (Re)order 5 Global Debt Leverage: Is a Great Reset Coming? 24
To meet the crosscutting challenges defining Rising rates and slowing economies mean the world’s
the years ahead, a new pragmatism will emerge. high leverage poses a crisis risk.
Future of Capital Markets Sustainability & Climate
The End of Lower for Longer: A Post-COVID 8 Crunch Time: Can Adaptation Finance 29
Silver Lining? Protect Against the Worst Impacts From
Structural changes to the global economy suggest Physical Climate Risks?
higher prices and rates ahead. Investments in adaptation must close the gap with
mitigation financing to avoid the worst outcomes.
Balancing Energy Security & Energy Transition Trade, Resources & Supply Chains
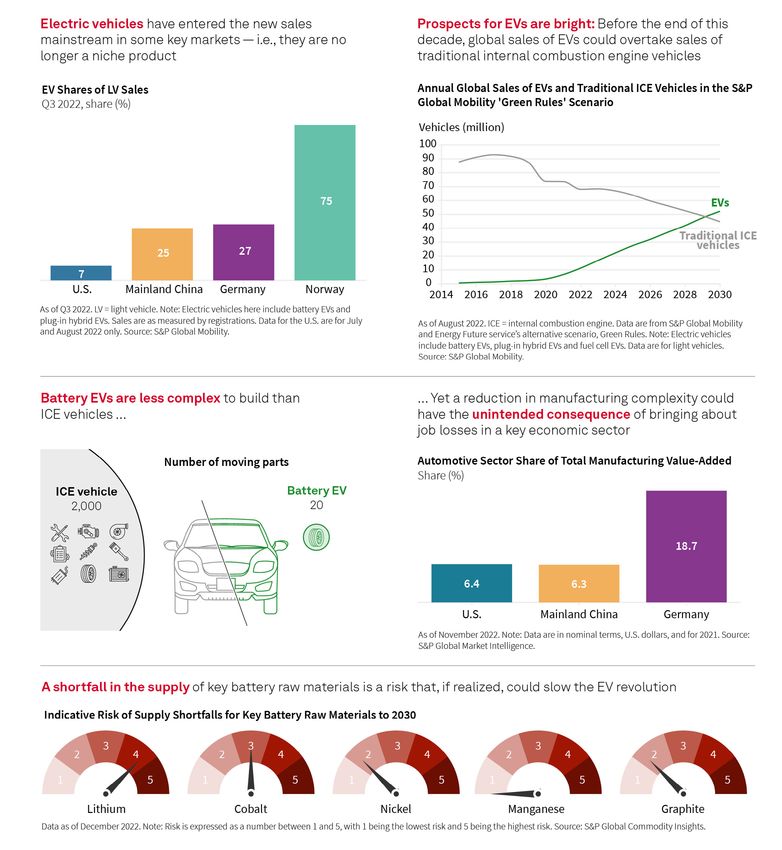
Energy Transition: Gaps in the Pathways 12 The EV Revolution – Moving From Oil Age to 35
Despite current economic and geopolitical crises, the Battery Age?
energy transition is accelerating — but not fast enough Few stakeholders will be shielded from the transformation
to meet Paris Agreement climate goals. of the automotive ecosystem.
Trade, Resources & Supply Chains Trade, Resources & Supply Chains
The World Isn’t in a Commodity Supercycle, 17 Risk Will Define Supply Chains for Years To Come 39
but It Should Be Although the greatest disruption to containerized
A brutal series of shocks has left markets ill-prepared shipping supply chains since the dawn of the container
for the challenges of the future. era has begun to ease, risks remain high.
Sustainability & Climate Digital Disruption
Women CEOs Model a Diverse Future 21 Toward a Tokenized Future 42
Women’s leadership styles position them well Digitization will improve efficiency and open new
to guide organizations through the profound markets — but the revolution won’t happen overnight.
transformations ahead.
4 Look Forward Journal January 2023
Geopolitical Shocks

A Pragmatic                                                                                      Highlights

World (Re)order
                                                                                                 The next decade will be a period
                                                                                                 of disequilibrium.

                                                                                                 A set of interlinked challenges will
                                                                                                 define the years ahead: climate
To meet the crosscutting challenges defining the                                                 change, making the energy
years ahead, a new pragmatism will emerge.                                                       transition, technological guardrails
                                                                                                 and cybersecurity, pandemics,
                                                                                                 and inequities.
Dr. Lindsay Newman
Executive Director, Head of Geopolitical Thought Leadership,                                     We expect countries to meet these
S&P Global Market Intelligence                                                                   challenges with a new pragmatism,
lindsay.newman@spglobal.com                                                                      in which they cooperate across
                                                                                                 spheres of mutual interest and
                                                                                                 simultaneously contest across

A
                                                         We expect countries to meet             spheres of national interest.
        world ordered for decades by                     these challenges by adopting
        globalization and geo-economics                  a new pragmatism: cooperating
                                                         across spheres of mutual
        has of late become a world
                                                         interest (energy transition agendas,
oriented around geopolitics. Shocks                      pandemic preparedness, humanitarian partnerships)
initially thought to be time limited,                    while concurrently contesting across spheres of
from the COVID-19 pandemic to the                        national interest (economic policy, industrial strategy,
conflict in Ukraine, have proven more                    critical technologies and resources, supply chain
                                                         security). Already, we see countries negotiating
lasting and pervasive. Some say we                       economic partnerships while one partner maintains
have already landed somewhere new                        trade relations with a third, sanctioned country. We
— in a fragmented world where the                        also see a renewed nonaligned movement that is
U.S. has lost its global footing and                     possible and intentional.
China is steadily gaining ground.
                                                         For the remainder of this decade,
Entering 2023, we believe that we have not yet
reached a new horizon. By 2030, we may have visibility
                                                         we are unlikely to find solid
into the international order taking shape. But for       ground in one equilibrium
the remainder of this decade, we are unlikely to find
solid ground in one equilibrium or another — whether     or another; instead, a set of
unipolar, bipolar, multipolar or a vacuum.
                                                         crosscutting challenges will
Instead, a set of crosscutting challenges will define    define the years ahead.
the years ahead. These tests are interlinked and
borderless: climate change, the energy transition,
technological guardrails and cybersecurity,
pandemics, and inequities. No country will be able
to solve these challenges alone, and no country can
solve these challenges for all.

5 Look Forward Journal                                                                                                January 2023
Geopolitical Shocks

India’s Global Role

Perhaps no country reflects that arising pragmatism better than
India, which, according to S&P Global Market Intelligence data, is
projected to become the third-largest contributor to global real
gross domestic product growth over the next decade, behind only
China and the U.S.

India sits alongside the U.S., Japan and Australia in the Quadrilateral
Security Dialogue (Quad), a partnership committed to advancing “a
free and open Indo-Pacific.” Formed after the 2004 Indian Ocean
tsunami as a humanitarian and loosely based security partnership,
the Quad framework now covers a range of shared challenges,
including health security, maritime data-sharing and working
groups on climate change, supply chains and advanced technology.
India is also a partner in the Indo-Pacific Economic Framework for
Prosperity, launched in 2022 by the U.S. and 12 other countries
representing 40% of the world’s GDP, and dedicated to building a
connected, resilient, clean and fair economy.

Yet, even as India partners with the U.S. (and others) on these
multidimensional initiatives, it also maintains economic and
trade ties elsewhere, including with strategic competitors of
the U.S. According to S&P Global’s Global Trade Analytics Suite,
in late 2022, China remained India’s third-largest export market
by value, and by far its largest supplier of imported goods.
Even more indicative of current geopolitical dynamics is India’s
positioning during the Russia-Ukraine conflict. According to
S&P Global’s Commodities at Sea database, as European markets
imposed sanctions and sought to disengage from Russian energy
resources, India became the second-largest recipient of Russian
crude oil in 2022. The previous year, India did not represent a
top 10 export market for Russian crude oil. While Indian Prime
Minister Narendra Modi cautioned Russian President Vladimir
Putin in September 2022 that “today’s era is not an era of war,”
according to S&P Global’s available trade data, that sentiment
had only a marginal impact on India’s Russian crude imports.

As the demand for oil defined
geopolitics in the 20th century, the
scramble to secure minerals critical
for the energy transition is likely to
shape geopolitics in the 21st century.

6 Look Forward Journal                                                           January 2023
Geopolitical Shocks
New Pragmatism at Work
This form of expedient engagement, of collaborating on communal challenges while competing in the
national interest, is not only an India story. Turkey, a U.S. ally through NATO, is also a purchaser of the
Russian-manufactured S-400 missile system, for which the U.S. imposed sanctions on the Republic
of Turkey’s Presidency of Defense Industries. South Africa is a member of the Just Energy Transition
Partnership with the EU, U.K. and U.S., which aims to support the country’s decarbonization efforts,
even as it remained a leading exporter of coal in 2022, including to its BRICS partners India and
(less so) China.
As the demand for oil defined geopolitics in the 20th century, the scramble to secure minerals critical
for the energy transition is likely to shape geopolitics in the 21st century, leaving countries working
side by side to contain a changing climate while leveraging protectionism and localization. The U.S.
approach is telling. On the global stage it launched the multilateral Minerals Security Partnership
in 2022 in recognition of the role critical minerals will play in “our shared future.” At home, however,
recent administrations have prioritized securing a “Made in America” supply chain for critical
minerals, labeling overreliance on “foreign sources and adversarial nations” for critical minerals as
national and economic security threats.
In this landscape, pressure points in one part of the world create ripples globally, with vast
commercial impact. This decade has brought trade wars, sanctions expansion, de-dollarization
debates, supply chain disruptions, resource protectionism and labor market reshuffling. As the world
navigates toward a new equilibrium, it will be pragmatism, if anything, that defines the interregnum.
Chart 1
Commercial Impacts of the
Geopolitical Landscape
Learn more
A world rebalancing
Outlook for India’s economic growth and policy platforms
COP27: Implementation constraints amid the Russia–Ukraine conflict
Critical minerals: Illuminating the path to an electric future
This article was authored by a cross-section of representatives from S&P Global and in certain circumstances external guest authors. The views expressed are those
of the authors and do not necessarily reflect the views or positions of any entities they represent and are not necessarily reflected in the products and services those
entities offer. This research is a publication of S&P Global and does not comment on current or future credit ratings or credit rating methodologies.
7 Look Forward Journal January 2023
Future of Capital Markets

The End of Lower                                                                                 Highlights

for Longer:
                                                                                                 “Lower for longer” has resulted
                                                                                                 in many unwelcome distortions
                                                                                                 in recent decades, but there

A Post-COVID
                                                                                                 are reasons to think it may be
                                                                                                 coming to an end.

                                                                                                 The COVID era highlighted the

Silver Lining?
                                                                                                 need for supply chain resilience
                                                                                                 over efficiency, meaning higher
                                                                                                 costs for producing, storing and
                                                                                                 shipping goods, and a faster green
                                                                                                 transition, meaning higher interest
Structural changes to the global economy                                                         rates as the required investment
                                                                                                 absorbs savings.
suggest higher prices and rates ahead.
                                                                                                 The end of this phenomenon will
Paul Gruenwald                                                                                   not be painless, but it should
Global Chief Economist, S&P Global Ratings                                                       bring benefits.
paul.gruenwald@spglobal.com

W
          hile the COVID-19 pandemic and climate change represent
          large shocks to the economic system, there is a silver lining:
          Each in its own way will contribute to the end of “lower for longer.”
This will lead to a more balanced and sustainable macroeconomic environment.

Lower for Longer: The History
The past few decades have been characterized by “lower for longer.” Inflation has generally run below central
bank targets, necessitating a policy of ultralow interest rates. When the policy rate reached effective zero,
quantitative easing was employed. This involved large central bank purchases of government bonds to further
ease financial conditions. The main policy challenges were allowing inflation to rise while cushioning the impact
of the global financial crisis and COVID-19 on the financial sector and the economy more generally.

Lower for longer was the result of several structural factors. China’s entrance into the global production and
trade system, which amounted to a large, positive supply shock, put persistent downward pressure on prices.
Demographic pressures from aging populations, which led to a rise in savings, put downward pressure on
interest rates. The ongoing demand for safe assets by central banks and other entities put further downward
pressure on rates.

Chart 1 on the next page shows the monthly combinations of policy rates and inflation for the U.S. over three
decades. Both inflation and the policy rate have moved steadily lower over that period.

8 Look Forward Journal                                                                                                January 2023
Chart 1
US Inflation and Fed Funds Rates

Lower for Longer: The Consequences
Persistent low rates have led to many unwelcome consequences.                               Low rates distort
• Low rates distort asset prices. This is because future revenues are discounted at a
                                                                                            prices for both
  lower rate, generating higher present values. This applies to financial assets (such      financial assets,
  as equities) as well as nonfinancial assets (such as real estate).
                                                                                            such as equities, and
• Low rates restrict room for monetary policy maneuver. If policy rates are close to
  (effective) zero, then if activity slows and inflation starts to fall below target, the
                                                                                            nonfinancial ones,
  room to cut rates is limited. So, the necessary stimulus may not be forthcoming.          such as real estate.
  The alternative is quantitative easing, which has its own side effects, such as sucking
  up valuable collateral (government bonds) from the financial sector.

9 Look Forward Journal                                                                                    January 2023
Future of Capital Markets

• Low rates keep zombie firms alive. Abnormally low        As a result, supply chains are being reconsidered.
  rates keep so-called zombie firms in existence. These    They are now likely to include more redundancies, more
  are firms that have difficulty covering their interest   inventories, and more nearshoring and friendshoring.
  costs, let alone generating any profits. They tend to    The last of these reflects geopolitical considerations,
  pull down productivity and compete for resources         which will compound the purely economic changes.
  against more productive firms.                           Overall, these changes will lead to higher costs.

• Low rates encourage the reach for yield and
  excessive risk-taking. Fund managers and
                                                           Change #2. Accelerated Green
  households that promise or need to generate a            Transition Means Higher Rates
  minimum return on assets struggle in an abnormally
  low-rate environment. The response is often to           COVID-19 and the war in Ukraine accelerated green
  purchase higher yielding but riskier assets.             transition awareness. An indirect result of the
                                                           pandemic was increased awareness of climate change
The world has changed in the COVID-19 era, and             — specifically, the need to transition to greener energy
lower for longer may be a thing of the past. Here are      sources and sustainability concerns. This shift has
two reasons why.                                           taken place across society, involving households,
                                                           investors, all types of firms, policymakers and activists.

Change #1. Resiliency Over Efficiency                      Higher investment means higher interest rates.
Means Higher Prices                                        A basic tenet of economics is that savings equals
                                                           investment, with the rate of interest equilibrating the
Supply chains failed the resilience test. The COVID-19     two. Abundant savings push rates lower. That is what
pandemic showed that global supply chains, after           has happened in recent decades. Conversely, a rise in
having passed the efficiency test for decades, were        investment pushes interest rates higher. Therefore, a
not able to absorb the wild swings in demand and           sustained rise in green — or any — investment relative
worker availability that occurred during the pandemic.     to savings will lift rates on a continuing basis.
The results were order backlogs, congested ports and
higher prices.

Chart 2
‘Energy Transition’: Google Trends Search Data

10 Look Forward Journal                                                                                                 January 2023
Future of Capital Markets
Benefits of the End of Lower for Longer
The benefits of the end of lower for longer are
clear. Rates will rise from zero, lessening the need
for investors to reach for yield. Savers will be better
rewarded. Asset prices are likely to be valued more
moderately as discount factors rise. Higher structural
cost pressures will push monetary policy rates
higher. And central banks will have the opportunity to
unwind their balance sheets and end the associated Learn more
distortion of asset prices.
Take A Hike 2022: Which Sovereigns Are Best And Worst Placed To
Handle A Rise In Interest Rates
Rates will rise from zero,
and central banks will have How a 300bp Rise In Inflation and Interest Rates Could Hit Borrowers
the opportunity to unwind Global Debt Leverage: How Heavy Is the World’s Debt Burden?
their balance sheets and end
the associated distortion
of asset prices.
The transition path will not be painless. Weaning the
economy off low rates will have a cost. Asset price
adjustment will lower wealth and some spending, as
we are seeing at present. Borrowing costs will rise,
forcing some buyers to delay planned large, credit-
driven purchases. Debt service for floating rates
debt will increase as well. Zombie firms will face a
reckoning. All of these will involve some pain, but this
will be more palatable if growth and employment
remain strong.
Overall, we think the benefits outweigh the costs,
bringing about a more balanced and sustainable
macro-credit environment.
This article was authored by a cross-section of representatives from S&P Global and in certain circumstances external guest authors. The views expressed are those
of the authors and do not necessarily reflect the views or positions of any entities they represent and are not necessarily reflected in the products and services those
entities offer. This research is a publication of S&P Global and does not comment on current or future credit ratings or credit rating methodologies.
11 Look Forward Journal January 2023Balancing Energy Security & Energy Transition
Energy Transition: Highlights
Gaps in the
Although geopolitical turmoil,
macroeconomic headwinds and
focus on energy security present
Pathways
bumps in the road to a lower
emissions future, the long-term
energy transition is accelerating.
There is a wide gap between
Despite current economic and geopolitical crises, S&P Global Commodity Insights’
base-case forecast and the net-
the energy transition is accelerating — but not fast zero by 2050 trajectory required to
enough to meet Paris Agreement climate goals. meet Paris Agreement on climate
change goals of < 1.5 degrees C
warming. We forecast greenhouse
Ashutosh Singh
gas emissions will exceed Paris
Head of Energy Transition, S&P Global Commodity Insights
Agreement goals by 8 billion
ashutosh.singh@spglobal.com
metric tons of CO2 equivalent by
2030 and 41 GtCO2e by 2050.
Roman Kramarchuk
Head of Future Energy Analytics, S&P Global Commodity Insights
The share of renewables in the
roman.kramarchuk@spglobal.com
energy mix will grow, but it could
fall significantly short of the
Karl Nietvelt
levels needed to meet warming
Chief Analytical Officer, Global Infrastructure, S&P Global Ratings
goals. The share of oil and gas is
karl.nietvelt@spglobal.com
declining, but not fast enough.
T
The challenge is how to bridge
he energy transition is bumping against energy security the gap while ensuring a just and
requirements in the short term as countries try to smooth transition that maintains
navigate numerous immediate crises. While the long-term the security, reliability and
transition continues to accelerate, this is not sufficient to affordability of energy supply for
all. The fractured geopolitical
meet Paris Agreement on climate change goals.
environment has created
new headwinds.
S&P Global Commodity Insights analysis suggests a funding gap of almost $25 trillion to
meet Paris Agreement goals, but funding alone is not the challenge. We identify key gaps
in the transition pathways that need attention if we are to meet warming goals.
Hope vs. Reality
To date, governments and the private sector have not lived up to commitments made at
the 2015 COP conference held in Paris or to those made since. Action on decarbonization
varies across the world based on country- and region-specific interests and is closely
linked to perceptions of (and responses to) the energy security debate.
12 Look Forward Journal January 2023Balancing Energy Security & Energy Transition
Chart 1
Global GHG Emissions on Track To Miss Paris Agreement Climate Target
by 8 GtCO2e by 2030 and by More Than 40 GtCO2e by 2050
Governments and
the private sector
have not lived up
to commitments
made at the 2015
COP conference,
in Paris, or to
those made since.
Although a broad range of fundamental changes across policy, technology and markets have accelerated the energy transition,
there remains a wide gap between the reference energy transition path and the net-zero goals of the Paris Agreement.
S&P Global Commodity Insights analysis suggests the world is on track to exceed the greenhouse gas emissions required to meet
Paris Agreement climate goals of keeping the temperature rise below 1.5 degrees C by more than 8 billion metric tons of CO2
equivalent by 2030 and by 41 GtCO2e by 2050. Since most emissions come from energy usage, it is important to analyze how the
share of energy from different fuel sources will change over time.
To meet Paris Agreement climate goals, the global share of energy that comes from renewables needs to increase from 3%
currently to 31% by 2050; a tenfold increase. At the same time, fossil fuel (oil, gas and coal) energy usage must decline from 80%
currently to 33% by 2050. This outlook assumes significant roles for carbon capture use and storage (CCUS) and direct air capture
(DAC). Without these technologies, renewables’ share will need to go up by another 10%, and fossil fuels’ share will need to fall by
the same amount. But our reference case forecast suggests that renewables’ growth will fall significantly short of those targets,
and fossil fuels will not decline fast enough.
Chart 2
Renewables Share Must Grow More Than Tenfold, Fossil Fuel Share Must Decline by 60%
From 2021 Levels To Meet 1.5 Degrees C Goals; Both on Track To Miss by Roughly Half (%)
13 Look Forward Journal January 2023Balancing Energy Security & Energy Transition Most countries are falling short of their emissions targets to meet even a 2-degree warming goal. S&P Global Commodity Insights’ base-case forecast suggests warming levels of around 2.4 degrees by 2050. China’s greenhouse gas emissions are by far the most above the 2-degree target, followed by the Middle East, the U.S. and India. While U.S. and EU emissions are on a steady decline, they are set to miss the 2-degree emissions target by more than 100% by 2050. China’s emissions will not peak until the late 2020s, and those of most other developing nations will not do so until 2050. The gap between ambition, hope and reality is wide. Chart 3 Emissions by Region 14 Look Forward Journal January 2023
Balancing Energy Security & Energy Transition

Most countries are falling short of their emissions targets to meet
even a 2-degree warming goal.
The Pace of Transition Has Accelerated                       Key Challenges to Closing the Energy
as a Result of Current Crises                                Transition Gap to Net-Zero

The world faces several major crises, including an           • The need for cooperation in an increasingly
energy crisis, a food shortage, a global economic              fractured world. Russia’s invasion of Ukraine has left
downturn, a divided world and increasingly frequent            the world considerably more fractured. In addition,
weather disasters. These crises may be setting                 the standoff and tensions between China and the
us further back.                                               U.S. make global cooperation to reduce emissions
                                                               challenging. But reducing emissions needs a global
If we look past the current hurdles, however, the              solution. Even if emissions in the U.S. and the EU
transition to a lower emissions energy future is               decline to zero, emissions from the rest of the world
accelerating — just not fast enough to meet Paris              would still need to fall 65% from current levels by
Agreement goals.                                               2050 to reach a global 2-degree target.

The three largest energy consumers and greenhouse            • A transformation of energy systems, in which
gas emitters — China, the U.S. and the EU — have all           equipment and capital last for decades, that is
put significant energy transition policies in place in the     by nature complex and slow — as can be seen
past year to accelerate their transition pathways.             in the current energy crisis. To have any hope
                                                               of approaching net-zero targets by 2050, the
• The REPowerEU plan put forward by the EU in                  world needs to:
  response to the ongoing energy and geopolitical
  crisis caused by the Russia-Ukraine war clearly sets         - Meet all incremental energy demand with clean
  the bloc on an accelerated transition to renewable             energy sources on the supply side and install
  energy, despite increased use of coal, nuclear and             clean technologies (e.g., electrification) on the
  imported liquefied natural gas in the short term.              demand side. Even with the strong uptake in
                                                                 renewables and clean energy over the past 20
• The U.S. Inflation Reduction Act, which provides nearly        years, fossil fuels’ share today is 80% of total
  $370 billion in federal funding and financial incentives       primary energy consumption.
  to boost clean energy, also provides long-term
  incentives for CCUS and DAC, which has reinvigorated         - Supplement fossil fuel consumption with
  enthusiasm for these two critical technologies that            widespread use of CCUS and DAC to limit
  can help reduce emissions significantly.                       emissions. Ideally, this will be accompanied by
                                                                 large and efficient global voluntary carbon markets
• China has used its manufacturing might to                      and nature-based carbon offset solutions.
  establish itself as a global leader in clean energy
  manufacturing and supply chains. Despite its                 - Accompany the addition of new energy supplies
  reliance on coal as well as oil and gas, China sees            by efforts to replace existing energy, industry,
  the energy transition as a strategic advantage.                transportation and building/housing capital
  Reducing this reliance on imported oil and gas                 stock with cleaner alternatives — or to find ways
  and transitioning to clean energy will leverage the            to repower/retrofit or fuel switch these existing
  strengths of the Chinese economy. There is little              assets to low-emitting and zero-carbon alternatives.
  economic or strategic reason for China to slow its
  transition policy despite the geopolitical crisis and
  economic headwinds.

15 Look Forward Journal                                                                                                 January 2023
Balancing Energy Security & Energy Transition
• The need to implement new technologies at scale • The need for the cost of carbon to be better
quickly. Solar power, wind power and electric captured. To stimulate the competitiveness of low-
vehicles offer some solutions for the energy and carbon technologies and attract more investment
transportation sectors. Other technologies such as and financing, the cost of externalities needs to
hydrogen fuels, biofuels at scale, long duration energy be better anticipated and reflected in product and
storage and heat pumps for buildings are currently service prices. Whether this is by way of regulation,
more expensive and need to come down in cost. taxes or a carbon price may vary across regions.
Sectors such as high-temperature industrial heating,
long-haul trucking, maritime shipping and aviation are • The need to use new and different materials
particularly challenging to decarbonize. Technologies and to establish new supply chains, many of
around carbon capture and DAC can prove particularly which will need to scale up to unprecedented
impactful in driving solutions in these areas, but they levels. The energy transition over time will disrupt
remain in very early stages of adoption. current geopolitical energy-related dependencies
and create new ones. Geopolitical tensions can
• The large financing gaps. S&P Global Commodity heighten the shift in focus away from global efforts
Insights analysis suggests a $25 trillion cumulative and cooperation toward protectionist policies,
funding gap between forecast spending and the friendshoring and trading among smaller clubs of
investment needed to achieve net-zero by 2050. The nations, and smaller-scale efforts.
challenge lies in raising and directing the necessary
investment, considering that broad swathes of the Government and industry responses to these key
population are still relatively energy-poor. Driving challenges will significantly impact how successful we
these large investments will be more challenging in are at closing the energy transition gap. All credible
a world of higher interest rates and inflation. solutions will require global cooperation with an eye
toward security and affordability of energy for all.
• The need for oil and gas companies to be part
of the solution. Strong balance sheets, project
management skills and multiyear investment
horizons are needed to deploy large-scale energy
transition strategies. Major oil and gas companies
typically have all of these but are under pressure
to balance competing priorities from activists,
investors and policymakers. While high commodity
prices have significantly boosted cash flows at oil
and gas producers, those companies are under
pressure from investors to return excess cash Learn more
instead of investing in fossil fuels (due to fear of
stranded assets) or clean energy (due to relatively COP27 Special Report: Advancing Climate Objectives Amidst Conflict
low returns compared with fossil fuels). Hence, only
some global firms have started to allocate capital Inflation Reduction Act: Landmark Legislation Supercharges U.S.
toward low-carbon technologies, and spending Clean Energy Effort
is limited to 20% to 30% of their total annual
organic investment. Atlas of Energy Transition™
This article was authored by a cross-section of representatives from S&P Global and in certain circumstances external guest authors. The views expressed are those
of the authors and do not necessarily reflect the views or positions of any entities they represent and are not necessarily reflected in the products and services those
entities offer. This research is a publication of S&P Global and does not comment on current or future credit ratings or credit rating methodologies.
16 Look Forward Journal January 2023Trade, Resources & Supply Chains
The World Isn’t Highlights
in a Commodity
Current commodity market
conditions do not meet the
requirements of a supercycle.
Supercycle, but Commodity market stakeholders
are grappling with a series of
historic economic shocks that
It Should Be
have not yet subsided.
An acceleration of the transition
to lower- or zero-carbon energy
sources will likely lead to a new
A brutal series of shocks has left markets commodity supercycle.
ill-prepared for the challenges of the future.
Dave Ernsberger
Head of Market Reporting & Trading Solutions, S&P Global Commodity Insights
dave.ernsberger@spglobal.com
Simon Redmond
Senior Director, Sector Lead, Corporate Ratings, S&P Global Ratings
simon.redmond@spglobal.com
C
Without passing all three tests simultaneously,
ommodity prices were rarely far commodity markets are not in a supercycle.
from the headlines in 2022. With
food prices soaring, fuel bills A combination of surging demand, high prices and
driving global inflation and government stagnant/falling supply indicates a market in decline.
Spikes in coal prices as utilities flee from gas to coal
intervention in markets from Brussels
fall into this category.
to Beijing, it is easy to conclude the
world is in a commodities supercycle. A sustained surge in supply with no change in (or
However, a closer study of commodity falling) demand and soaring prices may signal a
markets shows we are not. The noise market beset by inefficiencies: Think of the container
market spikes of 2021, driven by supply chain
in pricing signals driven by shock after
disruptions. It may also indicate reform being driven
shock is creating distress in markets, by policy change, as was the case with the rampant
meaning we do not seem likely to fuel prices in late 2019 as shippers adjusted to stricter
enter one soon, either. But the longer environmental standards.
shocks go on, the more the fabric of
Surging supply and soaring demand paired with no
the markets frays. We are not in a
appreciable ramping up in price equal a balanced
supercycle, but maybe we should be. market environment experiencing benign growth
that lifts all boats, the equivalent of Mervyn King’s
A multiyear supercycle requires three indicators: Is noninflationary continuous expansion (NICE)
supply surging? Is demand surging? Are prices surging? economic theory. This typified the liquefied natural
gas market of 2010 to 2018.
17 Look Forward Journal January 2023Trade, Resources & Supply Chains
Today’s Markets Fail All Three Tests
Looking across commodity markets, prices are generally higher than they were at the start of 2020, and undoubtedly
volatile. Generally, though, markets fail each of these three tests. Demand is not surging for commodity markets as a
whole; demand growth has been underwhelming for most transport fuels, while sustained increases in demand are
likely to be challenged by momentum building in recessionary sentiment. Supply is not surging either: Companies and
investors are reluctant to finance supply, seeing market conditions and government policies as too impermanent or
timing as too uncertain to warrant the kinds of up-front capital costs involved in new long-term upstream projects or
infrastructure. The recent step-up in funding costs erodes the financial incentives for big developments too.
Chart 1
Commodity Markets Are in Distress, Not a Supercycle
A multiyear supercycle
requires three indicators:
Is supply surging?
Is demand surging?
Are prices surging?
18 Look Forward Journal January 2023Trade, Resources & Supply Chains Even price, the subject of so much scrutiny, tends to revert to the mean when distress eases. The triple whammy of COVID-19-related demand destruction, supply chain shocks as the world emerged unevenly from the pandemic, and sanctions on Russia arising from the war in Ukraine have created a nervous, reactionary pricing environment. However, prices should return to 2020 levels at the first sign of demand easing. Indeed, supply is being curtailed by as much as 2 million barrels per day in the oil markets by cuts from the Organization of the Petroleum Exporting Countries Plus and its allies. Without those cuts, oil prices would arguably be significantly lower — hardly the stuff of a commodity supercycle. 19 Look Forward Journal January 2023
Trade, Resources & Supply Chains Beyond the noise and volatility of the post-pandemic commodity markets, it is easy to see conditions in which a new supercycle could emerge. A Supercycle Could Be Around the Corner Commodity supercycles are surprisingly rare. The last generally accepted supercycle was 2003-2007, as powerful global economic forces were unleashed by China’s reforms and accession to the World Trade Organization in 2001. Looking beyond the noise and volatility of the post- Learn more pandemic commodity markets, it is easy to see conditions in which a new supercycle could emerge. Energy Security Sentinel™ The global population is thought to have reached 8 billion people on Nov. 15, 2022 — a striking milestone Commodities 2023: Global PX braces for greater volatility on new for commodity market watchers. supply, demand uncertainties Per-capita consumption of commodities remains Path to net-zero: Miners seek partners to achieve renewables goals low in emerging market economies, particularly India, which is only at a relatively early stage of Global Credit Outlook 2023: No Easy Way Out (see page 46) the emergence of a sizable middle class, the way China’s economic profile developed at the start Atlas of Energy Transition™ of the century. A more aggressive commitment to the energy transition across G-20 nations could also create the conditions for a sustained surge in demand, supply and prices. Battery metals such as lithium carbonate are showing the sort of sustained price increases that suggest a bigger cycle is on its way, and hydrogen and carbon markets are in the earliest days of showing strong growth in both supply and demand. Conversely, a return to classic energy supply sources in the medium term could also drive a supercycle as markets scramble to invest in traditional fuel sources. Today’s markets are in the midst of the most brutal and sustained shocks for a generation, and a supercycle may not be far behind. This article was authored by a cross-section of representatives from S&P Global and in certain circumstances external guest authors. The views expressed are those of the authors and do not necessarily reflect the views or positions of any entities they represent and are not necessarily reflected in the products and services those entities offer. This research is a publication of S&P Global and does not comment on current or future credit ratings or credit rating methodologies. 20 Look Forward Journal January 2023
Sustainability & Climate

Women CEOs                                                                                     Highlights

Model a
                                                                                               Women are still significantly
                                                                                               underrepresented as CEOs
                                                                                               globally, with a 5.4% share

Diverse Future
                                                                                               as of March 31, 2022, among
                                                                                               the 8,000 companies on the
                                                                                               S&P Global Broad Market Index
                                                                                               (BMI), covering corporations
                                                                                               with the largest global market
Women’s leadership styles position them                                                        capitalization. Women CEO
                                                                                               representation is very uneven
well to guide organizations through the                                                        across industries and geographies.
profound transformations ahead.                                                                The participation of women
                                                                                               on corporate boards is much
                                                                                               higher, with an average of 24%
Daniela Brandazza
                                                                                               across industries.
Senior Director, S&P Global Ratings
daniela.brandazza@spglobal.com
                                                                                               Women CEOs display more
                                                                                               diversity, empathy and
Dr. Gabriel Morin
                                                                                               adaptability in their leadership
Program Director and Associate Professor of Leadership Development,
                                                                                               styles, consistent with emerging
Master 2 International Human Resources Management,
                                                                                               theories around authentic
Paris, Université Paris Panthéon-Assas
                                                                                               leadership, according to sentiment
gabriel.morin@u-paris2.fr
                                                                                               and natural language processing
                                                                                               analysis conducted on earnings

T
                                                                                               call transcripts of leaders at over
      he gender gap between women and men CEOs worldwide                                       5,801 companies in the BMI.
      remains extremely wide nearly three years since the
      pandemic started, even though both are just as effective                                 For the past two years, women
                                                                                               CEOs have exhibited a more
at delivering financial performance. In some respects, leadership
                                                                                               positive communication style
styles adopted by women CEOs during this uncertain time                                        and embraced a large range of
— embracing diversity, empathy and adaptability — position                                     stakeholders, an approach that
them well to lead organizations and will resonate with diverse                                 could help companies attract
publics through the profound transformations ahead.                                            diverse talent and prosper.

Our research confirms that women CEOs exhibited a more positive communication style
from the peak of the pandemic, in early 2021, to the first quarter of 2022. This is based
on sentiment analyses of earnings call transcripts of 6,831 CEOs at companies on the
S&P Global Broad Market Index, covering corporations with the largest global market
capitalization in 65 countries. We note a shift in the top three most favored styles used by
women CEOs to ones categorized as diversity, empathy and adaptability. Ranking fourth
was a transformative style addressing the need to respond to long-lasting changes
stemming from the pandemic, such as adjustments to consumer behavior and to the
workplace. Men CEOs focused more on words related to transaction as well as growth
and performance during the period surveyed.

21 Look Forward Journal                                                                                             January 2023
Sustainability & Climate
Chart 1
The Share of Women CEOs Is Higher Where Their Participation Rate Is Also Higher
2021
By 2022, diversity
topped empathy
and adaptability
as the most
2022 important trait
of women CEOs’
leadership style.
© 2023 S&P Global.
22 Look Forward Journal January 2023Sustainability & Climate Women CEOs remain underrepresented, accounting for The future of leadership lies in embracing better only 5.4% of all CEOs at these largest 8,000 companies leadership theories, and authentic leadership is among globally. Even in unprecedented circumstances, women the emerging leadership theories that form this new corporate leaders made some inroads over the past paradigm. This research aims to contribute to a better year, with the real estate and healthcare sectors leading understanding of women leaders as role models in the way and the energy sector lagging. Our research businesses around the world. It also intends to shed also shows huge differences among the 65 countries light on emerging leadership styles during this time of studied, ranging from zero women CEOs in Qatar and economic uncertainty and workplace transformation. Mexico to over 12% in Norway, the Philippines and New We believe these data and insights can contribute to Zealand. This remains much lower than the participation an open and honest conversation about leadership of women on corporate boards, which averages 24% styles that has the potential to create a more equitable, across industries. productive and sustainable future. Women’s Leadership Styles Tend To Benefit a Broader Range of Stakeholders Using advanced techniques in natural language processing, our research aims to shed light on communication styles that women CEOs used during the early and later pandemic periods. Our latest data indicate that the type of positive communication style favored by women CEOs and their focus on diversity Learn more seems more aligned with the emerging theory of authentic leadership, which draws from and mirrors Women CEOs: Leadership for a Diverse Future the diversity of society. Our 2022 research, which revisits a similar 2021 study, confirms, with one more Leadership in Turbulent Times: Women CEOs During COVID-19 year of data, that the communication characteristics of women CEOs point to a different leadership style Something’s Gotta Give than that practiced by their male counterparts. The leadership women CEOs exemplify in this report falls into the category of authentic leadership, according to our review of the literature. It is a more inclusive style that promotes team diversity. That said, some of these characteristics can enhance the typical ways men lead by making their approach more comprehensive and sustainable. Women’s leadership style tends to benefit a broader range of stakeholders within and outside companies — customers, suppliers and community. This article was authored by a cross-section of representatives from S&P Global and in certain circumstances external guest authors. The views expressed are those of the authors and do not necessarily reflect the views or positions of any entities they represent and are not necessarily reflected in the products and services those entities offer. This research is a publication of S&P Global and does not comment on current or future credit ratings or credit rating methodologies. 23 Look Forward Journal January 2023
Future of Capital Markets

Global Debt                                                                               Highlights

Leverage: Is a
                                                                                          Record leverage. Global debt
                                                                                          has hit a record $300 trillion, or
                                                                                          349% leverage on gross domestic

Great Reset
                                                                                          product. This translates to $37,500
                                                                                          of average debt for each person in
                                                                                          the world versus GDP per capita of
                                                                                          just $12,000. Government debt-to-

Coming?
                                                                                          GDP leverage grew aggressively,
                                                                                          by 76%, to a total of 102%,
                                                                                          from 2007 to 2022.

                                                                                          Higher interest rates. Debt
Rising rates and slowing economies mean                                                   servicing has become more
                                                                                          difficult. Fed funds and European
the world’s high leverage poses a crisis risk.                                            Central Bank rates were up an
                                                                                          average of 3 percentage points
Terry Chan, CFA                                                                           in 2022. Assuming 35% of debt is
Managing Director and Senior Research Fellow,                                             floating rate, this means $3 trillion
Credit Research & Insights, S&P Global Ratings                                            more in interest expenses, or
terry.chan@spglobal.com                                                                   $380 per capita.

Alexandra Dimitrijevic                                                                    Great Reset. There is no easy way
Global Head of Research & Development,                                                    to keep global leverage down.
S&P Global Ratings                                                                        Trade-offs include more cautious
alexandra.dimitrijevic@spglobal.com                                                       lending, reduced overspending,
                                                                                          restructuring low-performing

T
                                                                                          enterprises and writing down
      he world’s leverage is at a higher level than pre-global                            less-productive debt. This
                                                                                          will require a “Great Reset”
      financial crisis (GFC) peaks. Yet demand for debt — to
                                                                                          of policymaker mindset and
      help consumers with inflation, mitigate climate change                              community acceptance.
and rebuild infrastructure, for example — will continue.
Rising interest rates and slowing economies are making the
debt burden heavier. To mitigate the risk of a financial crisis,
trade-offs between spending and saving may be needed.

More Debt Than Ever Before
Three hundred trillion dollars. That is the record debt which global governments,
households, financial corporates and nonfinancial corporates owed in June 2022, as
estimated by the Institute of International Finance. The $300 trillion is equivalent to
349% of global gross domestic product, 26% higher than the pre-GFC figure of 278%
(June 2007, see chart 1). The $300 trillion works out to $37,500 of debt for every
person in the world, compared to a GDP per capita of just $12,000.

24 Look Forward Journal                                                                                         January 2023
Future of Capital Markets Global governments, households, financial corporates and nonfinancial corporates owe a record $300 trillion as of June 2022. Chart 1 Global Leverage Still Much Higher Than Pre-GFC Despite Post-COVID Easing Productivity from debt has declined. We see this from the upward trend of global debt-to-GDP ratios since the GFC. The economic value-add from every additional dollar of debt has decreased. Leverage of the government sector has grown aggressively. The sector’s debt-to-GDP ratio rose 76%, to a total of 102%, from 2007 to 2022. Mature market governments tend to be more leveraged (see table 1 on next page). Nonfinancial corporates’ ratio is up 31%, to 98%. Corporates in some European, Japanese and emerging markets operate at higher leverage levels. China is of particular concern, as its debt makes up a third of global corporate debt. In a sample of more than 6,000 Chinese corporations, the average debt (net of cash) to earnings ratio was 6.0x in 2021, twice the global level. Meanwhile, the percentage of “B-” ratings and below of U.S. speculative-grade issuers doubled, to 36%, in September 2022 compared with September 2007. Household and financial sectors were more conservative. Household leverage grew just 7%, to 64%. The financial sector was flat, at 85%. 25 Look Forward Journal January 2023
Future of Capital Markets

Table 1
Relative Leverage Risk of Major Economies and Broad Sectors
                                                                                                                             Total
                                                                                                                             nonfinancials
                             2022 GDP                Nonfinancial             Total         Financial                        plus financial
                             (US$B)       Households corporates   Governments nonfinancials sector                           sector
Mature markets
Australia                    1.6          u 117           ▲ 62             ▲ 54             ▲ 234             l   44         ▲ 277
Canada                       2.1          u 106           u 116            ▲ 98             u 320             l   154        u 474
France                       2.7          ▲ 66            u 166           u 123             u 354             l   94         u 448
Germany                      3.9          ▲ 55            ▲ 72             ▲ 70             ▲ 198             l   61         ▲ 259
Italy                        1.9          l    42         ▲ 69            u 154             ▲ 266             l   48         ▲ 314
Japan                        4.2          ▲ 64            u 117           u 251             u 433            ▲ 217           u 649
Spain                        1.3          ▲ 57            ▲ 100           u 123             ▲ 279             l   41         ▲ 321
U.K.                         3.0          ▲ 83            ▲ 66            u 110             ▲ 260             l   173        u 433
U.S.                         24.2         ▲ 78            ▲ 81            u 122             ▲ 281             l   78         ▲ 359
Euro area                    13.1         ▲ 59            u 110           u 107             ▲ 275             l   113        ▲ 389
Total mature markets         50.8         ▲ 75            ▲ 96            u 124             ▲ 295             l   112        u 407

Emerging markets
Brazil                       1.8          l    32         ▲ 53            ▲ 89              ▲ 174             l   40         ▲ 214
China                        17.5         ▲ 63            u 157           ▲ 76              ▲ 297             l   50         ▲ 347
India                        3.1          l    39         ▲ 51            ▲ 83              ▲ 173             l   3          ▲ 176
Indonesia                    1.2          l    16         l   25           l   38           l   79            l   7          l   87
Korea                        1.6          u 102           u 118           ▲ 48              ▲ 268             l   89         ▲ 357
Mexico                       1.5          l    16         l   24           l   39           l   78            l   13         l   91
Russian Federation           2.8          l    20         ▲ 75             l   17           l   113           l   6          l   119
Total emerging markets       38.6         ▲ 47            u 102           ▲ 66              ▲ 214             l   38         ▲ 252
Global                       89.4         ▲ 64            ▲ 98            u 102             ▲ 264             l   85         ▲ 349
As of Nov. 29, 2022. Red diamond u denotes the highest risk sextile; yellow triangle ▲ , the third to sixth sextiles; and green circle l, the
fifth to sixth sextiles. Sextile thresholds of households, nonfinancial corporates, governments and financial sector are set at one-third
that of total nonfinancials. Other mature and emerging market economies besides those listed in the table are included in totals.
Data source: Institute of International Finance.
Source: S&P Global Ratings.
© 2023 S&P Global.

Why Is This a Risk?

Higher returns required. Central banks are raising policy rates, and investors are demanding higher yields, in
response to inflation. We see 2022 as the inflexion point of the monetary environment moving away from low
interest rates and easy money. Higher yields imply a repricing of assets, while tighter money could translate to
lessened market liquidity.

Three trillion more dollars. Higher interest expenses are already straining less-creditworthy governments
and corporates, and lower-income households. The fed funds rate went up about 4 percentage points in 2022,
and the European Central Bank rate went up 2 (see chart 2 on the next page). Applying the average of the two
rates (3 pps) on the floating-rate portion of debt (we assume 35% of debt is floating and 65% is fixed) implies an
additional annual interest expense of $3 trillion (see chart 3 on the next page). This is equivalent to $380, or 3%
of GDP, per capita, on average debt of $37,500. As fixed-rate debt is increasingly refinanced, this amount will
rise over time to $8.6 trillion, or $1,080 per capita.

26 Look Forward Journal                                                                                                            January 2023
Future of Capital Markets
Chart 2 Chart 3
Fed Funds Up Almost 4 Percentage Points, ECB Up 2 Extra $3 Trillion in Interest, Up to $8.6 Trillion Over Time
Repricing and project thresholds. Rising interest for mature markets than for emerging markets, as
rates influence asset pricing and project viability. The we expect more GDP growth upside for the latter
price of an asset is, in theory, its discounted cash markets. Altogether, the projected global debt-to-
flow. Unsurprisingly, the stock market corrected in GDP ratio could reach 366% in 2030 (see chart 4)
2022. The S&P 500 index price-to-earnings ratio (PE) versus June 2022’s 349%. For rated sovereigns,
was 29x at the end of November 2022, implying a 3.5% our base case sees the total gross debt-to-GDP
discount rate (inverse of PE). This rate is about the U.S. ratio of mature market sovereigns rising marginally
“BB” corporate bond average yield in 2021. The PE is to 107% by 2025 from 106% in 2022. For emerging
now 19x, implying a 5.2% rate — slightly below the “BB” markets, the projected ratio remains roughly flat at
yield for 2022. Previously, borrowers were able to take 65%. (We use the Institute of International Finance’s
on low-return projects because of low interest rates. definitions of mature and emerging markets.)
Such projects now require higher return thresholds,
making them less viable. This development will add to • Pessimistic. If global borrowers freely take on
financial pressures on borrowers and dampen future more less-productive debt, for example, because
business activity volumes. governments give in to populist demands or lenders
are overly desperate to book assets, the projected
debt-to-GDP ratio could hit a much more worrying
No Easy Way Out 391% by 2030, up 12% from June 2022’s 349%.
Three scenarios. We examine three possible • Optimistic. What if governments and regulators
scenarios to year 2030 of the global debt leverage collectively decide to manage their economy’s
trend — base case, pessimistic and optimistic. leverage down, with a goal to return to pre-COVID-19
levels by 2030? In this optimistic scenario, the debt-
• Base case. Our base-case scenario assumes global to-GDP ratio would decline by 8% to 321% by 2030-
total debt leverage over the next eight years, by end. The ratio in the first quarter of 2019 was 321%.
2030-end, will grow by 5%, which is about the same This does not imply that no new debt is formed,
rate as that for the eight-year period before COVID-19 but rather that productive new debt replaces
hit in 2020. We see the leverage rising slightly faster unproductive old debt.
The projected global debt-to-GDP ratio could reach 366% in 2030,
above the 349% reached in June 2022.
27 Look Forward Journal January 2023You can also read