Request for an Incidental Harassment Authorization to Allow the Non-Lethal Take of Marine Mammals Incidental to Site Characterization Surveys of ...
←
→
Page content transcription
If your browser does not render page correctly, please read the page content below
Request for an Incidental Harassment
Authorization to Allow the Non-Lethal Take of
 Marine Mammals Incidental to Site
Characterization Surveys of BOEM Lease Area
 OCS-A 0521

 Submitted To

 National Marine Fisheries Service
 Office of Protected Resources
 Silver Spring, MD

 Submitted By

 Mayflower Wind Energy LLC

 Submitted October 2020
 Revised December 2020
Mayflower Wind Energy LLC Request for an IHA December 2020

Request for an Incidental Harassment Authorization to Allow the Non-Lethal Take of Marine
Mammals Incidental to Site Characterization Surveys of BOEM Lease Area OCS-A 0521

Submitted To

Jolie Harrison, Division Chief
Amy Fowler, Senior Analyst: ESA/MMPA Support Services
NOAA Fisheries Office of Protected Resources
Permits and Conservation Division
1315 East-West Highway, F/PR1 Room 13805,
Silver Spring, MD 20910

Submitted By

Mayflower Wind Energy LLC
2 Drydock Avenue
Boston, MA 02210

Prepared by

LGL Ecological Research Associates, Inc.
4103 S. Texas Avenue, Suite 211
Bryan, TX 77802

October 2020
Revised December 2020

 Page ii
Mayflower Wind Energy LLC Request for an IHA December 2020

 TABLE OF CONTENTS
1.0 DESCRIPTION OF SPECIFIED ACTIVITY ........................................................................................................ 1
 1.1. HRG SURVEY DETAILS ..............................................................................................................................................1
 1.2. HRG SURVEY SOUND SOURCES ..................................................................................................................................3
 1.3. GEOTECHNICAL SURVEY ............................................................................................................................................5
 1.4. VESSEL DYNAMIC POSITIONING ..................................................................................................................................5
2.0 DATES, DURATION, AND SPECIFIED GEOGRAPHIC REGION ........................................................................ 5
3.0 SPECIES AND NUMBERS OF MARINE MAMMALS ...................................................................................... 5
4.0 AFFECTED SPECIES STATUS AND DISTRIBUTION ...................................................................................... 11
 4.1. CETACEANS ..........................................................................................................................................................11
 4.1.1. Fin Whale (Balaenoptera physalus) ..........................................................................................................11
 4.1.2. Humpback Whale (Megaptera novaeangliae) ..........................................................................................12
 4.1.3. Common Minke Whale (Balaenoptera acutorostrata) .............................................................................13
 4.1.4. North Atlantic Right Whale (Eubalaena glacialis) .....................................................................................14
 4.1.5. Sei Whale (Balaenoptera borealis) ............................................................................................................16
 4.1.6. Atlantic White-Sided Dolphin (Lagenorhynchus acutus) ...........................................................................17
 4.1.7. Common Bottlenose Dolphin (Tursiops truncatus) ...................................................................................18
 4.1.8. Harbor Porpoise (Phocoena phocoena) ....................................................................................................19
 4.1.9. Pilot Whales (Globicephala spp.) ..............................................................................................................20
 4.1.10. Risso’s Dolphin (Grampus griseus) ..........................................................................................................21
 4.1.11. Short-beaked Common Dolphin (Delphinus delphis delphis) ..................................................................22
 4.1.12. Sperm Whale (Physeter macrocephalus) ................................................................................................23
 4.2. PINNIPEDS ...........................................................................................................................................................24
 4.2.1. Gray Seal (Halichoerus grypus) .................................................................................................................24
 4.2.2. Harbor Seal (Phoca vitulina vitulina).........................................................................................................25
5.0 TYPE OF INCIDENTAL TAKING AUTHORIZATION REQUESTED ................................................................... 26
6.0 TAKE ESTIMATES FOR MARINE MAMMALS ............................................................................................. 26
 6.1. BASIS FOR ESTIMATING POTENTIAL “TAKE” ................................................................................................................26
 6.2. ACOUSTIC THRESHOLDS ..........................................................................................................................................26
 6.3. AREA POTENTIALLY EXPOSED TO SOUNDS ABOVE THRESHOLD LEVELS ..............................................................................27
 6.3.1. Level A .......................................................................................................................................................27
 6.3.2. Level B .......................................................................................................................................................29
 6.4. MARINE MAMMAL DENSITIES..................................................................................................................................31
 6.5. REQUESTED TAKE ..................................................................................................................................................33
7.0 ANTICIPATED IMPACT OF THE ACTIVITY .................................................................................................. 35
8.0 ANTICIPATED IMPACTS ON SUBSISTENCE USES ....................................................................................... 36
9.0 ANTICIPATED IMPACTS ON HABITAT ....................................................................................................... 36
10.0 ANTICIPATED EFFECTS OF HABITAT IMPACTS ON MARINE MAMMALS ................................................... 36
11.0 MITIGATION MEASURES TO PROTECT MARINE MAMMALS AND THEIR HABITAT.................................... 36
 11.1. NUMBER OF PROTECTED SPECIES OBSERVERS ...........................................................................................................37
 11.2. PSO WATCH GUIDELINES .....................................................................................................................................37
 11.3. DAY-TIME VISUAL MONITORING EQUIPMENT ...........................................................................................................37
 11.4. NIGHT-TIME VISUAL MONITORING EQUIPMENT ........................................................................................................37
 11.5. DATA COLLECTION AND REPORTING ........................................................................................................................37

 Page iii
Mayflower Wind Energy LLC Request for an IHA December 2020

 11.6. MITIGATION MEASURES .......................................................................................................................................37
 11.6.1. Exclusion Zones .......................................................................................................................................38
 11.6.2. Pre-Startup Observations ........................................................................................................................38
 11.6.3. Ramp-up ..................................................................................................................................................38
 11.6.4. Shut-downs .............................................................................................................................................39
 11.7. VESSEL STRIKE AVOIDANCE....................................................................................................................................39
 11.8. SOUND SOURCE VERIFICATION ...............................................................................................................................39
12.0 MITIGATION MEASURES TO PROTECT SUBSISTENCE USES ...................................................................... 40
13.0 MONITORING AND REPORTING............................................................................................................... 40
14.0 SUGGESTED MEANS OF COORDINATION ................................................................................................. 40
15.0 LITERATURE CITED ................................................................................................................................... 40
APPENDIX A – DISTANCES TO ACOUSTIC THRESHOLDS ........................................................................................ 51

 Page iv
Mayflower Wind Energy LLC Request for an IHA December 2020

 LIST OF ACRONYMS
~ approximately
ADC analogue-digital converter
AMAPPS Atlantic Marine Assessment Program for Protected Species
BIA Biologically Important Area
BOEM Bureau of Ocean Energy Management
CETAP Cetacean and Turtle Assessment Program
CPT cone penetration test
dB decibel
DMA Dynamic Management Area
DP dynamic positioning
e.g. for example
EEZ Exclusive Economic Zone
ESA Endangered Species Act
hr hour
HRG high-resolution geophysical
ITA Incidental Take Authorization
IR infrared
IWC International Whaling Commission
kHz kilohertz
kJ kilo-Joule
km kilometer
LED light-emitting diode
m meter
MA WEA Massachusetts Wind Energy Area
MBES multibeam echo sounder
MMPA Marine Mammal Protection Act
NARW North Atlantic right whale
NEFSC NOAA Northeast Fisheries Science Center
NLPSC Northeast Large Pelagic Survey Collaborative
NMFS National Marine Fisheries Service
NVD night vision device
OCS Outer Continental Shelf
OSP optimum sustainable population
PAM passive acoustic monitoring
PSO protected species observer
RI/MA WEAs Rhode Island and Massachusetts Wind Energy Areas
re 1 µ Pa referenced to one micro Pascal
RL received level
RWSAS Right Whale Sightings Advisory System
SEFSC NOAA Southeast Fisheries Science Center
SEL sound exposure level
SMA Seasonal Management Area
SPL sound pressure level
SPLrms root-mean-square sound pressure level
SPLcum cumulative sound pressure level
SSS side scan sonar
UME unusual mortality event
USFWS United States Fish and Wildlife Service
WTG wind turbine generator

 Page v
Mayflower Wind Energy LLC Request for an IHA December 2020

 Page vi

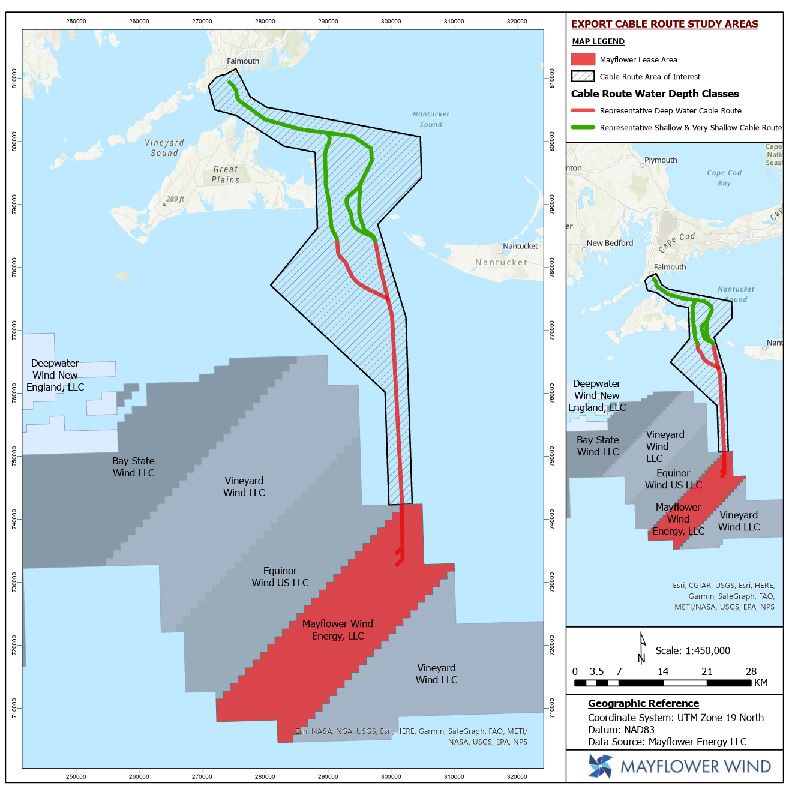
Mayflower Wind Energy LLC Request for an IHA December 2020

 1.0 DESCRIPTION OF SPECIFIED ACTIVITY
 Mayflower Wind Energy LLC (Mayflower) is a joint venture between Shell New Energies US LLC
(Shell) and Ocean Winds North America LLC, formerly EDPR Offshore North America LLC (OW) co-
owned on a 50:50 basis. In December 2018, Mayflower was awarded the BOEM ATL-4W OCS-A 0521
Lease Area (hereafter, the Lease Area), off the coast of Massachusetts, which covers approximately 127,388
acres. Lease Area OCS-A 0521 is located on the OCS approximately 60 km south of Martha’s Vineyard,
MA. Mayflower intends to conduct a marine site characterization survey of the Lease Area as well as the
export cable route from the Lease Area to landfall at Falmouth, MA, commencing in April 2021. The
objective of the survey is to acquire high resolution geophysical (HRG) and geotechnical data on the
bathymetry, seafloor morphology, subsurface geology, environmental/biological sites, seafloor
obstructions, soil conditions, and locations of any man-made, historical or archaeological resources within
Lease Area OCS-A 0521 and along the proposed export cable route corridor to support lease development
in accordance with Bureau of Ocean Energy Management (BOEM) renewable energy regulations and
associated guidelines pursuant to 30 CFR Part 585 as well as state of Massachusetts requirements.
 The geophysical surveys would occur from April 1 through November 30, 2021. Surveys would be
carried out by up to four (4) different vessels—one operating primarily in the Lease Area and deep-water
sections of the cable route (24 hr operations), a second operating primarily in the shallow water portion of
the cable route and sometimes into the deep water portion of the cable route (either daylight only operations
or 24 hour operations), and up to two (2) shallow-draft vessels working in very shallow waters (daylight
only operations). Up to four additional vessels may be used to conduct geotechnical sampling activities
(vibracores, seabed core penetration tests (CPTs), and boreholes) during the same period as the geophysical
surveys.

1.1. HRG Survey Details
 Figure 1 shows the overall HRG survey area including the Lease Area and the planned export cable
route from the Lease Area to landfall at Falmouth, MA. For assessing potential impacts to marine mammals,
the survey has been divided into two areas:
 (1) Deep-water Survey Area – The red shaded area and lines in Figure 1 shows the Lease Area where
 wind turbine generators (WTGs) and inter-array cables will be installed as well as the deep-water
 section of the export cable route. The proposed survey in this area will primarily consist of 24-
 hour vessel operations, with some 12-hour per day vessel operations possible.
 (2) Shallow-water Survey Area – The green lines in Figure 1 show the rest of the export cable route
 in shallow waters and very shallow nearshore waters. Depending on vessel availability, survey
 operations in the shallow water area may occur only during daylight periods or involve 24-hour
 survey operations. In the very shallow water areas, one or two shallow-draft (
Mayflower Wind Energy LLC Request for an IHA December 2020

 Table 1. Activity Details for 2021 Mayflower Geophysical Surveys from April 1 through November 30.

 Approximate
 Approximate Survey Active Sound
 Location Survey Distance
 Trackline1 (km) Source Days
 Per Day (km)
 Lease Area and deep-water section
 7000 80 88
 of the cable route
 Shallow-water section of the cable
 3250 30–60 55–109
 route
 Very shallow cable route 4100 15 274

 Page 2
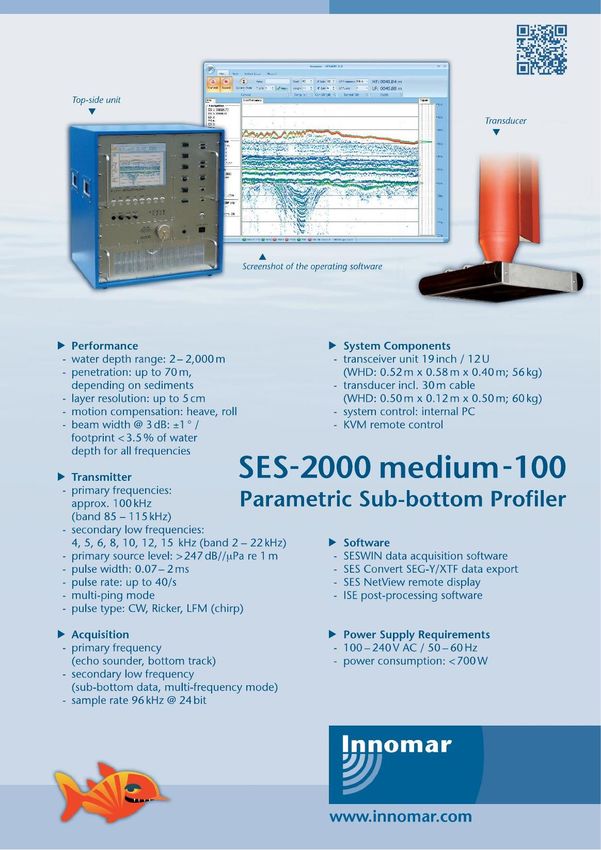
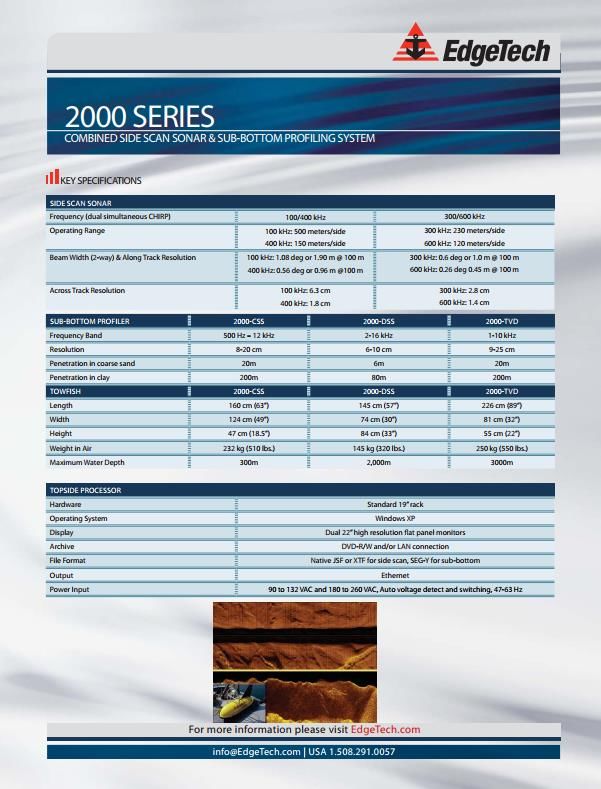
Mayflower Wind Energy LLC Request for an IHA December 2020

Figure 1. Map of Mayflower Wind Lease OCS-A 0521 within the Massachusetts Wind Energy Area and the
proposed export cable route to Falmouth, MA.

1.2. HRG Survey Sound Sources
 Some of the sounds produced during the planned surveys have the potential to be audible to marine
mammals (MacGillivray et al. 2014). A geophysical survey contractor(s) has not yet been selected to
conduct this work, so the exact equipment to be used is currently unknown. However, potential contractors
provided representative sound-generating equipment that may be used during the geophysical surveys
which is shown in Table 2, Table 3, and Table 4. Only the equipment in Table 2 produces sounds that fall
within the range of marine mammal hearing (see Section 6) and have the potential to result in behavioral
harassment. Although single-beam echosounders and USBL systems (Table 4) produce sounds audible to
some marine mammals, they are used for safe vessel navigation and equipment positioning purposes during
HRG surveys and are not considered to have the potential to result in take (NMFS 2019 communication
regarding Mayflower Letter of Concurrence). Equipment shown in Table 3 has operating frequencies that
exceed the upper frequency range of marine mammal hearing and thus are not considered when estimating
potential takes.

 Table 2. 2021 Mayflower Wind Geophysical Survey Equipment with Operating
 Frequencies Below 200 kHz.

 Equipment Type System Operating Frequency
 Geomarine Geo-Spark
 0.01 – 1.9 kHz
 400 tips, up to 800 J
 Sparker Applied Acoustics Dura-Spark
 UHD 0.01 – 1.9 kHz
 400 tips, up to 800 J
 Boomer Applied Acoustics S-boom 0.01 – 5 kHz
 Primary frequencies:
 ~100kHz (band 85 – 115kHz)
 Innomar SES-2000 SBP
 Secondary low frequencies
 (band 2 – 22 kHz)
 EdgeTech 3100 with
 Sub-bottom Profiler 2 – 16 kHz
 SB 2-16 towfish
 Edgetech DW-106 1 – 10 kHz
 Teledyne Benthos Chirp III 2 – 7 kHz
 Knudson Pinger SBP 15 kHz

 Page 3
Mayflower Wind Energy LLC Request for an IHA December 2020

 Table 3. 2021 Mayflower Wind Geophysical Survey Equipment with Operating
 Frequencies Above 200 kHz.

 Equipment Type System Operating Frequency
 EdgeTech 4200 300/600 kHz
 EdgeTech 4205 300/600/900 kHz
 Sidescan Sonar
 EdgeTech 400 300/600 kHz
 EdgeTech 2000 300/600 kHz
 Dual-head Kongsberg
 200-400 kHz
 EM 2040
 Multibeam Echosounder Dual-head Teledyne
 200-400 kHz
 SeaBat T50
 R2Sonic 2024 200-400 kHz

 Table 4. 2021 Mayflower Wind Geophysical Survey Navigational Equipment and
 Geotechnical Survey Equipment.

 Equipment Type System Operating Frequency
 Kongsberg EA 400 38 & 200 kHz
 Single-beam Echosounder* 3.5-50 kHz & 100 kHz-
 Teledyne Echotrac CV300
 1mHz
 Kongsberg HiPAP
 35x/45x/50x models 20 - 30 kHz
 Sonardyne Scout, Ranger,
 USBL* and MiniRanger models 19 - 34 kHz
 Sonardyne Coastal
 Transponder 35 - 50 kHz
 Surface Navigation including Applanix POSMV & Veripos N/A
 DGNSS/Gyrocompass/Attitude Apex
 Sensors
 CTD/SVP Teledyne RapidCast N/A
 Surface Navigation including Applanix POSMV & Veripos N/A
 DGNSS/Gyrocompass/Attitude Apex
 Sensors
 Geometrics G-882 Marine N/A
 Gradiometer Magnetometer Transverse
 Gradiometer Array
 Vibracore 4 inch diameter N/A
 Datem Neptune 3000 N/A
 CPT Geoquip Marine GMC201 N/A
 WISON-APB (downhole) N/A
 * Navigational Equipment

 Page 4
Mayflower Wind Energy LLC Request for an IHA December 2020

1.3. Geotechnical Survey
 Within the Lease Area and along the export cable route(s), a geotechnical campaign including
vibracores, seabed CPT and borehole sampling will be conducted at approximately 415 locations by up to
four additional vessels in April through November 2021. Camera systems that will be used for visual
surveys of the seafloor and shallow sub-surface in all survey areas do not produce sounds. Geotechnical
sampling will be conducted from a vessel with a Dynamic Positioning (DP) system.
 During geotechnical surveying, sounds produced by vibracoring and CPT are within marine mammal
hearing ranges. However, NMFS recently reported that the likelihood of vibracoring sounds rising to the
level of take is so low as to be discountable because of the short duration of the activity and the fact that
marine mammals are expected to react to the vessel and DP sounds before the vibracoring starts (e.g.,
NMFS 2018a, b, c). NMFS also reported recently that field studies have shown that CPT sounds are unlikely
to exceed marine mammal acoustic harassment thresholds and are thus unlikely to result in takes (e.g.,
NMFS 2018a, b, c). Thus, the geotechnical sampling is not anticipated to results in marine mammal take
and therefore is not considered further in this application.

1.4. Vessel Dynamic Positioning
 Vessels conducting geotechnical surveys use DP systems to maintain vessel position at specific
locations during sampling activities. DP systems use bow-thrusters that create non-impulsive sounds that
are similar to other vessel sounds like the vessel’s main propeller(s). Although DP thruster sounds are within
marine mammal hearing ranges, NMFS reported recently that monitoring of past projects during DP thruster
use has shown a lack of behavioral response to these sounds by marine mammals and thus the probability
that DP thruster use would result in marine mammal take is so low as to be discountable (e.g., NMFS 2018a,
b, c). Vessel DP use is therefore not considered further in this application.

 2.0 DATES, DURATION, AND SPECIFIED GEOGRAPHIC REGION
 Mayflower's 2021 site characterization survey will occur within BOEM Renewable Energy Lease
Area OCS-A 0521 offshore Massachusetts and along the proposed export cable route from the Lease Area
to landfall at Falmouth, MA (Figure 1). The Lease Area comprises approximately 127,388 acres (515.5
km2) and lies approximately 20 nautical miles (38 km) south-southwest of Nantucket. Water depths within
the Lease Area are in the range of 126–204 ft (38–62 m).
 The survey is expected to begin on April 1, 2021 and conclude by November 30, 2021. Inclusive of
any weather downtime and crew transfers the planned survey activities should be completed within this 6-
month period. This includes up to four vessels operating concurrently for a combined total of approximately
470 vessel-days.

 3.0 SPECIES AND NUMBERS OF MARINE MAMMALS
 Table 5 lists the 26 marine mammal species that potentially could occur within the Lease Area and
surrounding waters, along with their listing status under the Endangered Species Act (ESA), their relative
likelihood of occurrence, and their documented abundance in the region. Additional details of species
abundances are provided in Section 4 below in the individual species descriptions. The species in the region
include six species of large baleen whale (mysticetes); 17 species of large and small toothed whales,
dolphins, and porpoise (odontocetes); and three species of earless seals (phocid pinnipeds). It is unlikely
that all 26 species would be present in the Lease Area during the site characterization survey because some
of them are seasonal migrants and because their distributions vary among years based on factors such as
oceanographic characteristics and prey availability. Seasonality and abundance reported in Table 5 and

 Page 5
Mayflower Wind Energy LLC Request for an IHA December 2020

discussed below were mainly derived from the Northeast Large Pelagic Survey Collaborative (NLPSC)
aerial surveys of the Rhode Island/Massachusetts Wind Energy Areas (RI/MA WEAs) during 2011–2015
(Kraus et al. 2016), Roberts et al. (2016, 2017, 2018) habitat-based density models, and the Kenney and
Vigness-Raposa (2010) marine mammal assessment for the Rhode Island Ocean Special Area Management
Plan as well as the NOAA Fisheries 2018 Stock Assessment Report (Hayes et al. 2019). Additional sighting
data from Atlantic Marine Assessment Program for Protected Species (AMAPPS) shipboard and aerial
surveys is also reported where relevant.
 Of the 26 marine mammal species listed in Table 5, eleven species are considered to be “rare” in the
area based on sighting and distribution data: blue whale (Balaenoptera musculus), dwarf and pygmy sperm
whales (Kogia sima and K. breviceps), Cuvier’s beaked whale (Ziphius cavirostris), four species of
Mesoplodont beaked whales—Blainsville’s (Mesoplodon densirostris), Gervais’ (M. europaeus),
Sowerby’s (M. bidens), and True’s (M. mirus)—Atlantic spotted dolphin (Stenella frontalis), striped
dolphin (Stenella coeruleoalba), and harp seal (Pagophilus groenlandicus) (Hayes et al. 2019; Kenney and
Vigness-Raposa 2010; Kraus et al. 2016; Roberts et al. 2016). Given the rarity of these species in the area
and the relatively short duration of the proposed activities, the probability of these species being exposed
to survey activities is quite low, and they are thus not considered further in this request. The short-finned
pilot whale is also considered rare in this area; however, because the density and population estimates that
we use (Roberts et al. 2017) consider both long- and short-finned pilot whales together as a pilot whale
"guild", our take request for pilot whales would include a small percentage of short-finned pilot whales.
 Other marine mammal species that have been documented to occur within the U.S. Atlantic
Exclusive Economic Zone (EEZ) but are not expected to be present in the Lease Area based on a scarcity
of sightings and their known habitat preferences and distributions are: the West Indian manatee (Trichechus
manatus), Bryde’s whale (Balaenoptera edeni), beluga whale (Delphinapterus leucas), northern bottlenose
whale (Hyperoodon ampullatus), killer whale (Orcinus orca), pygmy killer whale (Feresa attenuata), false
killer whale (Pseudorca crassidens), melon-headed whale (Peponocephala electra), white-beaked dolphin
(Lagenorhynchus albirostris), pantropical spotted dolphin (Stenella attenuata), Fraser’s dolphin
(Lagenodelphis hosei), rough-toothed dolphin (Steno bredanensis), clymene dolphin (Stenella clymene),
spinner dolphin (Stenella longirostris), hooded seal (Cystophora cristata), and ringed seal (Pusa hipsida)
(CeTAP 1982; USFWS 2014; Hayes et al. 2019; Kenney and Vigness-Raposa, 2010; Kraus et al. 2016;
Roberts et al. 2016). These 16 species are not considered further in this request.

 Page 6
Mayflower Wind Energy LLC Request for an IHA December 2020

Table 5. Marine mammal species that could be present in the BOEM OCS-A 0521 Renewable Energy Lease Area
 Abundancee Abundancef
 ESA/MMPA Occurrence Seasonality in (NOAA (Roberts et al.
 Common Name (Species Name) and Stock Hearing Groupb
 Statusa in MA WEAc MA WEAd Fisheries best 2016, 2017,
 available) 2018)
 Mysticetes
 Blue whale (Balaenoptera musculus) Endangered/ Low-frequency Mainly winter, but
 Rare Unknown 11
 Western North Atlantic Stock Strategic cetacean rare year-round

 Year-round, but
 Fin whale (Balaenoptera physalus) Endangered/ Low-frequency
 Common mainly spring and 3,006 3,005
 Western North Atlantic Stock Strategic cetacean
 summer
 Year-round, but
 Humpback whale (Megaptera novaeangliae) Not Listed/Not Low-frequency 248 Winter,
 Common mainly spring and 1,396
 Gulf of Maine Stock Strategic cetacean 1,773 Summer
 summer
 Spring, summer,
 Minke whale (Balaenoptera acutorostrata) Not Listed/Not Low-frequency 652 Winter,
 Common and fall (March to 2,591
 Canadian East Coast Stock Strategic cetacean 3,014 Summer
 September)

 292 Winter,
 Winter and spring
 North Atlantic right whale (Eubalaena glacialis) Endangered/ Low-frequency 394 Spring,
 Common (December to 428
 Western North Atlantic Stock Strategic cetacean 358 Summer,
 May)
 124 Fall

 Spring and
 Sei whale (Balaenoptera borealis) Endangered/ Low-frequency 201 Winter,
 Common summer (March to 28
 Nova Scotia Stock Strategic cetacean 453 Summer
 June)

 Odontocetes
 20,918 January,
 Atlantic spotted dolphin (Stenella frontalis) Not Listed/Not Mid-frequency 22,787 April,
 Rare NA 39,921
 Western North Atlantic Stock Strategic cetacean 30,333 July,
 24,325 October

 Page 7
Mayflower Wind Energy LLC Request for an IHA December 2020

 Abundancee Abundancef
 ESA/MMPA Occurrence Seasonality in (NOAA (Roberts et al.
 Common Name (Species Name) and Stock Hearing Groupb
 Statusa in MA WEAc MA WEAd Fisheries best 2016, 2017,
 available) 2018)
 27,246 January,
 Atlantic white-sided dolphin (Lagenorhynchus acutus) Not Listed/Not Mid-frequency 35,909 April,
 Common Year-round 31,912
 Western North Atlantic Stock Strategic cetacean 91,473 July,
 77,042 October

 Blainville’s, Gervais’, True’s, and Sowerby’s beaked
 whales (Mesoplodon densitostris, M. europaeus, M. Not Listed/Not Mid-frequency
 Rare NA 10,107 5,937g
 mirus, and M. bidens) Strategic cetacean
 Western North Atlantic Stock

 69,251 January,
 Common bottlenose dolphin (Tursiops truncatus) Not Listed/Not Mid-frequency 66,713 April,
 Common Year-round 62,851
 Western North Atlantic Offshore Stockh Strategic cetacean 75,620 July,
 82,379 October

 Cuvier's beaked whale (Ziphius cavirostris) Not Listed/Not Mid-frequency
 Rare NA 5,744 7,731
 Western North Atlantic Stock Strategic cetacean

 Dwarf and pygmy sperm whale (Kogia sima and K. Not Listed/Not High-frequency
 Rare NA 7,750 6,197
 breviceps) Western North Atlantic Stock Strategic cetacean
 Year-round, but
 Harbor porpoise (Phocoena phocoena) Not Listed/Not High-frequency 13,782 Winter,
 Common less abundant in 75,079
 Gulf of Maine/Bay of Fundy Stock Strategic cetacean 60,281 Summer
 summer
 Pilot whale, long-finned (Globicephalus melas) Not Listed/Not Mid-frequency
 Uncommon Year-round 39,215 27,597i
 Western North Atlantic Stock Strategic cetacean

 Pilot whale, short-finned (Globicaphalus macrorhynchus) Not Listed/Not Mid-frequency
 Rare NA 28,924 27,597i
 Western North Atlantic Stock Strategic cetacean
 5,254 January,
 Risso’s dolphin (Grampus griseus) Not Listed/Not Mid-frequency 10,631 April,
 Uncommon Year-round 35,493
 Western North Atlantic Stock Strategic cetacean 23,010 July,
 7,883 October

 Page 8
Mayflower Wind Energy LLC Request for an IHA December 2020

 Abundancee Abundancef
 ESA/MMPA Occurrence Seasonality in (NOAA (Roberts et al.
 Common Name (Species Name) and Stock Hearing Groupb
 Statusa in MA WEAc MA WEAd Fisheries best 2016, 2017,
 available) 2018)
 76,792 January,
 Short-beaked common dolphin (Delphinus delphis Year-round, but
 Not Listed/Not Mid-frequency 98,027 April,
 delphis) Common more abundant in 80,227
 Strategic cetacean 121,292 July,
 Western North Atlantic Stock summer
 113,119 October

 Sperm whale (Physeter macrocephalus) Endangered/ Mid-frequency Mainly summer
 Uncommon 4,349 4,199j
 North Atlantic Stock Strategic cetacean and fall

 Striped dolphin (Stenella coeruleoalba) Not Listed/Not Mid-frequency
 Rare NA 67,036 76,660
 Western North Atlantic Stock Strategic cetacean

 Pinnipeds
 10,709 January,
 Gray seal (Halichoerus grypus) Not Listed/Not 14,246 April,
 Phocid pinniped Common Year-round 27,131
 Western North Atlantic Stock Strategic 11,961 July,
 8,581 Octoberk

 10,709 January,
 Harbor seal (Phoca vitulina) Not Listed/Not Year-round, but 14,246 April,
 Phocid pinniped Common 75,834
 Western North Atlantic Stock Strategic rare in summer 11,961 July,
 8,581 Octoberk

 10,709 January,
 Harp seal (Pagophilus groenlandicus) Not Listed/Not 14,246 April,
 Phocid pinniped Uncommon Winter and spring Unknownl
 Western North Atlantic Stock Strategic 11,961 July,
 8,581 Octoberk
 a Listing status under the US Endangered Species Act (ESA) and Marine Mammal Protection Act (MMPA).
 b Hearing group according to NOAA Fisheries technical guidance (NMFS 2018). NOTE: Hearing groups names were recently revised by Southall et al. (2019).
 c Occurrence in the Massachusetts Wind Energy Area (MA WEA) is mainly derived from Hayes et al. (2019), Kenney and Vigness-Raposa (2010), Kraus et al. (2016), and Roberts et al. (2016).
 d Seasonality in the MA WEA was mainly derived from Kraus et al. (2016) and Kenney and Vigness-Raposa (2010).
 e
 "Best Available" population estimate is from NOAA Fisheries 2019 Stock Assessment Report (Hayes et al. 2020).
 f Abundance estimates are from habitat-based density modeling of the Atlantic EEZ from Roberts et al. (2016, 2017, and 2018).
 g The four Mesoplodont beaked whale species are grouped in Roberts et al. (2017).

 Page 9
Mayflower Wind Energy LLC Request for an IHA December 2020

 h Common bottlenose dolphins occurring in the MA Wind Energy Area likely belong to the Western North Atlantic Offshore Stock. It is possible that some could belong to the Western North
 Atlantic Northern Migratory Coastal Stock (listed as depleted under the MMPA), but the northernmost range of that stock is south of the Lease Area.
 i Long-finned and short-finned pilot whales are grouped in Roberts et al. (2017).
 j Roberts et al. (2017) sperm whale abundance estimate consists of 223 for the shelf area and 3,976 for the slope and abyss.
 k All phocid seals are considered together as a group in Roberts et al. (2018).
 l Hayes et al. (2019) report insufficient data to estimate the population size of harp seals in U.S. waters; however, the best estimate for the whole population is 7.4 million and this appears to be
 stable.

 Page 10
Mayflower Wind Energy LLC Request for an IHA December 2020

 4.0 AFFECTED SPECIES STATUS AND DISTRIBUTION
 As discussed in Section 3 above, fifteen species of marine mammals are known to occur either
commonly or uncommonly (but with some regularity) within the Lease Area and surrounding waters. The
North Atlantic right whale (NARW), fin whale, sei whale, and sperm whale are all considered endangered
under the ESA. These four species are also all considered strategic stocks under the Marine Mammal
Protection Act (MMPA; Hayes et al. 2019). The common bottlenose dolphins occurring in the Lease Area
would likely belong to the Western North Atlantic Offshore Stock, which is not considered strategic. It is
possible, however, that some could belong to the Western North Atlantic Northern Migratory Coastal Stock,
which is considered depleted under the MMPA and therefore a strategic stock, but the northernmost range
of that stock is generally south of the Lease Area. The sections below provide additional details on the
distribution, abundance, and status of the marine mammal species or stocks that could occur in the Lease
Area.

4.1. Cetaceans

4.1.1. Fin Whale (Balaenoptera physalus)
 The fin whale is the second largest baleen whale and is widely distributed in all the world’s oceans,
but is most abundant in temperate and cold waters (Aguilar and García-Vernet 2018). Fin whales are
presumed to migrate seasonally between feeding and breeding grounds, but their migrations are less well
defined than for other baleen whales. In the North Atlantic, some feeding areas have been identified but
there are no known wintering areas (Aguilar and García-Vernet 2018). Fin whales are found in the summer
from Baffin Bay, Spitsbergen, and the Barents Sea south to North Carolina and the coast of Portugal (Rice
1998). Apparently not all individuals migrate, because in winter they have been sighted from Newfoundland
to the Gulf of Mexico and the Caribbean Sea, and from the Faroes and Norway south to the Canary Islands
(Rice 1998). Fin whales off the eastern United States, Nova Scotia, and the southeastern coast of
Newfoundland are believed to constitute a single stock under the present International Whaling
Commission (IWC) management scheme (Donovan 1991), which has been called the Western North
Atlantic stock.

Distribution
 In the U.S. Atlantic EEZ, fin whales are the most commonly observed large whale, accounting for
almost half of all large whales sighted over the continental shelf during aerial surveys from Cape Hatteras
to Nova Scotia (CETAP 1982). Western North Atlantic fin whales typically feed in the Gulf of Maine and
the waters surrounding New England, but mating and calving (and general wintering) areas are largely
unknown (Hain et al. 1992; Hayes et al. 2019). It is likely that fin whales occurring in the U.S. Atlantic
EEZ undergo migrations into Canadian waters, open-ocean areas, and perhaps even subtropical or tropical
regions. Hain et al. (1992) suggest that calving takes place during October to January in latitudes of the US
mid-Atlantic region.
 Kraus et al. (2016) suggest that, compared to other baleen whale species, fin whales have a high
multi-seasonal relative abundance in the Rhode Island/Massachusetts (RI/MA) and MA WEAs and
surrounding areas. Fin whales were observed during spring and summer of the 2011–2015 NLPSC aerial
survey. This species was observed primarily in the offshore (southern) regions of the RI/MA and MA WEAs
during spring and was found closer to shore (northern areas) during the summer months (Kraus et al. 2016).
Calves were observed three times and feeding was observed nine times during the Kraus et al. (2016) study.
Although fin whales were largely absent from visual surveys in the RI/MA and MA WEAs in the fall and
winter months (Kraus et al. 2016), acoustic data indicated that this species was present in the RI/MA and
MA WEAs during all months of the year. Fin whales were acoustically detected in the MA WEA on 87%

 Page 11
Mayflower Wind Energy LLC Request for an IHA December 2020

of study days (889/1,020 days). Acoustic detection data indicated a lack of seasonal trends in Fin whale
abundance with slightly less detections from April to July (Kraus et al. 2016). Because the detection range
for fin whale vocalizations is more than 200 km, detected signals may have originated from areas far outside
of the RI/MA and MA WEAs; however, arrival patterns of many fin whale vocalizations indicated that
received signals likely originated from within the Kraus et al. (2016) study area. Fin whales were observed
in the MA WEA and nearby waters during spring and summer of the 2010–2017 AMAPPS surveys (NEFSC
and SEFSC 2011–2018).

Abundance
 Roberts et al. (2017) habitat-based density models provided abundance estimates of 1,629 fin whales
in the U.S. Atlantic EEZ during February and 4,859 during June, which were the months predicted to have
the lowest and highest abundances, respectively. The best available abundance estimate for the Western
North Atlantic fin whale stock in U.S. waters from NMFS stock assessments is 3,006 individuals (Hayes et
al. 2020).

Status
 The status of the Western North Atlantic stock of fin whales relative to its optimum sustainable
population (OSP) in the U.S. Atlantic EEZ is unknown, but the North Atlantic population is listed as
Endangered under the ESA and MA ESA, and NMFS considers this a strategic stock. There are currently
no critical habitat areas established for the fin whale under the ESA. The Lease Area is flanked by two
Biologically Important Areas (BIAs) for feeding for fin whales—the area to the northeast in the southern
Gulf of Maine is considered a BIA year-round, while the area to the southwest off the tip of Long Island is
a BIA from March to October (LaBrecque et al. 2015).

4.1.2. Humpback Whale (Megaptera novaeangliae)
 Humpback whales are found in all ocean basins (Clapham 2018). This species is highly migratory,
traveling between mid- to high-latitude waters where it feeds during spring through fall and lower latitude
wintering grounds where it calves and generally does not feed. Routine migratory distances are thousands
of kilometers (Kennedy et al. 2014). Although considered to be mainly a coastal species, humpback whales
often traverse deep pelagic areas while migrating (Baker et al. 1998; Calambokidis et al. 2001; Garrigue et
al. 2002). In the North Atlantic, six separate humpback whale sub-populations have been identified by their
consistent maternally determined fidelity to different feeding areas (Clapham and Mayo 1987). These
populations are found in the Gulf of Maine, Gulf of St. Lawrence, Newfoundland/Labrador, western
Greenland, Iceland, and Norway (Hayes et al. 2019). The large majority of humpback whales that inhabit
the waters in the U.S. Atlantic EEZ belong to the Gulf of Maine stock. In the western North Atlantic, the
Gulf of Maine humpback whale stock is recognized as a distinct feeding stock on the basis of strong site
fidelity by individual whales to the region and more recent genetic analysis (Palsbøll et al. 2001; Vigness-
Raposa et al. 2010; Hayes et al. 2019).

Distribution
 Humpback whales in the Gulf of Maine stock typically feed in the waters between the Gulf of Maine
and Newfoundland during spring, summer, and fall, but have been observed feeding in other areas, such as
off the coast of New York (Sieswerda et al. 2015). Some humpback whales from the Gulf of Maine migrate
to the West Indies in the winter, where they mate and calve their young (Katona and Beard 1990; Palsbøll
et al. 1997). However, not all humpback whales from the Gulf of Maine stock migrate to the West Indies
every winter because significant numbers of animals are observed in mid- and high-latitude regions at this
time (Swingle et al. 1993).
 Kraus et al. (2016) observed humpback whales in the RI/MA and MA WEAs and surrounding areas
during all seasons of the 2011–2015 NLPSC aerial survey. Humpback whales were observed most often

 Page 12
Mayflower Wind Energy LLC Request for an IHA December 2020

during the spring and summer months, with a peak from April to June. Calves were observed 10 times and
feeding was observed 10 times during the Kraus et al. (2016) study. That study also observed one instance
of courtship behavior. Although humpback whales were only rarely seen during fall and winter surveys,
acoustic data indicate that this species may be present within the MA WEA year-round, with the highest
rates of acoustic detections in winter and spring (Kraus et al. 2016). Humpback whales were acoustically
detected in the MA WEA on 56% of acoustic survey days (566/1,020 days). Acoustic detections do not
differentiate between individuals, so detections on multiple days could be the same or different individuals.
The mean detection range for humpback whales using passive acoustic monitoring (PAM) was 30–36 km,
with a mean radius of 36 km for the PAM system. Kraus et al. (2016) estimated that 63% of acoustic
detections of humpback whales represented whales within their study area. Humpback whales were
observed in the MA WEA and nearby waters during the spring and summer of the 2010–2017 AMAPPS
surveys (NEFSC and SEFSC 2011–2018).

Abundance
 The most recent ocean basin-wide estimate of the North Atlantic humpback whale population is
11,570 (Palsbøll et al. 1997). Roberts et al. (2017) habitat-based density models provide abundance
estimates of 248 humpback whales in the U.S. Atlantic EEZ during the winter and 1,773 during the summer.
The best available abundance estimate for the Gulf of Maine humpback whale stock is 1,396 (95% credible
interval 1363-1429), which was based on a state-space model of the sighting histories of individual whales
identified using photo-identification techniques (Hayes et al., 2020). and this population appears to be
increasing (Hayes et al. 2019).

Status
 The entire humpback whale species was previously listed as endangered under the ESA. However,
in September 2016, NOAA Fisheries identified 14 Distinct Population Segments (DPSs) of humpback
whales and revised the ESA listing for this species (NMFS 2016b). Four DPSs were listed as endangered,
one as threatened, and the remaining nine were deemed not warranted for listing. Humpback whales in the
U.S. Atlantic EEZ belong to the West Indies DPS, which is considered not warranted for listing under the
ESA (NMFS 2016b). The state of Massachusetts lists the humpback whale as Endangered under the MA
ESA. The Gulf of Maine stock of humpback whales is no longer considered depleted by NMFS because it
does not coincide with any listed DPS. It is also not considered strategic by NMFS because the U.S. fishery-
caused mortality and serious injury does not exceed the potential biological removal (PBR) for this stock.
For the period 2012 through 2016, the minimum annual rate of human-caused mortality and serious injury
to the Gulf of Maine humpback whale stock averaged 9.7 animals per year (Hayes et al. 2019).
 Humpback whales in the Western North Atlantic have been experiencing an Unusual Mortality Event
(UME) since January 2016 that appears to be related to a larger than usual number of vessel collisions
(NMFS 2020a). Of the whales examined, about half had evidence of human interaction (ship strike or
entanglement). In total, 133 mortalities were documented through September 8th, 2020, as part of this event,
including 23 off Massachusetts (NMFS 2020a). A BIA for humpback whales for feeding has been
designated northeast of the Lease Area in the Gulf of Maine, Stellwagen Bank, and the Great South Channel
from March through December (LaBrecque et al. 2015).

4.1.3. Common Minke Whale (Balaenoptera acutorostrata)
 Minke whales have a cosmopolitan distribution that spans ice-free latitudes (Stewart and Leather-
wood 1985). They occur in both coastal and offshore waters (Perrin et al. 2018b). Three species are
recognized worldwide, with only the common Minke whale occurring in the northern hemisphere. Minke
whales are generally observed alone or in small groups of two or three individuals; larger aggregations may
occur at higher latitudes (Katona et al. 1993; Perrin et al. 2018b). There are four recognized populations in
the Atlantic Ocean (Donovan 1991). Minke whales found in the U.S. Atlantic EEZ are considered part of

 Page 13
Mayflower Wind Energy LLC Request for an IHA December 2020

the Canadian East Coast stock, which inhabits the area from the western half of the Davis Strait (45°W) to
the Gulf of Mexico (Hayes et al. 2019).

Distribution
 The Minke whale is common off the U.S. east coast over continental shelf waters, especially off New
England during spring and summer (CETAP 1982). It is the third most abundant large whale in the EEZ.
There is a seasonal component to their distribution in the Northwest Atlantic. This species is most abundant
in New England waters during spring through fall while September through April they are most abundant
in deep oceanic waters throughout the North Atlantic (Hayes et al. 2019).
 Kraus et al. (2016) observed Minke whales in the RI/MA and MA WEAs and surrounding areas
primarily from May to June during the 2011–2015 NLPSC aerial survey. This species demonstrated a
distinct seasonal habitat usage pattern that was consistent throughout the study. Minke whales were not
observed between October and February, but acoustic data indicate the presence of this species in the winter
months. Calves were observed twice, and feeding was also observed twice during the Kraus et al. (2016)
study. Minke whales were acoustically detected in the MA WEA on 28% of project days (291/1,020 days).
Minke whale acoustic presence data also exhibited a distinct seasonal pattern; acoustic presence was lowest
in the months of December and January, steadily increased beginning in February, peaked in April, and
exhibited a gradual decrease throughout the summer months (Kraus et al. 2016). Acoustic detection range
for this species was small enough that over 99% of detections were limited to within the Kraus et al. (2016)
study area. Minke whales were observed several times in the MA WEA and nearby waters during spring
and summer of the 2010–2017 AMAPPS surveys (NEFSC and SEFSC 2011–2018).

Abundance
 Roberts et al. (2017) habitat-based density models provide abundance estimates of 652 Minke whales
in the U.S. Atlantic EEZ during winter (November–March) and 3,014 during summer (April–October)
months. The best abundance estimate for the U.S. Atlantic EEZ from NOAA Fisheries stock assessments
is 2,591 (Hayes et al. 2019). This estimate is likely biased low because it does not account for a number of
Minke whales in Canadian waters and did not account for availability bias due to submerged animals.

Status
 Minke whales are not listed as threatened or endangered under the ESA and the Canadian East Coast
Stock is not considered strategic under the MMPA. Minke whales in the Western North Atlantic have been
experiencing a UME since January 2017 with some evidence of human interactions as well as infectious
disease but more study is required (NMFS 2020b). In total, 97 mortalities were documented through
September 8th, 2020 as part of this event, including 33 mortalities in Massachusetts (NMFS 2020b). A BIA
for Minke whales for feeding has been designated east of the Lease Area from March through November
(LaBrecque et al. 2015).

4.1.4. North Atlantic Right Whale (Eubalaena glacialis)
 NARWs are among the rarest of all marine mammal species in the Atlantic Ocean. Likely only about
450 individuals remain in the population, and after appearing to be recovering from a low of about 270
animals in 1990, this population now appears to be declining (Pace et al. 2017). NARWs are skim feeders,
swimming slowly at or below the surface with mouth open to capture prey, which consists entirely of
zooplankton (Kenney 2018). Research suggests that NARWs must locate and exploit extremely dense
patches of zooplankton to feed efficiently (Mayo and Marx 1990). These dense zooplankton patches are a
primary characteristic of the spring, summer, and fall NARW habitats (Kenney et al. 1986, 1995). NARWs
are usually observed in groups of less than 12 individuals, and most often as single individuals or pairs.
Larger groups may be observed in feeding or breeding areas (Jefferson et al. 2008). The NARW is a

 Page 14
Mayflower Wind Energy LLC Request for an IHA December 2020

migratory species that travels from high-latitude feeding waters to low-latitude calving and breeding
grounds.

Distribution
 The Western Atlantic stock of NARWs ranges primarily from calving grounds in coastal waters of
the southeastern United States to feeding grounds in New England waters and the Canadian Bay of Fundy,
Scotian Shelf, and Gulf of St. Lawrence (Hayes et al. 2019). These whales undertake a seasonal migration
from their northeast feeding grounds (generally spring, summer, and fall habitats) south along the U.S. east
coast to their calving grounds in the waters of the southeastern United States (Kenney and Vigness-Raposa
2010). However, this species has been observed feeding in winter in the mid-Atlantic region and has been
recorded off the coast of New Jersey in all months of the year (Whitt et al. 2013). Surveys demonstrate the
existence of seven areas where NARWs congregate seasonally: the coastal waters of the southeastern
United States, the Great South Channel, Jordan Basin, Georges Basin along the northeastern edge of
Georges Bank, Cape Cod and Massachusetts Bays, the Bay of Fundy, and the Roseway Basin on the Scotian
Shelf (Hayes et al. 2019).
 Kraus et al. (2016) observed NARWs in the RI/MA and MA WEAs and surrounding waters in winter
and spring during the 2011–2015 NLPSC aerial survey and observed 11 instances of courtship behavior.
The greatest sightings per unit effort (SPUE) in the RI/MA and MA WEAs was in March. Seventy-seven
unique individual NARWs were observed in the RI/MA and MA WEAs over the duration of the NLPSC
surveys (Kraus et al. 2016). No calves were observed. Kraus et al. (2016) acoustically detected NARWs
with PAM within the MA WEA on 43% of project days (443/1,020 days) and during all months of the year.
Acoustic detections do not differentiate between individuals, so detections on multiple days could be the
same or different individuals. NARWs exhibited notable seasonal variability in acoustic presence, with
maximum occurrence in the winter and spring (January through March), and minimum occurrence in
summer (July, August, and September). The mean detection range for NARWs using PAM was 15–24 km,
with a mean radius of 21 km for the PAM system within the study area.
 Roberts et al. (2016) predict that the highest density of NARWs in the MA WEA and adjacent waters
occurs in April, and Kraus et al. (2016) reported greatest levels of SPUE of NARWs in the WEA in March.
The NLPSC aerial surveys report no sightings of NARWs for the months of May through October, and
reported only four sightings in December across all survey years (Kraus et al. 2016). NARWs were observed
in the MA WEA and nearby waters during the winter, spring, and summer of the 2010–2017 AMAPPS
surveys (NEFSC and SEFSC 2011–2018). Sightings of this species in the Lease Area are possible though
NARWs are generally distributed further north at the time of year when the proposed survey is scheduled
to occur.

Abundance
 Roberts et al. (2017) habitat-based density models provide abundance estimates of 292 NARWs in
the U.S. Atlantic EEZ during winter (December–March), 394 during spring (April–June), 358 during
summer (July–September), and 124 during fall (October–November) months. The best abundance estimate
available for the North Atlantic right whale stock is 428 individuals (95% credible intervals 406-4470
(Hayes et al., 2020). This estimate is based on a published state-space model of the sighting histories of
individual whales identified using photo-identification techniques (Pace et al., 2017). Sightings histories
were constructed from the photo-ID recapture database as it existed in October 2018. It is important to note
the uncertainty due to the statistically-based estimation process used where uncertainties exist in the
estimation of abundance because it is based on a probabilistic model that makes certain assumptions about
the structure of the data (Hayes et al., 2020). The estimate does not consider that NARWs have been
experiencing an UME since June 7, 2017, with 31 documented deaths as of July 28th, 2020 (NMFS 2020c).
This unusual mortality event appears to be driven by entanglement in fishing gear (6 cases suspected or
confirmed in the U.S. and 2 in Canada) and blunt force trauma associated with ship strikes (8 cases

 Page 15
Mayflower Wind Energy LLC Request for an IHA December 2020

suspected or confirmed in Canada and 2 in the U.S.) mainly in the Gulf of St. Lawrence, Canada. Cause of
death findings for the unusual mortality event are based on full necropsies conducted on 18 of the 30 dead
NARWs and support human interactions (vessel strikes and rope entanglements) as the cause of death for
the majority of the whales (Daoust et al. 2017; NMFS 2020c).

Status
 The size of the Western Atlantic stock of NARWs is considered extremely low relative to its OSP in
the U.S. Atlantic EEZ (Hayes et al. 2019). The Western Atlantic Stock of NARWs is classified as a strategic
stock under the MMPA and is listed as Endangered under the ESA and MA ESA. Historically, the
population suffered severely from commercial overharvesting and has more recently been threatened by
incidental fishery entanglement and vessel collisions (Knowlton and Kraus 2001; Johnson et al. 2005; Pace
et al. 2017).
 To protect this species from ship strikes, NOAA Fisheries designated Seasonal Management Areas
(SMAs) in U.S. waters in 2008 (NMFS 2008). All vessels greater than 65 ft in overall length must operate
at speeds of 10 knots or less within these areas during specific time periods. The Block Island Sound SMA
overlaps with the southern portion of the MA WEA and is active between November 1 and April 30 each
year. The Great South Channel SMA lies to the Northeast of the MA WEA and is active April 1 to July 31.
In addition, the rule provides for the establishment of Dynamic Management Areas (DMAs) when and
where NARWs are sighted outside SMAs. DMAs are generally in effect for two weeks and the 10 knots or
less speed restriction is voluntary.
 NOAA Fisheries has designated two critical habitat areas for the NARW under the ESA: the Gulf of
Maine/Georges Bank region and the southeast calving grounds from North Carolina to Florida (NMFS
2016a). Two additional critical habitat areas in Canadian waters, Grand Manan Basin and Roseway Basin,
were identified in Canada’s final recovery strategy for the NARW (Brown et al. 2009).
 The Lease Area is encompassed by a NARW BIA for migration from March to April and from
November to December (LaBrecque et al. 2015). The NARW BIA for migration includes the RI/MA and
MA WEAs and beyond to the continental slope, extending northward to offshore of Provincetown, MA and
southward to halfway down the Florida coast (LaBrecque et al. 2015). However, the proposed survey is
scheduled to occur from April through September, which is outside the timing of this BIA.

4.1.5. Sei Whale (Balaenoptera borealis)
 The sei whale occurs worldwide, with a preference for oceanic waters (Horwood 2018). It is
uncommon in shelf waters. Sei whales undertake extensive seasonal migrations, feeding at subpolar
latitudes during the summer and calving at lower latitudes in the winter. Sei whales often travel alone while
migrating, but on feeding grounds they can be observed alone or in aggregations of 20-100 animals
(Horwood 2018). Two stocks of sei whales are recognized in the western North Atlantic: the Labrador Sea
Stock and the Nova Scotia Stock. Sei whales occurring within the Lease Area are considered part of the
Nova Scotia stock, which includes continental shelf waters from the northeastern United States to areas
south of Newfoundland (Hayes et al. 2017). The southern portions of the Nova Scotia stock’s range includes
the Gulf of Maine and Georges Bank during spring and summer (Hayes et al. 2017).

Distribution
 Sighting data suggest sei whale distribution is largely centered in the waters of New England and
eastern Canada (Hayes et al. 2017; Roberts et al. 2016). There appears to be a strong seasonal component
to sei whale distribution in U.S. waters. They are relatively widespread and most abundant in New England
waters from spring to fall (April to July). During winter, the species is predicted to be largely absent
(Roberts et al. 2016).

 Page 16
You can also read