Long term conservation agriculture and best nutrient management improves productivity and profitability coupled with soil properties of a ...
←
→
Page content transcription
If your browser does not render page correctly, please read the page content below
www.nature.com/scientificreports
OPEN Long‑term conservation agriculture
and best nutrient management
improves productivity
and profitability coupled with soil
properties of a maize–chickpea
rotation
Vijay Pooniya1*, R. R. Zhiipao1, Niraj Biswakarma1, S. L. Jat2, Dinesh Kumar1, C. M. Parihar1,
K. Swarnalakshmi1, Achal Lama3, A. K. Verma1, Debasish Roy1, Kajal Das4, K. Majumdar5,
T. Satyanarayana6, R. D. Jat7, P. C. Ghasal8, Hardev Ram9, Rajkumar Jat10 & Amlan Nath1
Conservation agriculture (CA)-based practices have been promoted and recouped, as they hold the
potential to enhance farm profits besides a consistent improvement in soil properties. A 7 years’ field
experiment consisting of three crop establishment practices viz., zero-till flatbed (ZTFB), permanent
beds (PNB), conventional system (CT) along with the three-nutrient management; nutrient expert-
based application (NE), recommended fertilization (RDF), and farmers’ fertilizer practice (FFP), was
carried out from 2013 to 2020. The CA-based practices (ZTFB/PNB) produced 13.9–17.6% greater
maize grain-equivalent yield (MGEY) compared to the CT, while NE and RDF had 10.7–20% greater
MGEY than the FFP. PNB and ZTFB gave 28.8% and 24% additional net returns than CT, while NE
and RDF had 22.8% and 17.4% greater returns, respectively over FFP. PNB and ZTFB had 2.3–4.1%
(0.0–0.20 m soil layers) lower bulk density than the CT. Furthermore, microbial biomass carbon (MBC)
increased by 8–19% (0.0–0.50 m soil layers) in ZTFB/PNB over the CT, and by 7.6–11.0% in NE/RDF
over FFP. Hence, CA-based crop establishment coupled with the NE or RDF could enhance the yields,
farm profits, soil properties of the maize–chickpea rotation, thereby, could sustain production in the
long run.
The importance of conventional rice–wheat cropping system (RWCS) in the Indo-Gangetic Plains (IGPs) in
securing food and nutrition has been negated due to the greater water requirement and exacerbating soil fertility
status1 coupled with the higher production costs and inefficient inputs u sages2,3. The ever-changing climate and
exaggerating soil degradation poses a constant threat to sustainability of the conventional farming practices.
The nutritional security of the inhabitants in the region is also impaired due to phasing out of pulses owing to
enhanced adoption of a policy backed RWCS. To redress these effects, conservation agriculture (CA)-based
practices have been propounded to restore the degrading soil fertility, enhance the resource use efficiency and
crops yield i mprovement4.
Maize (Zea mays L.), an emerging versatile crop with wider adaptability and photo-insensitivity under the
different ecological scenarios, may replace the rice crop in the wet season. It has the potential to address issues
1
ICAR-Indian Agricultural Research Institute (IARI), New Delhi 110 012, India. 2ICAR-Indian Institute of Maize
Research (IIMR), PAU Campus, Ludhiana, Punjab 141 004, India. 3ICAR-Indian Agricultural Statistics Research
Institute (IASRI), New Delhi 110 012, India. 4ICAR-Central Research Institute for Jute and Allied Fibers, Barrackpore,
West Bengal 700120, India. 5African Plant Nutrition Institute (APNI), 43150 Benguérir, Morocco. 6International
Plant Nutrition Institute (IPNI) Centre, New Delhi 110 012, India. 7Chaudhary Charan Singh Haryana Agricultural
University (CCSHAU), Hisar, Haryana 125004, India. 8ICAR-Indian Institute of Farming Systems Research (IIFSR),
Modipuram, Meerut 250 110, India. 9ICAR-National Dairy Research Institute (NDRI), Karnal, Haryana 132001,
India. 10Borlaug Institute for South Asia (BISA), Samastipur, Bihar 848125, India. *email: vijay.pooniya@icar.gov.in
Scientific Reports | (2021) 11:10386 | https://doi.org/10.1038/s41598-021-89737-9 1
Vol.:(0123456789)www.nature.com/scientificreports/
such as food and nutritional security5, water scarcity, and climate change4. Also, there is an increasing demand
for maize in the industrial sector with the increased population pressure6. Similarly, chickpea (Cicer arietinum)
is a protein-rich (17–22% of total dry seed mass, and best among all legume proteins) legume, harvested area
~ 13.7 m ha with an annual production of ~ 14.2 m t globally7, with the most production centered in India.
Maize-based rotations with improved soil and crop management practices have proved a better alternative over
RWCS through the realization of better system yields, enhanced soil properties, better utilization and savings
of irrigations along with the reduced labor c osts8. The development of single cross high yielding maize hybrids
coupled with the energy-efficient chickpea genotypes have given an ample scope for diversifying the existing
cereal-cereal rotations. The inclusion of chickpea in a cereal-based rotation helps in sustaining the soil health
and system yields further. It may also help in saving the water over the RWCS.
The conventional crop production model has been deemed unsustainable, as it is less energy efficient, con-
sumes more water with lesser productivity, employs improper inputs usage, and obsolete crop establishment
methods9,10. Consequently, poor residue management under conventional tillage (CT) practices compelled the
farmers either to burn them in-situ or feed to the c attle11,12. Moreover, intensive tillage not only degrades the
soil organic matter due to the enhanced oxidation but also disrupts the organic carbon (SOC), hence impairs
the soil properties13. The mismanagement and the exacerbating environment through CT practices could be
reoriented by adhering to the CA-based practices i.e., no- or minimum tillage, residue retention, and diversifying
the crops, thereby, enhancing the soil health and yields14,15. Also, adoption of the CA-based crop establishment
practices (CEP) in different rotations significantly improves the water use e fficiency16, system y ields12, and net
returns10,13,17. Besides, it improved the soil physical p roperties18,19, built up the SOC20,21, and enhanced the soil
22
microbial biomass carbon (MBC) .
Nutrient management in maize–chickpea rotation in the CA-based systems needs to be tailored by accounting
for the contribution through the residue retention, atmospheric N-fixation, and residual soil fertility rather than
following the usual blanket recommendation. The nutrient expert (NE) based site-specific nutrient management
focuses on balanced and crop-need based nutrition23–25 and helps in increasing the nutrient use efficiency and
provide more profits. This is fundamentally based on the internal nutrient efficiency and gives recommendations
based on the QUEFTS (quantitative evaluation of the fertility of tropical soils) model. International Plant Nutri-
tion Institute (IPNI), the NE is user-friendly software that could enhance and sustain the productivity apace with
the improved soil health26–28. Initially, it was hypothesized that using the NE would enhance the yields and reduce
the fertilizer use, and this hypothesis was validated at multi-locations (n = 104) field trials in the southern Indian
states by the All India Coordinated Research Project and International Plant Nutrition Institute on maize. The
positive results of these validation trials showed that the field-specific fertilizer recommendations based on NE
not only increased the crop yields but also optimized the fertilizer application r ates29–31.
However, the impacts of CA-based CEP coupled with the precise nutrient management using NE in
maize–chickpea rotation (MCR) are yet to be evaluated. Therefore, this study was undertaken for 7 years
(2013–2020) to assess the impacts of the conservation agriculture and nutrient management practices on the
system yields, farm economics, and soil properties in the MCR of north-western India.
Results
Weather parameters during the study period. During the cropping seasons (July–April), the highest
rainfall of 1368 mm was received in 2013–2014, followed by 1230.2 mm in 2016–2017, while only 600–900 mm
was received in 2014–2015, 2015–2016, 2017–2018, 2018–2019 and 2019–2020. Most of the rainfall was received
during the three months (July–September), accounting for nearly 80% of the total rainfall. During winters, the
common occurrence of the western disturbances in north-western India resulted in very little rainfall. The
amount of rainfall received during October–April was least in 2015–2016 (22 mm) and 2017–2018 (39.4), while
100–350 mm was received in the rest of the years (Supplementary Table 1).
Seven years’ trends and pooled grain and stover yields of maize. The CEP had a significant
(p < 0.05) effect on the grain and stover yields of maize over the study years. In this study, the initial years showed
a reduction in the grain yield, but from the third year onward, the yield increased significantly in the CA over
the CT. Grain yield under the zero-tilled flatbed (ZTFB) and permanent beds (PNB) significantly outperformed
the CT across the years, except during 2014 and 2015, whereas, the CT had a similar yield to the ZTFB in 2013
(Fig. 1a). Across the years, nutrient expert (NE) and the recommended fertilization (RDF) resulted in a similar
yield but being significantly superior to the farmer fertilizer practices (FFP). However, the NE had a significantly
higher yield over the RDF during 2019 (Fig. 1b). Based on the pooled data, the PNB and ZTFB had similar grain
yield, which was 13.3% and 12.7% higher over the CT, respectively. Similarly, the NE and RDF recorded signifi-
cantly higher pooled grain yield by 25.7% and 22.3% than the FFP, respectively (Table 1).
In all the years, the ZTFB and the PNB had similar stover yields, but being significantly higher than the CT
(Fig. 1c), and had 12.4% and 12.2% higher pooled yield over the CT, respectively. The stover yield under the NE
and RDF, was significantly higher over the FFP across the years, whereas the NE also had a significantly better
stover yield than the RDF, except during 2017 and 2018 (Fig. 1d). The 7 years’ average showed that the NE and
RDF produced 25.8% and 17.6% higher stover yields than the FFP, respectively (Table 1).
Seven years’ trends and pooled seed and stover yields of chickpea. In all the years, the PNB pro-
duced maximum seed yield, except in 2016–2017 (Fig. 2a), followed by the ZTFB. The NE was the best, except
during 2017–2018 and 2018–2019, with no difference among the FFP, RDF, and NE in 2014–2015, 2015–2016,
2017–2018, and 2018–2019 (Fig. 2b). The PNB had 10.8% and 21.5% greater pooled seed yield than the ZTFB
and CT, respectively (Table 1).
Scientific Reports | (2021) 11:10386 | https://doi.org/10.1038/s41598-021-89737-9 2
Vol:.(1234567890)www.nature.com/scientificreports/
(a) ZTFB PNB CT (b) FFP RDF NE
6.0 6.0
5.0 5.0
Grain (Mg ha-1)
Grain (Mg ha-1)
4.0 4.0
3.0 3.0
2.0 2.0
1.0 1.0
2013 2014 2015 2016 2017 2018 2019 2013 2014 2015 2016 2017 2018 2019
ZTFB PNB CT FFP RDF NE
(c) 10.0 (d) 10.0
9.0 9.0
Stover (Mg ha-1)
Stover (Mg ha-1)
8.0 8.0
7.0 7.0
6.0 6.0
5.0 5.0
4.0 4.0
3.0 3.0
2013 2014 2015 2016 2017 2018 2019 2013 2014 2015 2016 2017 2018 2019
Figure 1. Seven years’ grain (a,b) and stover (c,d) yields trend of the maize under the CA-based CEP and
nutrient management in the maize–chickpea rotation. The vertical bars indicate the LSD at p = 0.05.
Maize Chickpea
Treatment Grain Stover SYI Seed Stover SYI
CET practices
ZTFB 4.34a# ± 0.33 7.22a ± 0.63 0.91a 1.41b ± 0.69 4.58b ± 0.56 0.78b
a a a a a
PNB 4.37 ± 0.40 7.24 ± 0.43 0.93 1.58 ± 0.70 4.87 ± 0.57 0.89a
CT 3.79b ± 0.29 6.34b ± 0.69 0.79b 1.24c ± 0.48 4.08c ± 0.44 0.68c
Nutrient management
FFP 3.44c ± 0.46 5.84c ± 0.81 0.61c 1.31b ± 0.63 4.06c ± 0.60 0.82c
RDF 4.43a ± 0.30 7.09b ± 0.55 0.82a 1.43a ± 0.65 4.43b ± 0.56 0.90a
NE 4.63a ± 0.29 7.87a ± 0.41 0.86a 1.49a ± 0.57 5.03a ± 0.42 0.94a
Table 1. Seven years’ mean grain/seed and stover yields (Mg ha−1) (± S.D.) and sustainable yield index (SYI)
under the CA-based CEP and nutrient management in the maize–chickpea rotation. # Means followed by a
similar uppercase letter within a column is not significantly different (p < 0.05) according to Tukey’s HSD test.
The PNB and ZTFB had similar chickpea stover yield, being significantly (p < 0.05) greater than the CT, but in
2014–2015, 2015–2016, and 2019–2020, the ZTFB was at par to the CT (Fig. 2c). In contrast, the NE recorded a
significantly greater stover yield than the RDF and FFP but was at par with the RDF in 2019–2020 (Fig. 2d). The
PNB had registered maximum stover yield, which was significantly higher over the ZTFB and CT. However, the
NE had 11.9% and 19.3% greater stover yield over the RDF and FFP, respectively (Table 1).
System productivity as maize grain equivalent yield (MGEY). The PNB had significantly (p < 0.05)
greater MGEY over the ZTFB (2013–2014, 2018–2019) and CT, but in 2014–2015 and 2015–2016; no significant
difference among CEP practices was observed. Thereafter, in 2016–2017, the ZTFB had significantly higher
MGEY (10.7–21.4%) compared to the PNB and CT; while in 2017–2018 and 2019–2020, the ZTFB and PNB had
similar yields (Fig. 3a). In nutrient management, the NE and RDF were comparable for the MGEY across the
years but significantly greater than the FFP. However, in 2019–2020, the RDF and FFP had similar MGEY. Aver-
aged across the 7 years, the ZTFB and PNB produced 13.9% and 17.6% greater MGEY than the CT, however, the
NE and RDF gave 10.7% and 20% greater MGEY than the FFP, respectively (Fig. 3b).
Interaction effect (CEP × nutrient) on the MGEY. The CEP and nutrient management had a significant
(p < 0.05) interaction effect on the MGEY across the years. In 2013–2014, the PNB–NE had maximum MGEY,
and at par with the PNB–RDF and CT–RDF. Similarly, in 2014–2015, the PNB–NE produced the highest MGEY
but did not differ from the PNB–RDF, ZTFB–NE, ZT–RDF, and CT–NE. In 2015–2016, the PNB–NE had a
similar yield to all the treatment combinations, except CEP with FFP. In contrast, the ZTFB–NE had the greatest
MGEY during 2016–2017, 2017–2018, and 2019–2020. However, it was at par with the RDF and NE, irrespective
of the CEP during 2016–2017, 2017–2018, and 2019–2020. Whereas in 2018–2019, the PNB–NE exhibited the
Scientific Reports | (2021) 11:10386 | https://doi.org/10.1038/s41598-021-89737-9 3
Vol.:(0123456789)www.nature.com/scientificreports/
ZTFB PNB CT FFP RDF NE
(a) (b)
4.0 3.0
2.5
3.0
Seed (Mg ha-1)
Seed (Mg ha-1)
2.0
2.0 1.5
1.0
1.0
0.5
0.0 0.0
2013-14 2014-15 2015-16 2016-17 2017-18 2018-19 2019-20 2013-14 2014-15 2015-16 2016-17 2017-18 2018-19 2019-20
ZTFB PNB CT FFP RDF NE
(c) 7.0 (d) 7.0
6.0 6.0
Stover (Mg ha-1)
Stover (Mg ha-1)
5.0 5.0
4.0 4.0
3.0 3.0
2.0 2.0
2013-14 2014-15 2015-16 2016-17 2017-18 2018-19 2019-20 2013-14 2014-15 2015-16 2016-17 2017-18 2018-19 2019-20
Figure 2. Seven years’ seed (a,b) and stover (c,d) yields trend of the chickpea under the CA-based CEP and
nutrient management in the maize–chickpea rotation. The vertical bars indicate the LSD at p = 0.05.
(a) ZTFB PNB CT (b) 16 FFP RDF NE
14 14
MGEY (Mg ha-1)
MGEY (Mg ha-1)
12 12
10 10
8 8
6 6
4 4
2
2
2013-14 2014-15 2015-16 2016-17 2017-18 2018-19 2019-20
2013-14 2014-15 2015-16 2016-17 2017-18 2018-19 2019-20
Figure 3. Seven years’ trend in the MGEY (a,b) under the CA-based CET and nutrient management in the
maize–chickpea rotation. The vertical bars indicate the LSD at p = 0.05.
Maize grain equivalent yield (MGEY, Mg ha−1)
Treatment 2013–2014 2014–2015 2015–2016 2016–2017 2017–2018 2018–2019 2019–2020
ZTFB–FFP 6.35cde ± 0.31 5.39c ± 0.12 3.79d ± 0.66 6.33bcde ± 1.18 9.18cd ± 1.23 9.5b ± 0.52 8.51c ± 0.45
ZTFB–RDF 6.76cd ± 0.15 6.26abc ± 0.69 5.48abc ± 0.36 7.84ab ± 0.80 11.5ab ± 1.54 10.9a ± 0.40 11.2bc ± 0.88
ZTFB–NE 7.54bc ± 0.37 6.82ab ± 1.10 6.08ab ± 0.60 8.83a ± 0.85 12.3a ± 0.69 11.1a ± 0.41 14.4a ± 4.59
PNB–FFP 5.82de ± 0.07 5.49bc ± 0.30 4.56bcd ± 0.71 5.79de ± 1.02 10.4bc ± 1.21 10.9a ± 0.77 10.1bc ± 0.84
PNB–RDF 9.07ab ± 0.12 6.63abc ± 0.67 6.72a ± 0.87 6.93bcd ± 1.67 11.8ab ± 1.26 11.3a ± 0.43 11.1bc ± 0.51
a a a abc ab a
PNB–NE 9.54 ± 0.77 7.48 ± 0.34 6.79 ± 0.70 7.81 ± 0.91 11.5 ± 1.27 11.6 ± 0.72 12.3ab ± 0.40
e bc cd e cd c
CT–FFP 4.96 ± 0.96 5.77 ± 1.64 4.48 ± 0.84 5.13 ± 0.61 9.12 ± 1.43 7.87 ± 0.29 9.16c ± 0.5
abc bc abc cde cd c
CT–RDF 7.93 ± 0.75 6.01 ± 0.13 5.81 ± 1.07 6.11 ± 0.70 9.64 ± 1.23 8.27 ± 0.09 8.73c ± 1.07
bc abc abc bcde d c
CT–NE 7.48 ± 0.19 6.29 ± 0.29 5.82 ± 0.68 6.84 ± 0.49 8.34 ± 0.81 7.89 ± 0.37 9.16c ± 0.49
Table 2. Interaction effect of the CA-based CEP and nutrient management on the system productivity (± S.D.)
in terms of MGEY during the 7 years of the study in the maize–chickpea rotation. Means followed by a similar
uppercase letter within a column is not significantly different (p < 0.05) according to Tukey’s HSD test.
highest MGEY, and significantly greater than the ZTFB–FFP and CT (Table 2). The results of the current study
also suggested that the NE and RDF either with the PNB or ZTFB tended to have relatively more MGEY than
the with CT.
Scientific Reports | (2021) 11:10386 | https://doi.org/10.1038/s41598-021-89737-9 4
Vol:.(1234567890)www.nature.com/scientificreports/
Variable production costs (US$ ha−1 year−1) System net returns over production costs (US$ ha−1 year−1)
2013– 2014– 2015– 2016– 2017– 2018– 2019– 2013– 2014– 2015– 2016– 2017– 2018– 2019–
Treatment 2014 2015 2016 2017 2018 2019 2020 2014 2015 2016 2017 2018 2019 2020
CET practices
ZTFB 470c 513c 517c 508c 580c 532c 601c 1104b 945ab 754a 1672a 2086a 2204b 2196a
b b b b b b b a a a b a a
PNB 476 520 525 516 585 548 622 1362 1025 865 1513 2126 2378 2429a
a a a a a a a c b b c b c
CT 554 614 630 621 694 642 724 979 805 575 1327 1499 1551 1593b
Nutrient management
FFP 475c 525c 535c 530c 609c 563c 636c 828b 775b 479b 1263c 1707b 1910b 1878c
RDF 516a 565a 573a 560a 626a 581a 658a 1269a 926ab 804a 1527b 2018a 2100a 2055b
NE 508b 556b 564b 554b 624a 578a 653a 1349a 1074a 911a 1723a 1986a 2123a 2285a
Table 3. Economics of the maize–chickpea rotation under the CA-based CEP and nutrient management
during the 7 years of the study. Means followed by a similar uppercase letter within a column is not
significantly different (p < 0.05) according to Tukey’s HSD test. Price of one US $ = 62.9 INR2013–2014; 60.9
INR2014–2015; 64.2 INR2015–2016; 68 INR2016–2017; 64 INR2017–2018; 74 INR2018–2019; 70 INR2019–
2020.
(a) ZTFB PNB CT (b) 18 FFP RDF NE
18
16
16
SWP (kg ha-1mm-1)
SWP (kg ha−1mm−1)
14 14
12 12
10
10
8
8
6
4 6
2013-14 2014-15 2015-16 2016-17 2017-18 2018-19 2019-20 2013-14 2014-15 2015-16 2016-17 2017-18 2018-19 2019-20
Figure 4. Seven years’ trends of SWP (a,b) in the CA-based CEP and nutrient management under the maize–
chickpea rotation. The vertical bars indicate the LSD at p = 0.05.
Farm economics. The 7 years’ mean data indicated that the CT (US$ 639.9 ha−1) was the most expensive
CEP, which was 15.3% and 16.9% costlier than the PNB (US$ 541.7 ha−1) and ZTFB (US$ 531.6 ha−1), respec-
tively. Likewise, the RDF (US$ 582.7 ha−1) accounted for the highest cultivation cost, closely followed by the
NE (US$ 576.7 ha−1), being 5% and 4.1% higher over the FFP (US$ 553.3 ha−1), respectively. In all the years, the
PNB had the highest net returns, whereas, in 2016–17, the ZTFB accounted for the greater returns. However, the
ZTFB and PNB did not differ for the system net returns, except during 2013–2014, 2016–2017, and 2018–2019.
The PNB (US$ 1671.1 ha−1) and ZTFB (US$ 1565.9 ha−1) had generated 28.8% and 24% higher net returns
than the CT (US$ 1189.8 ha−1), respectively. Similarly, the NE (US$ 1635.9 ha−1) and RDF (US$ 1528.4 ha−1) had
22.8% and 17.4% greater net returns than the FFP (US$ 1262.9 ha−1) (Table 3), respectively.
Sustainable yield index (SYI). Among the CEP in maize, the PNB had the greater SYI, but being at par
to the ZTFB, which was 15% and 13.2% greater than the CT. Further, SYI in maize was the highest under the
NE, similar with RDF, being 29.1% and 25.6% greater than the FFP. In the case of chickpea, the SYI was highest
under the PNB, which was 12.4% and 23.6% higher than the ZTFB and CT, respectively. The SYI in the NE and
RDF were at par, being 8.9–12.8% greater than the FFP in chickpea (Table 1).
System water productivity (SWP). During the first 3 years of the study, the PNB (10.1–11.5 kg ha-mm−1)
led to the highest SWP, which was significantly higher than the ZTFB (8.7 kg ha-mm−1) and CT (7.2–
7.7 kg ha-mm−1), respectively. Whereas, fourth year onward, the PNB (8.4–16.1 kg ha-mm−1) had a similar
SWP to the ZTFB (9.7–15.7 kg ha-mm−1), but significantly higher than the CT (5.7–11.1 kg ha-mm−1) (Fig. 4a).
Among nutrient management, the NE and RDF had similar SWP, except during 2013–2014, 2016–2017, and
2019–2020 however, it was 20% and 14% (7 years’ mean) greater than the FFP (Fig. 4b).
Soil bulk density (ρb), organic carbon (SOC) and microbial biomass carbon (MBC). After har-
vest of the seventh season maize, soil samples were collected from the 0.0–0.50 m soil depth (Fig. 5a). Among the
CEP, the PNB and ZTFB had significantly lower ρb than the CT up to the 0.20 m soil depth. The decrement was
to the tune of 2.3–4.1% over the CT, though there was no difference in the ZTFB and PNB. In contrast, beyond
the 0.20 m soil depth, ρb did not differ significantly among the CEP (Fig. 5a). Across the soil profile, nutrient
management practices were at par for ρb (Fig. 5b). The CEP had a significant (p < 0.05) impact on the SOC up
to the 0.20 m soil depth, the ZTFB and PNB were at par, but greater than the CT at 0.0–0.20 m depth. However,
Scientific Reports | (2021) 11:10386 | https://doi.org/10.1038/s41598-021-89737-9 5
Vol.:(0123456789)www.nature.com/scientificreports/
pb (Mg m-3) pb (Mg m-3)
(a) 1.3 1.4 1.5 1.6 1.7 (b) 1.4 1.5 1.6 1.7
0.0 0.0
0.1 0.1
Depth (m)
Depth (m)
0.2 0.2
0.3 0.3
0.4 0.4 FFP
ZTFB
0.5 PNB 0.5 RDF
CT NE
0.6 0.6
OC (%) OC (%)
(c) 0.2 0.3 0.4 0.5 0.6 (d) 0.2 0.3 0.4 0.5 0.6
0.0 0.0
0.1 0.1
Depth (m)
0.2 0.2
Depth (m)
0.3 0.3
0.4 0.4 FFP
ZTFB
0.5 RDF
PNB 0.5
NE
0.6 CT 0.6
MBC (μg g-1 soil) MBC (μg g-1 soil)
(e) 0 100 200 300 400 500 (f) 0 100 200 300 400 500
0.0 0.0
0.1 0.1
Depth (m)
Depth (m)
0.2 0.2
0.3 0.3
0.4 0.4
ZTFB FFP
0.5 PNB 0.5 RDF
0.6 CT NE
0.6
Figure 5. Soil pb (a,b), OC (c,d) and MBC (e,f) under the CA-based CEP and nutrient management after 7th
season maize in the maize–chickpea rotation. The horizontal bars indicate the LSD at p = 0.05.
there was no difference in the 0.20–0.50 m soil section (Fig. 5c). The NE and RDF had similar values for the SOC,
but significantly greater than the FFP at 0.0–0.10 m depth, however, the SOC did not differ among the nutrient
management beyond the 0.10 m soil depth (Fig. 5d).
At the silking stage of the seventh season maize, the ZTFB and PNB had similar values for the MBC, but
significantly greater by 8.3–20.3% than the CT at 0.0–0.30 m soil depth (Fig. 5e). Likewise, the NE and RDF had
similar MBC, but significantly greater than the FFP at 0.0–0.10 m depth. However, beyond the 0.10 m soil depth,
these practices did not show a significant influence on the MBC (Fig. 5f).
The ZTFB and PNB had 18.8–19.8% higher SOC stock (Mg ha−1) at 0.10 m soil layer, but in the at 0.10–0.50 m
soil depth, CEP did not have a significant impact on it, though relatively greater values across the depths were
recorded in the ZTFB/PNB than the CT. Nevertheless, the total SOC stock up to the 0.50 m soil depth was
10.9–14.2% greater with ZTFB/PNB than the CT (Fig. 6a). The NE had the highest SOC stock across the soil
layers (0.0–0.50 m), which was similar to the RDF, but 6.7% greater than the FFP (Fig. 6b).
Discussion
Diversifying the existing dominant rice–wheat cropping system (RWCS) towards maize-based, particularly
maize followed by legumes under the CA-based CEP (ZTFB/PNB) along with the balanced nutrition, could
enhance and stabilize yields and the farm p rofits12,32 besides the improved soil properties in long-run33. RWCS
in the IGPs of South Asia is facing challenges of exaggerating decline in the groundwater table and the input use
efficiencies34. Henceforth, maize–chickpea rotation (MCR) has the potential to combat the twin challenges of the
declining groundwater by 30–40 cm year−135, and the import of pulses for nutritional security. In this study, the
CA-based CEP had greater maize (12–13%) and chickpea (12–21%) yields across the years over the CT. It could
be associated with the commendatory soil temperature/moisture c onditions36, improved soil p roperties13,37, better
18 38
water and nutrient u ses besides, amalgamating the effects of the residue r etention . Further, these practices
also help in the better retention and infiltration of the water and favour better growing conditions that may have
resulted in greater crop yields.
Scientific Reports | (2021) 11:10386 | https://doi.org/10.1038/s41598-021-89737-9 6
Vol:.(1234567890)www.nature.com/scientificreports/
C stock (Mg ha-1) C stock (Mg ha-1)
(a) 0 1 2 3 4 5 6 7 8 (b) 0 1 2 3 4 5 6 7 8
0.1 0.1
0.2
Depth (m)
Depth (m)
0.2
0.3 0.3
0.4 ZTFB 0.4 FFP
PNB RDF
0.5 0.5
CT NE
Figure 6. Effect of tillage (a) and nutrient management (b) on SOC stocks (equivalent soil mass basis) of
maize–chickpea rotation. The vertical bars indicate LSD at p = 0.05.
Despite the wide variability in the precipitation (excess/deficit ranis) during the study, the PNB/ZTFB
recorded ~ 13.9–17.6% (7 years mean) greater MGEY than the CT. The MGEY had strong relationship with the
SOC stock under the CA-based CEP ( r2 = 0.87; p < 0.05) and the nutrient management ( r2 = 0.94; p < 0.05). So,
due to the improved levels of SOM/SOC stocks and other soil properties, reinforcing the previous findings in the
cereal-based rotations9,10,19. In this study, relatively higher mean yields were exhibited in the NE, however being
comparable to the RDF. The yield differences in the NE and RDF could be due to the variation in the fertilizer
rates, besides the NE entailed applications of the balanced and location-specific, which is fundamentally based
on the nutrient carrying capacity, thereby it may have enhanced the internal nutrient efficiency12,19,39. Possibly,
optimal nutrition would have led to the better partitioning of the photosynthates, thereby, more vigorous plant
growth with the stiffer rooting and greater resistance against the abiotic stresses40. Residual fertility in the NE
and RDF was outlined with the higher chickpea yield over the FFP. Results of multi-location trials in South Asia
had shown that the NE gave greater yields under the CA than the CT s ystem24,30,41.
The feasibility of any technology/management practice could be assessed ultimately through farm economics.
In this study, the CT incurred a higher cultivation cost by US$ 84–123 ha−1 compared to the ZTFB/PNB. This
higher cost in CT was mainly attributed to the additional tillage10, apart from the higher labour cost needed
for extra intercultural operations. On the contrary, the increment in the returns under the ZTFB/PNB was to
the tune of US$ 380–481 ha−1 over the CT. The CT had the higher farm cultivation cost with the lower MGEY,
which in turn reflected in the lower net returns10,42,43. Greater net returns under the NE could be due to a bal-
anced and crop need based fertilizer a pplication24,25 resulting in more yields, and the returns. The comparative
field studies (n = 82) of the NE with the state recommendation and FFP in Southern India, reasoned out that,
farmers’ risk could well be reduced, when the NE was adopted, as it directs and provides a proper and balanced
rate of f ertilizers30. Hence, optimized nutrient uses apace with the higher yields and profitability under the maize
and maize-based rotations.
Concerning SWP, the ZTFB and PNB had 25.6% and 30.9% greater values than the CT, which could be
ascribed to the better soil moisture regimes due to the surface residue retention coupled with a higher yield
gains37,44. Furthermore, higher SOC stock in the CA-based CEP enhanced the moisture retention and opportune
time for the water movement in soil45,46, hence it facilitates a greater water and nutrient acquisition and ultimately
SWP. The major impacts of the CA-based CEP are conspicuous through higher SOM, especially in the topsoil
layers apace with the better soil structural stability and biological diversity in contrast to the CT s ystems47. After
7 years, the ZTFB and PNB with residues improved the OC stock at 0.0–0.10 m depth by 18.8–19.8%, and total
OC stock by 10.9–14.2% than the CT. This would be associated with better physical protection of particulate
organic matter; greater residues remain on the soil surface coupled with a lesser turnover of macro-aggregates
as well as minimal contact between residue and s oil48. Extensive tillage reduces SOC, as it breaks open the
previously protected organic matter leading to increased microbial d ecay49,50, as observed under the CT sys-
tem. The implications of the higher SOC under the NE/RDF could well be attributed to the proper growth and
development of the crop, hence greater above/below-ground biomass production, and eventually the increases
in organic matter over the FFP.
The effect of the CA-based CEP on the bulk density (ρb) had shown contradictory results, with some stud-
ies reported higher ρb51,52, on the contrary, some had reported lower ρb53 or no changes54,55 relative to the CT
system. Nevertheless, in our study, the ZTFB/PNB with residues brought down soil ρb by 2.3–4.1% in the top
0.0–0.20 m soil layer, while the nutrient management did not differ for soil ρb. The lower ρb associated with the
residues retention leads to greater soil faunal a ctivities51,53, thereby, resulting in better soil aggregation and poros-
ity. In contrast, the increased ρb under the CT is due to the compaction particularly in the plough soil layer13,19.
The MBC depicts the nutrient cycling ability of soil under different management practices56,57 in concurs with
the organic matter content. The CA-practices coupled with the NE/RDF favours build-up of the SOC through,
rhizo-deposition of root stubbles39,58, which certainly increased the MBC59 and crop yields60,61. Besides, the
greater organic matter would expedite the soil MBC and other biological a ctivities62. This 7 years’ study indicates
synergy between the CA-based CEP and NE or RDF through improvements in yields, MGEY, farm returns, and
SWP apart from the soil properties. Also, this is well supported by a greater SYI, hence could be propounded
for its adoption at present and in posterity.
Scientific Reports | (2021) 11:10386 | https://doi.org/10.1038/s41598-021-89737-9 7
Vol.:(0123456789)www.nature.com/scientificreports/
S. no. Treatment Treatment notations Residue/nutrient management
a−1 and
Chickpea (root stubbles + above ground) residues ~ 2.5 Mg h
1 Zero till flat bed ZTFB
maize stubbles of ~ 0.40 m height from ground were retained
a−1 and
Chickpea (root stubbles + above ground) residues ~ 2.5 Mg h
2 Permanent beds (0.37 m beds and 0.30 m furrows) PNB
maize stubbles of ~ 0.40 m height from ground were retained
3 Conventional tillage CT Full residue removed and conventional tillage practices followed
4 Farmer’s fertilizers practice FFP Maize: 110:13:2.0 kg NPK ha–1; chickpea: 18:20:0 kg NPK ha–1
5 Recommended dose of fertilizers RDF Maize: 150:26.2:50 kg NPK ha–1; chickpea: 20:26.2:16.6 kg NPK ha–1
Nutrient expert assisted: site-specific nutrient management (7 years’
6 NE Maize: 130:19.5:55 kg NPK ha–1; chickpea: 20:26.2:16.6 kg NPK ha–1
mean)
Table 4. Description of the crop establishment practices (CEP) and nutrient management adopted in the
maize–chickpea rotation during the 7 years of experimentation.
Conclusions
The CA-based CEP (ZTFB/PNB) apace with the enhanced resource use-efficiency should be a norm, not the
exception, as clearly outlined in our 7 years’ experiment, wherein, the ZTFB/PNB with the NE or RDF excelled
for the system yields, net returns, SWP, ρb, SOC and SYI. The 7 years’ mean showed that the MGEY under the
ZTFB and PNB increased by 13.9–17.6%, respectively compared to the CT, however, the NE and RDF registered
10.7–20% greater MGEY than the FFP. Furthermore, the CA-based CEP along with the NE or RDF gave an
additional net return of US$ 376–481 ha−1 year−1 and US$ 265–373 ha−1 year−1 (7 years’ av.) than the CT–FFP,
respectively. Also, these practices significantly improved the SOC stock (18.8–19.8%) and MBC (8–19%) with
lower ρb (2.3–4.1%) in the topsoil layers. The improved soil properties coupled with the greater yields was well
substantiated with the simultaneous improvement in SWP under the ZTFB (7.5%) and PNB (30.8%). The greater
SYI also signified the superiority and sustainability of the rotation in the long-run. Thus, the ZTFB/PNB with
the NE or RDF in the maize–chickpea rotation can be well adopted in the semi-arid Indian ecologies to realize
its several benefits under the changing climate.
Materials and methods
Experimental site. A field experiment on the maize–chickpea rotation (MCR) was established during the
rainy season of 2013 at the research field of the ICAR-Indian Agricultural Research Institute (28° 38′ N; 77°
09′ E; 228.6 m MSL), New Delhi, India. Before the establishment of this study, a uniformity field trial on wheat
was conducted during the winters of 2012–2013 (November–April). The climate of the region is semi-arid and
experiences the dry-hot summers and cold winters. During the growing season of maize (July–October) and
chickpea (October–April), the maximum rainfall of 1368 mm was received in 2013–2014, while the lowest of
only 604.6 mm in 2017–2018. On average, ~ 80% of the total rainfall was received from the southwest monsoon
(July–September), and the average relative humidity across the years ranged between 69 and 87%. The minimum
and maximum temperatures during the cropping period ranged from 5 to 28 °C and 18–38 °C, respectively
(Supplementary Table 1). The Typic Haplustept sandy loam soil of the experimental site had 7.31 pH, 0.40%
Walkley–Black carbon63, 159.9 kg ha−1 alkaline KMnO4 oxidizable-N64, 15.6 kg ha−1 NaHCO3 extractable-P65,
and 161.3 kg ha−1 NH4OAc extractable-K66.
Experimental treatment details. This field experiment consisted of the combinations of three CEP;
zero-till flatbed (ZTFB), permanent beds (PNB) and conventional tillage (CT) in main-plots, and three nutrient
management practices; farmers’ fertilizer practices (FFP), recommended fertilization (RDF), and nutrient expert
assisted-site specific nutrient management (NE) in sub-plots. A split-plot design was employed for the fixed plot
experiment with three replicates during the entire study period (Table 4). Before the start of the experiment, the
field was deeply ploughed using a chisel plough (~ 0.30–0.45 m) and laser leveled. The CT plots involved one
ploughing (~ 0.25–0.30 m), followed by harrowing/rotavator (~ 0.15–0.20 m) and then leveling, while for the
ZTFB, no ploughing was accomplished. Initially, the PNB was prepared using the ridge maker (0.67 m), and
subsequently the disc coulter once in year before the maize sowing for the reshaping of the beds during each
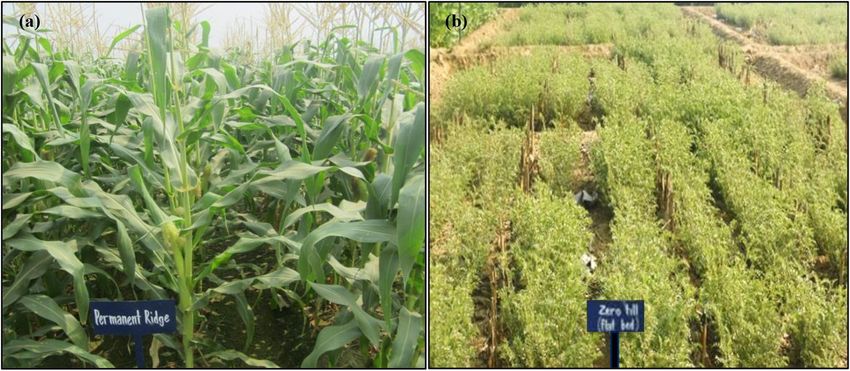
following crop season. The gross plot size under each CEP practice was 20 m × 8.5 m. Maize at maturity was har-
vested from 0.40 m height and standing residues were retained in the field under the ZTFB/PNB plots. Similarly,
the chickpea residues ~ 2.5 Mg ha−1 (root stubbles along with the above-ground stover) on a dry weight basis
were retained in the plots (Fig. 7).
Crop management practices. A quality protein maize hybrid ’HQPM1’ was used for the experiment,
which was later replaced by the hybrid ’PMH1’ in 2017. In each cropping season, the maize seeds were dibbled
manually in the rows at a spacing of 0.67 × 0.20 m during the first week of July. Similarly, sowing of the chickpea
genotype ’Pusa 372’ was done at the end of October in each year i.e., after the maize harvest. Under the RDF
practice, a full dose of phosphorous (P) by di-ammonium phosphate (DAP) and potassium (K) using muriate
of potash along with the nitrogen (N) was applied as basal to both the maize and chickpea crops, after that two
equal N splits to maize were applied at the knee-high and flowering stages. The fertilizer doses for FFP were
based on the Participatory Rural Appraisal (PRA) i.e., how most of the farmers’ in the region follow fertilization
to the crops. While, for NE treatment, fertilizer rates/splits were followed as per the NE software, available at
the http://www.ipni.net. Fertilizers were placed basally in the topsoil layer, while the required N was top-dressed
Scientific Reports | (2021) 11:10386 | https://doi.org/10.1038/s41598-021-89737-9 8
Vol:.(1234567890)www.nature.com/scientificreports/
Figure 7. Maize–chickpea rotation under the CA and nutrient management – PNB maize (a) and ZTFB
chickpea (b).
in bands near to the rows (side dressing). Since there is no NE for chickpea, hence, fertilizers were applied as
per the RDF in the NE sub-plots. The non-selective herbicide glyphosate at 1 kg ha−1 was sprayed about a week
before the sowing of the crops both in the ZTFB/PNB plots. A pre-emergence (2 days after sowing, DAS) atra-
zine (maize) and pendimethalin (chickpea) was sprayed; manual weeding’s were done in the CT. Crop protection
practices such as pest and disease management were followed as per the requirement of both crops. Irrigation
water was applied considering the rainfall pattern coupled with critical crop stages, in which maize crop received
three to six irrigations, while for chickpea it was one to two per crop season.
Soil sampling and processing. Five soil samples were collected from the 0.0–0.30 m depth (June 2013)
for initial analysis, and after harvest of 7th season maize from different soil sections i.e., 0.0–0.10, 0.10–0.20,
0.20–0.30, 0.30–0.40 and 0.40–0.50 m up to 0.50 m depth using the core. The samples were shade dried and
ground gently using the wooden pestle and mortar, sieved in a 2 mm sieve, and stored in the air-tight polythene
for further analysis of soil properties. For soil MBC analysis, the moist soil samples were collected using the tube
auger from 0.0–0.50 m depth at 0.10 m intervals at the silking stage of maize. Finely sieved soil samples were
stored at 5 °C (18–24 h) for MBC analysis.
Soil organic carbon. The soil organic carbon (SOC) was determined by the chromic acid wet oxidation
method63. The finely ground and sieved soil from the different depths (0.0–0.10, 0.10–0.20, 0.20–0.30, 0.30–0.40,
and 0.40–0.50 m) was used for its determination. The SOC in 0.10 m intervals up to 0.50 m soil depth was com-
puted by using Eq. (1)67
SOC stock Mg ha−1 = SOC (%)/100 × d (m) × ρb Mg m−3 × a (ha) (1)
where, d denotes the soil depth (m) and a is the area (ha).
The SOC stocks on an equivalent soil depth basis were estimated using the following equation:
SOC stock Mg ha−1 = total SOC content g kg−1 × ρb Mg m−3 × depth (m) × 10 (2)
To prevent bias due to variation in soil ρb (Mg m−3) and take into full account the effect of soil mass on SOC
stock68. Thus, we have calculated total SOC stocks on an equivalent soil mass (ESM) using formula69
Error term (ET) = total SOC concentration g kg−1 × (Msoil − ESM) × 10 (3)
where, Msoil is the soil mass and ESM is the equivalent soil mass
ESM Mg m−2 = initial soil ρb Mg m−3 × depth (m) (4)
Msoil Mg m−2 = soil ρb Mg m−3 × depth (m) (5)
Total SOC on ESM basis Mg ha−1 = total SOC on soil depth basis − ET (6)
Soil bulk density. Soil bulk density (ρb) was measured from the different soil sections to a profile depth of
0.50 m, and five samples were collected randomly from each plot using the core sampler. The collected samples
Scientific Reports | (2021) 11:10386 | https://doi.org/10.1038/s41598-021-89737-9 9
Vol.:(0123456789)www.nature.com/scientificreports/
were then dried at 105 °C for 48–72 h until a constant weight reached, and then the soil ρb (Mg m−3) was com-
puted using e quation4,7:
ρb = Ms/Vc (7)
where, Ms indicates the dry weight of the sample, and Vc is the volume of the core.
Soil microbial biomass carbon (MBC). The fumigation extraction70 method was employed to analyse
the MBC in soil samples. The pre-weighed soil samples were taken in a closed capped amber colour bottle and
fumigated with the ethanol-free chloroform. The un-fumigated samples were also taken in a transparent capped
bottle and maintained. Both the fumigated and non-fumigated samples were incubated in the dark for 24 h, after
which fumigated samples were evaporated by opening the cap and exposing it to the sun for ~ 20–25 min. and
later in a hot air oven at 50 °C for ~ 20 min. The processed samples were added 0.5 M K2SO4 (soil:extractant 1:4)
and kept on a mechanical shaker for 30 min. and soil suspension was filtered using the Whatman No. 42 filter
paper. The carbon content was determined through dichromate digestion superseded by back titration with
0.05 N ferrous ammonium sulphate, then the MBC content was computed using equation:
MBC (µg C g−1 soil) = EC × 2.64 (8)
where, EC = (C in fumigated soil – C in un-fumigated soil).
Yield measurements. During the 7 years of the experimentation, the crop yields were estimated from the
net plot area, leaving the border rows in both the crops. The border plot area was harvested first, and then the
net plot area for recording the grain/seed yields. The harvested maize cobs were sundried for 45–50 days and the
stover for about a month in the open field conditions and then threshed by a mechanical thresher. The chickpea
was harvested manually, and the harvested produce was sundried, then threshed using a tractor-drawn pull man
thresher. For grain yield, the moisture content was adjusted to ~ 12% in both crops. The stover/stalk yields were
obtained by subtracting the grain/seed yields from their respective total biomass yield. To estimate the system
productivity of MCR, chickpea seed yield was converted into the maize grain equivalent yield (MGEY) as given
in Eq. (9)10,61.
MGEY Mg ha−1 = Ym + {(Yc × Pc ) ÷ Pm } (9)
where, MGEY = maize grain equivalent yield (Mg ha−1), Ym = maize grain yield (Mg ha−1), Yc = chickpea seed yield
(Mg ha−1), Pm = price of maize grain (US$Mg−1) and Pc = price of chickpea seed (US$Mg−1).
Farm economics. The total production cost was computed based on the variable costs for each treatment.
The cost included human labour employed for different field operations, rental land value, use of machinery
viz. tractor, plough, planter, thresher, etc., fertilizers, seed, pesticides, other plant protection chemicals, irriga-
tions, and harvesting. The gross returns included the market value of both grain/seed and stover/stalk, wherein
the value of grain/seed was as per the minimum support price set by the Government of India during the
respective seasons. The net returns were computed using the formula: net returns (US$ ha−1) = [gross returns
(US$ ha−1) − cost of cultivation (US $ ha−1)]. Systems net returns were estimated by summing the net returns of
both the crops (MCR rotation). The economics data (production costs/returns) were then converted from the
Indian rupee (INR) to the US dollar (US$) based on the exchange rate during the respective years.
System water productivity (SWP). The SWP for the MCR across the years was computed by taking into
account the total water input (irrigation + rainfall) during the growing seasons. The amount of rainfall water
received was computed using the manual rain gauge data of meteorological observatories adjacent to the field.
Irrigation depth was measured by using an ordinary scale meter that had mm and cm marks. In each plot, the
depth of water was measured at ten selected spots immediately after the irrigation. Based on the rainfall pat-
tern, three to six irrigations were applied to the maize at the critical growth stages, while for chickpea one to
two irrigations per crop season was given at the late vegetative/pod development stages. The water productivity
(kg ha−1 mm−1) was computed as per Eq. (10)71. The system water productivity (SWP) was worked out by adding
the water productivity of both the crops
Water productivity = grain yield kg ha−1 total water applied (mm) (10)
Sustainable yield index (SYI). Singh et al. and Wanjari et al.72,73 described the SYI as a quantitative meas-
ure of the sustainability of any agricultural system/practice. Using this concept, sustainability could be inter-
preted on the based on standard deviation (σ), where the lower values of the σ indicate the higher sustainability
and vice-versa. Total crop productivity of maize and chickpea under different CEP and nutrient management
was computed based on the 7 years’ mean yield data. SYI was computed based on Eq. (11)73
SYI = −ya −σn−1 Y−1 (11)
m
where, −ya is the average yield of crops across the years under specific management practice, σn−1 is the standard
deviation and Ym−1 is the maximum yield obtained under set a of practice.
Scientific Reports | (2021) 11:10386 | https://doi.org/10.1038/s41598-021-89737-9 10
Vol:.(1234567890)www.nature.com/scientificreports/
Statistical analyses. The significance of the treatment effects was determined through analysis of
variance74. Pooled analysis was done for the grain/seed and stover yields after obtaining the significant differ-
ences in coefficient of variance of main and interaction effects over the years with the non-significant interaction
effects between the years and the treatments. Turkey’s significant difference test was employed as a post hoc
mean analysis at 5% level of significance using SAS 9.4 (SAS Institute, Cary, NC).
Authors have confirmed that all the plant studies were carried out in accordance with relevant national,
international or institutional guidelines.
Received: 23 December 2020; Accepted: 28 April 2021
References
1. Hobbs, P. R. & Gupta, R. K. Problems and challenges of no-till farming for the Rice–Wheat systems of the Indo-Gangetic Plains in
South Asia. In Sustainable Agriculture and the International Rice–Wheat System (eds Lal, R. et al.) 101–119 (Ohio State University;
Marcel Dekker Inc, 2004).
2. Saharawat, Y. S. et al. Evaluation of alternative tillage and crop establishment methods in a rice–wheat rotation in north-western
IGP. Field Crops Res. 116, 260–267 (2010).
3. Jat, R. K. et al. Seven years of conservation agriculture in a rice–wheat rotation of eastern Gangetic Plains of South Asia: Yield
trends and economic profitability. Field Crops Res. 164, 199–210 (2014).
4. Parihar, C. M. et al. Long-term conservation agriculture and intensified cropping systems: Effects on growth, yield, water, and
energy-use efficiency of maize in north-western India. Pedosphere 28(6), 952–963 (2018).
5. Shiferaw, B., Prasanna, B. M., Hellin, J. & Banziger, M. Crops that feed the world 6. Past successes and future challenges to the role
played by maize in global food security. Food Secur. 3, 30–327 (2011).
6. Srinivasan, G., Zaidi, P. H., Prasanna, B. M., Gonzalez, F. & Lesnick, K. eds. Proceedings of the Eighth Asian Regional Maize
Workshop: New Technologies for the New Millennium. Bangkok, Thailand, 5–8 August 2002. Mexico, D.F.: CIMMYT (2004).
7. FAO. FAOSTAT database 2019. http://www.fao.org/faostat/en/#data/QC (Accessed 17 April 2021). FAO, Rome (2019).
8. Aulakh, M. S. & Grant, C. A. Integrated Nutrient Management for Sustainable Crop Production (The Haworth Press, Taylor and
Francis Group, 2008).
9. Jat, S. L., Parihar, C. M., Singh, A. K., Jat, M. L. & Jat, R. K. Carbon sustainability and productivity of maize based cropping system
under conservation agriculture practices in Indo-Gangetic plains. In: Resilient food systems for a changing world, Proceedings of the
5th World Congress of Conservation Agriculture Incorporating 3rd Farming Systems Design Conference, Brisbane Australia, 26-29
September, 2011, p. 110–111 (2011).
10. Parihar, C. M. et al. Conservation agriculture in irrigated intensive maize-based systems of north-western India: Effects on crop
yields, water productivity and economic profitability. Field Crops Res. 193, 104–116 (2016).
11. Jat, M. L. et al. Crop residue management for sustainable production of maize (Zea mays) in dryland ecosystem. Chem. Sci. Rev.
Lett. 6(23), 1681–1686 (2017).
12. Pooniya, V. et al. Six years of conservation agriculture and nutrient management in maize–mustard rotation: Impact on soil
properties, system productivity and profitability. Field Crops Res. 260, 108002 (2021).
13. Gathala, M. K. et al. Effect of tillage and crop establishment methods on physical properties of a medium-textured soil under a
seven-year rice–wheat rotation. Soil Sci. Soc. Am. J. 75, 1851–1862 (2011).
14. Ladha, J. K. et al. Integrating crop and resource management technologies for enhanced productivity, profitability and sustain-
ability of the rice-wheat system in South Asia. p. 69–108. In J.K. Ladha et al. (ed.) Integrated crop and resource management in the
rice-wheat system of South Asia. IRRI, Los Baños, Philippines (2009).
15. Corsi, S. & Muminjanov, H. Conservation Agriculture: Training guide for extension agents and farmers in Eastern Europe and
Central Asia. Rome - ISBN 978-92-5-131456-2 (FAO, 2019).
16. Balwinder, S., Humphreys, E., Gaydon, D. S. & Yadav, S. Options for increasing the productivity of the rice–wheat system of north-
west India while reducing groundwater depletion Part 2. Is conservation agriculture the answer?. Field Crops Res. 173, 81–94 (2015).
17. Laik, R. et al. Integration of conservation agriculture with best management practices for improving system performance of the
rice–wheat rotation in eastern Indo-Gangetic plains of India. Agric. Ecosyst. Environ. 195, 68–82 (2014).
18. Govaerts, B. et al. Conservation agriculture as a sustainable option for the central Mexican highlands. Soil Till. Res. 103, 222–230
(2009).
19. Jat, M. L. et al. Double no-till and permanent raised beds in maize–wheat rotation of north western Indo-Gangetic plains of India:
Effects on crop yields, water productivity, profitability and soil physical properties. Field Crop Res. 149, 291–299 (2013).
20. Ludwig, B. et al. Effects of fertilization and soil management on crop yields and carbon stabilization in soils. A review. Agron.
Sustain. Dev. 31, 361–372 (2011).
21. Powlson, D. S., Stirling, C. M., Thierfelder, C., White, R. P. & Jat, M. L. Does conservation agriculture deliver climate change
mitigation through soil carbon sequestration in tropical agro- ecosystems?. Agric. Ecosyst. Environ. 220, 164–174 (2016).
22. Kandeler, E. et al. Response of soil microbial biomass and enzyme activities to the transient elevation of carbon dioxide in semi-
arid grassland. Soil Biol. Biochem. 38, 2448–2460 (2006).
23. Witt, C., Pasuquin, J. M., Pampolino, M.F., Buresh, R. J. & Dobermann, A. A manual for the development and participatory evalu-
ation of site-specific nutrient management for maize in tropical, favorable environments. International Plant Nutrition Institute,
Penang, Malaysia. http://seap.ipni.net (2009).
24. Pampolino, M. et al. Development and evaluation of nutrient expert for wheat in South Asia (special issue): Nutrient management
for wheat. Better Crops 96(3), 29–31 (2012).
25. Johnston, A. M. Nutrient expert-going global with improved fertilizer recommendations. Better Crops.Plant Food. 99(3), 20, (2015).
26. Sapkota, T. B. et al. Precision nutrient management in conservation agriculture based wheat production system of north–west
India: Profitability, nutrient use efficiency and environmental footprint. Field Crop Res. 155, 233–244 (2014).
27. Pooniya, V. et al. ‘Nutrient expert’ assisted site-specific-nutrient-management: An alternative precision fertilization technology
for maize–wheat cropping system in South-Asian Indo-Gangetic Plains. Indian J. Agric. Sci. 85(8), 996–1002 (2015).
28. Budhathoki, S. et al. Assessing growth, productivity and profitability of drought tolerant rice using nutrient expert—rice and other
precision fertilizer management practices in Lamjung, Nepal. Acta. Sci. Agric. 2(8), 153–158 (2018).
29. Satyanarayana, T. et al. Economics of nitrogen fertilizer application in rice, wheat and maize grown in the Indo-Gangetic Plains.
Indian J. of Fert. 8(8), 62–71 (2012).
30. Satyanarayana, T., Majumdar, K., Pampolino, M., Johnston, A. M. & Jat, M. L. Nutrient E xpertTM: A tool to optimize nutrient use
and improve productivity of maize. Better Crops. South Asia 97(1), 21–24 (2013).
31. Anonymous. Annual Progress Report Kharif Maize. All India Coordinated Research Project on Maize. Eds. V. Mahajan et al.
Indian Institute of Maize Research, PAU Campus, Ludhiana-141 004, India. pp. 1082 (2016).
Scientific Reports | (2021) 11:10386 | https://doi.org/10.1038/s41598-021-89737-9 11
Vol.:(0123456789)www.nature.com/scientificreports/
32. Abrol, I. P. & Sangar, S. Sustaining Indian agriculture-conservation agriculture the way forward. Curr. Sci. 91, 1020–2015 (2006).
33. Ghosh, P. K. et al. Conservation agriculture towards achieving food security in north-east India. Curr. Sci. 99, 915–921 (2010).
34. Parihar, C. M. et al. Soil quality and carbon sequestration under conservation agriculture with balanced nutrition in intensive
cereal-based system. Soil Tillage Res. 202, 104653 (2020).
35. Mahajan, G., Singh, K. & Gill, M. S. Scope for enhancing and sustaining rice productivity in Punjab (food bowl of India). Afr. J.
Agric. Res. 7, 5611–5620 (2012).
36. Jat, H. S. et al. Effects of tillage, crop establishment and diversification on soil organic carbon, aggregation, aggregate associated
carbon and productivity in cereal systems of semi-arid Northwest India. Soil Till. Res. 190, 128–138 (2019).
37. Jat, H. S. et al. Assessing soil properties and nutrient availability under conservation agriculture practices in a reclaimed sodic soil
in cereal-based systems of North-West India. Arch. Agron. Soil Sci. 64, 531–545 (2018).
38. Kaschuk, G., Alberton, O. & Hungria, M. Three decades of soil microbial biomass studies in Brazilian ecosystems: Lessons learned
about soil quality and indications for improving sustainability. Soil Biol. Biochem. 42, 1–13 (2010).
39. Sarkar, D. et al. Can sustainability of maize–mustard cropping system be achieved through balanced nutrient management?. Field
Crops Res. 225, 9–21 (2018).
40. Pooniya, V., Palta, J. A., Chen, Y., Delhaize, E. & Siddique, K. H. M. Impact of the TaMATE1B gene on above and below-ground
growth of durum wheat grown on an acid and Al3+-toxic soil. Plant Soil 447, 73–84 (2020).
41. Pasuquin, J. M. et al. Closing yield gaps in maize production in Southeast Asia through site-specific nutrient management. Field
Crops Res. 156, 219–230 (2014).
42. Choudhary, K. M. et al. Evaluating alternatives to rice–wheat system in western Indo-Gangetic Plains: Crop yields, water produc-
tivity and economic profitability. Field Crop Res. 218, 1–10 (2018).
43. Jat, R. K. et al. Ten years of conservation agriculture in a rice-maize rotation of Eastern Gangetic Plains of India: Yield trends,
water productivity and economic profitability. Field Crop Res. 232, 1–10 (2019).
44. Jat, H. S. et al. Designing profitable, resource use efficient and environmentally sound cereal based systems for the Western Indo-
Gangetic plains. Sci. Rep. 10(1), 1–16 (2020).
45. Thierfelder, C., Amezquita, E. & Stahr, K. Effects of intensifying organic manuring and tillage practices on penetration resistance
and infiltration rate. Soil Till. Res. 82, 211–226 (2005).
46. Bescansa, P., Imaz, M. J., Virto, I., Enrique, A. & Hoogmoed, W. B. Soil water retention as affected by tillage and residue manage-
ment in semiarid Spain. Soil Till. Res. 87, 19–27 (2006).
47. Lal, R. Sequestering carbon and increasing productivity by conservation agriculture. JSWC. 70, 55A-62A (2015).
48. Page, K. L., Dang, Y. P. & Dalal, R. C. The ability of conservation agriculture to conserve soil organic carbon and the subsequent
impact on soil physical, chemical, and biological properties and yield. Front. Sustain. Food Syst. 4, 31 (2020).
49. Six, J., Elliott, E. T. & Paustian, K. Soil macroaggregate turnover and microaggregate formation: A mechanism for C sequestration
under no-tillage agriculture. Soil Bio. Biochem. 32, 2099–2103 (2000).
50. Tan, Z., Lal, R., Owens, L. & Izaurralde, R. C. Distribution of light and heavy fractions of soil organic carbon as related to land use
and tillage practice. Soil Till. Res. 92, 53–59 (2007).
51. Blanco-Canqui, H. & Ruis, S. J. No-tillage and soil physical environment. Geoderma 326, 164–200 (2018).
52. Somasundaram, J. et al. Conservation agriculture effects on soil properties and crop productivity in a semiarid region of India.
Soil Res. 57, 187–199 (2019).
53. Hansen, N. C., Allen, B. L., Baumhardt, R. L. & Lyon, D. J. Research achievements and adoption of no-till, dryland cropping in
the semi-arid US Great Plains. Field Crops Res. 132, 196–203 (2012).
54. Dalal, R. C., Wang, W., Allen, D. E., Reeves, S. & Menzies, N. W. Soil nitrogen and nitrogen-use efficiency under long-term no-till
practice. Soil Sci. Society Am. J. 75, 2251–2261 (2011).
55. Zhang, H. L., Lal, R., Zhao, X., Xue, J. F. & Chen, F. Opportunities and challenges of soil carbon sequestration by conservation
agriculture in China. Adv. Agron. 124, 1–36 (2014).
56. Mandal, A., Patra, A. K., Singh, D., Swarup, A. & Masto, R. E. Effect of long-term application of manure and fertilizer on biological
and biochemical activities in soil during crop development stages. Biores. Tech. 98, 3585–3592 (2007).
57. Singh, G., Kumar, D., Marwaha, T. S., Singh, A. K. & Srinivasmurthy, K. Conservation tillage and integrated nitrogen management
stimulates soil microbial properties under varying water regimes in maize–wheat cropping system in northern India. Arch. Agro.
Soil Sci. 57(5), 507–521 (2011).
58. Manning, D. A. C. & Renforth, P. Passive sequestration of atmospheric CO2 through coupled plant mineral reactions in urban
soils. Environ. Sci. Technol. 47, 135–141 (2013).
59. Mullen, M., Melhorn, C., Tyler, C. & Duck, D. Biological and biochemical soil properties in no–till corn with different cover crops.
J. Soil Water Conserv. 5, 219–224 (1998).
60. Pooniya, V. & Shivay, Y. S. Summer green-manuring crops and zinc fertilization on productivity and economics of basmati rice
(Oryza sativa L.). Arch. Agron. Soil. Sci. 58(6), 593–616 (2012).
61. Pooniya, et al. Influence of summer legume residue–recycling and varietal diversification on productivity, energetics and nutrient
dynamics in basmati rice–wheat cropping system of western Indo-Gangetic Plains. J. Plant Nutr. 41(12), 1491–1506 (2018).
62. Pooniya, V., Shivay, Y. S., Rana, A., Nain, L. & Prasanna, R. Enhancing soil nutrient dynamics and productivity of Basmati rice
through residue incorporation and zinc fertilization. Eur. J. Agron. 41, 28–37 (2012).
63. Walkley, A. J. & Black, I. A. An examination of the Degtjareff method for determination of soil organic matter and a proposed
modification of the chromic acid titration method. Soil Sci. 37, 29–38 (1934).
64. Subbiah, B. V. & Asija, G. L. A rapid procedure for estimation of the available nitrogen in soil. Curr. Sci. 25, 259–260 (1956).
65. Olsen, S. R., Cole, C. V., Watanabe, F. S. & Dean, L. Estimation of Available Phosphorus in Soil by Extraction with Sodium Carbonate
(USDA, 1954).
66. Hanway, J. J. & Heidel, H. Soil Analysis Methods as used in Iowa State College Soil Testing Laboratory, Bulletin 57 (Iowa State College
of Agriculture, 1952).
67. Babu, S. et al. Impact of land configuration and organic nutrient management on productivity, quality and soil properties under
baby corn in Eastern Himalayas. Sci. Rep. 10(1), 1–14 (2020).
68. Dey, A. et al. Effect of conservation agriculture on soil organic and inorganic carbon sequestration and lability: A study from a
rice–wheat cropping system on a calcareous soil of the eastern Indo-Gangetic Plains. Soil Use Manage. 36, 429–438 (2018).
69. Ellert, B. H. & Bettany, J. R. Calculation of organic matter and nutrients stored in soils under contrasting management regimes.
Can. J. Soil Sci. 75, 529–538 (1995).
70. Vance, E. D., Brookes, P. C. & Jenkinson, D. S. An extraction method for measuring soil microbial biomass carbon. Soil Biol.
Biochem. 19, 703–704 (1987).
71. Bhushan, L. et al. Saving of water and labor in a rice–wheat system with no-tillage and direct seeding technologies. Agron. J. 99,
1288–1296 (2007).
72. Singh, R. P., Das, S. K., Rao, U. M. B. & Reddy, N. Towards Sustainable Dryland Agricultural Practices (CRIDA, 1990).
73. Wanjari, R. H., Singh, M. V. & Ghosh, P. K. Sustainable yield index: An approach to evaluate the sustainability of long-term intensive
cropping systems in India. J. Sustain. Agric. 24(4), 39–56 (2004).
74. Gomez, K. A. & Gomez, A. A. Statistical Procedures for Agricultural Research 2nd edn, 180–209 (Wiley, 1984).
Scientific Reports | (2021) 11:10386 | https://doi.org/10.1038/s41598-021-89737-9 12
Vol:.(1234567890)You can also read