LIMPOPO GREEN ECONOMY PLAN - INCLUDING PROVINCIAL CLIMATE CHANGE RESPONSE - Department of ...
←
→
Page content transcription
If your browser does not render page correctly, please read the page content below
LIMPOPO
            GREEN ECONOMY PLAN

                                       INCLUDING
 PROVINCIAL CLIMATE CHANGE RESPONSE

                                          June 2013

                                                                  PREPARED BY DR ANTOANETA LETSOALO
                                                                 Manager Environmental Research and Planning

Evridiki Towers, 20 Hans van Rensburg Street, POLOKWANE, 0700, Private Bag X9484, POLOKWANE, 0700
                 Tel: 015 293 8300, Fax: 015 295 5297, website: http\\www.Limpopo.gov.za

   The heartland of southern Africa – development is about people!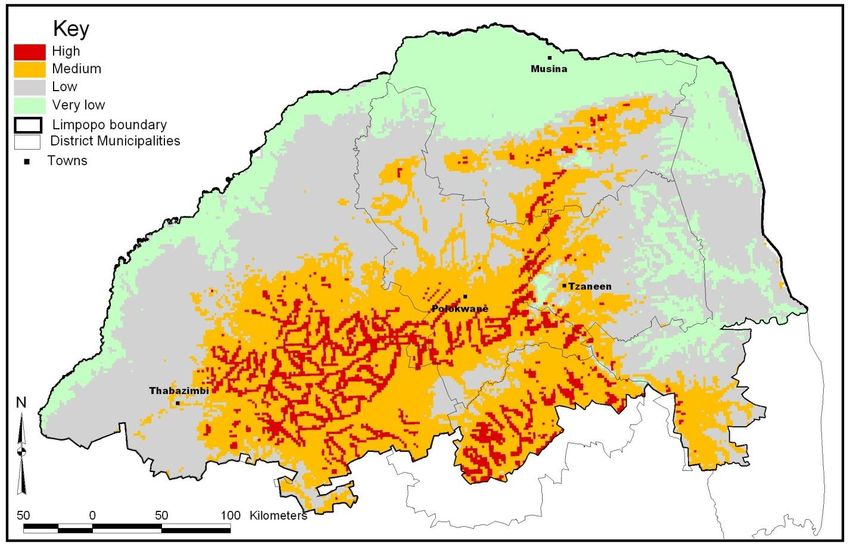
TABLE OF CONTENTS

EXECUTIVE SUMMARY …………………………………..………….……………….2

CHAPTER 1: INTRODUCTION - WHY GREEN ECONOMY …………….………..4

CHAPTER 2: WHICH COLOUR IS THE ECONOMY OF LIMPOPO……….……10

CHAPTER 3: KEY FOCUS AREAS OF THE GREEN PLAN –
           NATIONAL AND PROVINCIAL PRIORITIES……………………...17

   Sustainable Production and Consumption…………………….….…..……18
   Water Management ……………………………….……………..………..…….19
   Sustainable Waste Management Practices…………………………..……..22
   Clean Energy and Energy Efficiency…………………………………..……..24
   Resource Conservation and Management …………………………………28
   Agriculture, Food Production and Forestry…………………………………29
   Green buildings and the built environment............................................. 31
   Sustainable Transport and Infrastructure………………………..………….33
   Green Municipalities ……………………………………………………..……..34
   Cross-cutting…………………………………….……………………….…........37

CHAPTER 4: IMPLEMENTATION PLANS PER KEY FOCUS AREA…..……..41

   Sustainable Production and Consumption……………………...…..………41
   Water Management ……………………………….……………..…..…….…….42
   Sustainable Waste Management Practices…………………………………43
   Clean Energy and Energy Efficiency…………………………………………44
   Resource Conservation and Management ……………………….…………45
   Agriculture, Food Production and Forestry……………………….…………47
   Green buildings and the built environment................................................48
   Sustainable Transport and Infrastructure………………..………….………49
   Green Municipalities ………………………………………..………………..….50
   Cross-cutting…………………………………….………………………..….…...51

CONCLUSION…………………………………………………………………………..52

                                                                                                 1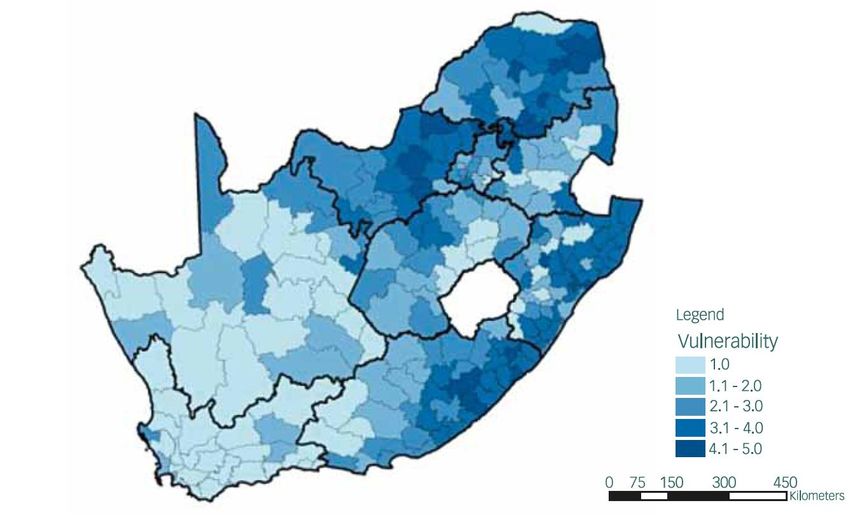
Executive Summary
It is an exciting time in the history of Limpopo Province – there is an opportunity for all members of society to participate in
credible economic activities.
The Green Economy is local production and consumption, efficient use of energy and water and care of natural and
created resources. It is a new way of thinking, planning and living. It provides socially and environmentally just solutions to
economic exclusion and resource degradation.
Limpopo Province has the potential to be the national pioneer in the Green Economy.
The advantages of the province are:
1. Perfect geographic situation to develop a variety of green industries and economies of scale;
2. Invaluable mineral resource base for local beneficiation;
3. Unexploited biodiversity resources for green tourism and payment for ecosystem services;
4. Vibrant young population to enthusiastically engage in new, innovative and developmental economic activities.
The Green Economy in Limpopo will grant coupled benefits for the economy and the environment.
The goals of the Limpopo Green Economy plan are:
Short Term: Generate Jobs
Improve Environmental Quality
Medium Term: Create Enabling Conditions for Green Growth
Change Behavioral and Production Patterns
Long-Term: Build a New Economic/Environmental Paradigm for Limpopo
The above will be implemented through specified initiatives in the following key focus areas:
1. Sustainable Production and Consumption
2. Water Management
3. Sustainable Waste Management Practices
4. Clean Energy and Energy Efficiency
5. Resource Conservation and Management
6. Agriculture, Food Production and Forestry
7. Green buildings and the built environment
8. Sustainable Transport and Infrastructure
9. Green Municipalities
10. Cross-cutting
The envisaged hierarchy of interventions is as follows:
1.Immediate policy decisions and enforcement can start Green Economy practices today on:
local, sustainable consumption and production,
green procurement,
green buildings,
sustainable transport,
energy efficiency,
water efficiency,
waste minimization.
2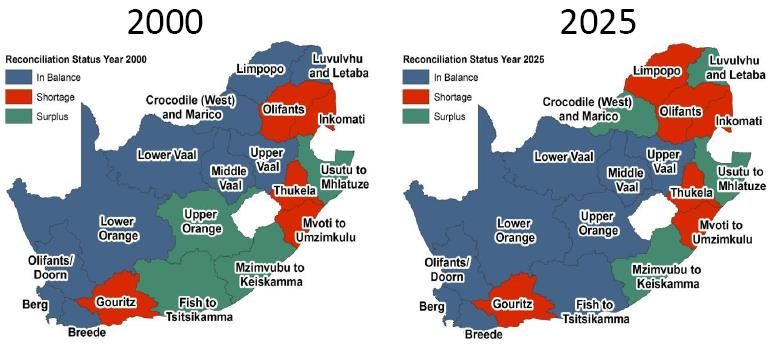
2.Short to Medium Term Legislation and Policy Review and Coordination
To create enabling setting for a Green Economy the provincial government must communicate clear policy
messages to the general community, industry and business and all public servants.
Municipal by-laws and all provincial policies and legislation must be reassessed to support the Green Economy
model.
Coordination of all Green Activities and their inclusion in performance management is a mandatory condition for
success.
3.Low capital investment and long term sustainability projects with huge potential for job creation:
Management of Alien Plants with further product development
Recycling with added production of biogass, paper, plastic.
These can be located in practically all local municipalities, because the resource base is existing and unlimited, and no
complex technical skills are needed. Just these two projects, multiplied by at least two teams in every local municipality
have the potential to create no less than 1 000 long term sustainable green jobs.
4.Long Term Industrial Developments
Energy security is a major component in the implementation of the LEGDP. Limpopo has the potential to develop several
tier renewable energy complex, some components of which are:
Production of electricity through Concentrated Solar Plants (CSP)
The province has favorable solar radiation and abundant land to build concentrated solar plants with generation capacity of
not less than 100 MW, its geographic situation will allow transmission and sale to Zimbabwe, Botswana, Mpumalanga,
Gauteng. Potential for further increase of generating capacity with the advance of technology is unlimited.
Production of electricity off the grid by small (5 MW) solar power plants
There are dwellings where Eskom’s grid would not reach as it is not economically viable, which justifies such an
investment and ensures delivery of services.
Production of components for solar panels
Silicon reserves and the second biggest silicon smelter in the world are in Limpopo and in Polokwane.
Industrial enterprises to beneficiate the resource by creating local employment and development of the human resource of
the province must be created.
Production of solar chargers for cell phones, small scale electrical devises can be initiated and franchise
further developed.
5.Long Term Human Resource Development
The disturbing tendency of outmigration from the province of university graduates and matriculates due to lack of job
opportunities can be turned around through the Green Economy initiatives. The major awareness campaigns around
reasonable consumption, energy efficiency, water use, waste management, green buildings must be conducted by the
youth of the province. As they are those who would experience the grave consequences of the current barbaric use of
resources, appreciating the need of change in behavior can provide young people with meaningful engagement through
political, church, neighborhoods, schools, universities, etc. networks.
Introduction of technical subjects to the curricula of tertiary institutions and creation of specific FET colleagues in the
province must take priority.
The Green Economy has the potential to bring better life to the people in Limpopo.
The province is identified as a Climate Change “hop-spot” – building resilient communities through green
economy thinking, planning and implementation is our response to the challenge.
The integrity of its political leadership and citizenry can make it happen.
3
Chapter 1
Introduction – Why Green Economy?
The main objective of Limpopo Employment Growth and Development Plan (LEGDP) 2009-2014 is to improve the quality
of life of the people in the Province. It is envisaged, that this will be done by introducing economy, which:
1. Will create decent jobs, foundation to sustainable livelihoods
2. Create reliable health care infrastructure
3. Afford for the building of houses of acceptable standard
4. Provide social development
5. Result in comprehensive rural development, food security and land reform.
We hereby propose that the attention of the leadership and citizenry of the province is focused on the Green Economy, as
the opportunity for successful accomplishment of the above objective and its specific tasks.
The Green Economy is:
Environmentally sustainable, based on the belief that our biosphere is a closed system with finite resources
and a limited capacity for self-regulation and self-renewal. We depend on the earth’s natural resources, and
therefore we must create an economic system that respects the integrity of ecosystems and ensures the
resilience of life supporting systems.
A ecological economy: Globally humankind has been exploring ecosystem services for the last 10 000 years.
Ecosystem services are all benefits people derive from nature: Provisioning – food, timber, water; Regulating –
climate, disease, nutrient cycles regulation, Supporting – soil formation, Cultural – aesthetic and educational,
places of worship, etc. Because of the elasticity and flexibility of natural systems, we still enjoy the plethora of
benefits ecosystem services provide. However, since the beginning of the industrial revolution, we have
significantly changed many variables in the Earth System. Through agriculture and urbanization, we are
introducing new land use, which competes with the natural habitat of plants and animals, leading to their
extinction, which is now measured at a rate 1 000 times higher than its natural background.
A low carbon economy: the carbon level of economic activities in South Africa is disturbingly high. We are the 13th
biggest emitter of Carbon Dioxide (CO2) in the world. Continuing to operate in the current energy from coal
production paradigm will compromise our position as an international player and challenge our own energy
security.
A circular economy: an economy in which the waste from one production/consumption process is circulated as a
new input into the same or a different process. Currently, the waste from all aspects of human activities creates
pollution, as we release new chemical products and substances in the soil, rivers, oceans, air thus threatening to
destroy the living web on which our lives depend.
Socially just, founded on the conviction that culture and human dignity are precious resources that, like our
natural resources, require responsible stewardship to avoid their depletion. We must create a vibrant economic
system that ensures all people have access to a decent standard of living and full opportunities for personal and
social development.
The indigenous ways of life, culture preservation and transfer, knowledge dissemination, land, water and resource
use, food production, settlement maintenance, etc are a rich source to explore and respect.
Locally rooted, based on the belief that an authentic connection to place is the essential pre-condition to
sustainability and justice. The Green Economy is a global aggregate of individual communities meeting the needs
of its citizens through the responsible, local production and exchange of goods and services.
4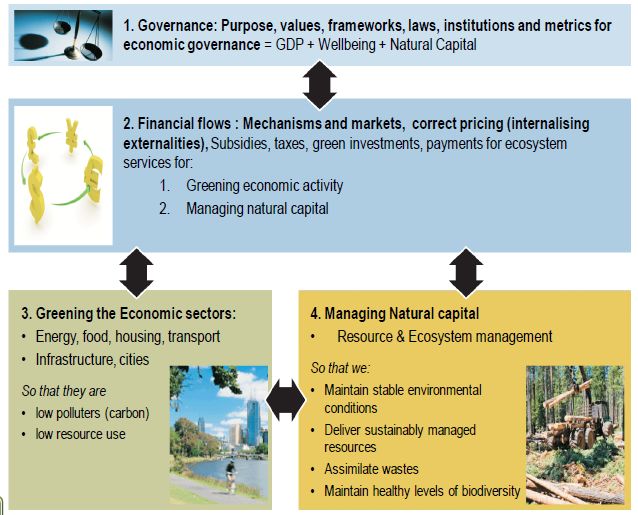
The Green Economy is the tool to strong sustainability.
South Africa has a proud history of championing the sustainability agenda. We hosted the Johannesburg Summit on
Sustainable Development in 2002 and have mainstreamed sustainability in all national planning. Our current understanding
of the concept is best presented in the National Strategy on Sustainable Development and Action Plan (NSSD) 2011-2014,
where the goods and services provided by healthy ecosystems create the basis for socio-political and economic
interactions, all grounded in good governance.

Figure 1: Sustainability Paradigm
Sources: National Framework on Sustainable Development 2008;
          National Strategy on Sustainable Development and Action Plan (NSSD) 2011-2014

     Figure 2: Translating development challenges into green development opportunities
     Source: Programmes in Support of Transitioning South Africa to a Green Economy, DBSA 24, 2011
                                                                                                                      5
Figure 3: Pathway to a green economy
Source: Programmes in Support of Transitioning South Africa to a Green Economy, DBSA 24, 2011

Figure 4: Phases of the Green Economy Programme Development
Source: Programmes in Support of Transitioning South Africa to a Green Economy, DBSA 24, 2011

                                                                                                6
Figure 5: Summary of Green Economy Programmes and Enabling Platforms
Source: Programmes in Support of Transitioning South Africa to a Green Economy, DBSA 24, 2011
Limpopo Province has the potential to be the national pioneer in the Green Economy.
The advantages of the province are:
Perfect geographic situation to develop various green industries and economies of scale;
Invaluable mineral resource base for local beneficiation;
Unexploited biodiversity resources for green tourism and payment for ecosystem services;
Vibrant young population to enthusiastically engage in new, innovative and developmental economic
activities.
7
The goals of the Limpopo Green Economy plan are:
Short Term: Generate Jobs
Improve Environmental Quality
Medium Term: Create Enabling Conditions for Green Growth
Change Behavioral and Production Patterns
Long-Term: Build a New Economic/Environmental Paradigm for Limpopo
The above will be implemented through specified initiatives in the following key focus areas:
1. Sustainable Production and Consumption
2. Water Management
3. Sustainable Waste Management Practices
4. Clean Energy and Energy Efficiency
5. Resource Conservation and Management
6. Agriculture, Food Production and Forestry
7. Green buildings and the built environment
8. Sustainable Transport and Infrastructure
9. Green Municipalities
10. Cross-cutting
The envisaged hierarchy of interventions is as follows:
1.Immediate policy decisions and enforcement can start Green Economy practices today on:
local, sustainable consumption and production,
green procurement,
green buildings,
sustainable transport,
energy efficiency,
water efficiency,
waste minimization.
2.Short to Medium Term Legislation and Policy Review and Coordination
To create enabling setting for a Green Economy the provincial government must communicate clear policy
messages to the general community, industry and business and all public servants.
Municipal by-laws and all provincial policies and legislation must be reassessed to support the Green Economy
model.
Coordination of all Green Activities and their inclusion in performance management is a mandatory condition for
success.
3.Low capital investment and long term sustainability projects with huge potential for job creation:
Management of Alien Plants with further product development
Recycling with added production of biogass, paper, plastic.
These can be located in practically all local municipalities, because the resource base is existing and unlimited, and no
complex technical skills are needed. Just these two projects, multiplied by at least two teams in every local municipality
have the potential to create no less than 1 000 long term sustainable green jobs.
4.Long Term Industrial Developments
Energy security is a major component in the implementation of the LEGDP. Limpopo has the potential to develop several
tier renewable energy complex, some components of which are:
8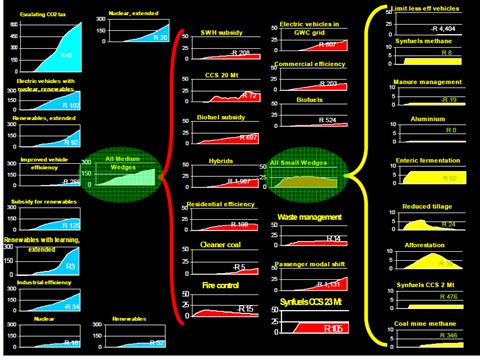
Production of electricity through Concentrated Solar Plants (CSP)
The province has favorable solar radiation and abundant land to build concentrated solar plants with generation capacity of
not less than 100 MW, its geographic situation will allow transmission and sale to Zimbabwe, Botswana, Mpumalanga,
Gauteng. Potential for further increase of generating capacity with the advance of technology is unlimited.
Production of electricity off the grid by small (5 MW) solar power plants
There are dwellings where Eskom’s grid would not reach as it is not economically viable, which justifies such an
investment and ensures delivery of services.
Production of components for solar panels
Silicon reserves and the second biggest silicon smelter in the world are in Limpopo and in Polokwane.
Industrial enterprises to beneficiate the resource by creating local employment and development of the human resource of
the province must be created.
Production of solar chargers for cell phones, small scale electrical devises can be initiated and franchise
further developed.
5.Long Term Human Resource Development
The disturbing tendency of outmigration from the province of university graduates and matriculates due to lack of job
opportunities can be turned around through the Green Economy initiatives. The major awareness campaigns around
reasonable consumption, energy efficiency, water use, waste management, green buildings must be conducted by the
youth of the province. As they are those who would experience the grave consequences of the current barbaric use of
resources, appreciating the need of change in behavior can provide young people with meaningful engagement through
political, church, neighborhoods, schools, universities, etc. networks.
Introduction of technical subjects to the curricula of tertiary institutions and creation of specific FET colleagues in the
province must take priority.
9Chapter 2
Which Colour is the Economy of Limpopo*
This chapter provides an overview of the economic performance of the province from 1996 to 2011.
1. Real Economic Growth Rate for 2011
Real Economic Growth Rate - 2011
4.5
4.0
3.5
3.0
Percentage
2.5
2.0
1.5
1.0
0.5
0.0
WC EC NC FS KZN NW GP MP LP SA
Province 3.6 3.4 2.2 2.5 3.6 2.7 4.0 2.5 2.2 3.5
Statssa GDP 2011
Due to the economic recession faced by many countries in 2009, South Africa and its provinces has weathered the storm
and going through steady growth. However, the global concern on climate change remains a threat to our future. The
growth rates were boasted by the hosting of the 2010 FIFA world cup. Most provinces (including Limpopo) were able to
maintain the steady growth rates in 2011. Limpopo’s economic growth rate in 2011 was attributable to a contribution of
mining at 29.4 percent, government services at 16 percent and finance, real estate and business services at 14 percent.
The growth rate was however dampened by declining contributions of 2.5 percent in agriculture, forestry and fishing, 2.5
percent in manufacturing and 2.5 percent in construction.
2. Average Real Economic Growth Rate
Average Annual Economic Growth Rate 1996-2011
4.0
3.5
3.0
Percentage
2.5
2.0
1.5
1.0
0.5
0.0
WC EC NC FC KZN NW GP MP LP
Province 3.4 2.9 2.1 2.3 3.4 2.3 3.7 2.9 3.2
SA 3.3 3.3 3.3 3.3 3.3 3.3 3.3 3.3 3.3
Statssa GDP 2011
*This chapter is developed by Mr M Mapatha, Manager Economic Research, LEDET
10The average annual real economic growth rate for Limpopo between 1996 and 2011 is 3.2 percent, ranked number four
amongst the nine provinces. The province with the highest average annual growth rate is Gauteng at 3.7 percent, Western
Cape and Kwa Zulu Natal both at 3.4 percent. The provinces that achieved the least average annual growth rate are North
West, Free State and Northern Cape at 2.3, 2.3 and 2.1 percentages respectively.
3. Provincial Contribution to the National GDP
Provincial Contribution to the National Economy
40.0
Percentage
30.0
20.0
10.0
0.0
WC EC NC FS KZN NW GP MP LP
2005 14.6 7.9 2.2 5.2 16.2 6.4 34.3 6.6 6.6
2009 14.1 7.6 2.3 5.4 16.0 6.5 34.0 7.0 7.0
2011 14.2 7.5 2.2 5.3 15.7 6.5 34.5 7.0 7.1
Statssa GDP 2011
Limpopo Province contributed 6.6%, 7.0% and 7.1% for the years 2005, 2009 and 2011 respectively. Although the
contribution has been increasing in the mentioned years, the percentage increase is not substantial. Gauteng, KZN and
Western Cape have had the most significant average economic contribution of 34.3%, 16% and 14.3% respectively.
4. Limpopo Gross Domestic Contribution per sector
Limpopo Sectoral Contribution to the GDP
80.0
60.0
Percentage
40.0
20.0
0.0
96 97 98 99 00' 01' 02' 03' 04' 05' 06' 07' 08' 09' 10 11
Prim Industries 17.0 16.1 19.3 21.1 23.3 27.0 28.5 26.1 24.9 25.8 27.9 28.9 31.3 29.6 29.8 31.9
Sec Industries 11.4 10.7 9.7 8.7 8.7 7.8 7.7 8.0 7.8 7.7 7.4 7.1 7.8 8.1 7.8 7.7
Ter industries 62.7 64.4 61.6 60.8 58.8 56.1 54.8 56.6 57.0 55.8 54.0 53.0 51.3 52.7 52.8 50.0
Statssa GDP 2011
The contribution of the primary industry has been stable since 1996 growing at between a minimum of 17.0% in 1996 and
a maximum of 31.9% in 2011. The industry’s contribution has shown a positive growth for 5 consecutive years from 2004
to 2008. 2009 has however registered a lower contribution of 29.6% rate as compared to 31.9% of 2011. Secondary
industry contributed a maximum of 11% in 1996 and a minimum of 7.1% in 2007. It is however increasing its contribution
from 7.1% in 2007 to 7.8% in 2008 and 8.1% in 2009. The secondary contribution declined further to 7.7% in 2011. This
11contribution is requires serious attention and development of manufacturing sector including the green economy initiatives.
Tertiary industry is the highest contributor to the provincial economy contributing a maximum 64.4% in 1997 and declining
marginally to 50% (the lowest contribution since 1996) in 2011.
4.1. Agriculture, Forestry & Fishing and Mining & Quarrying
Agriculture & Mining Contribution
30.0
25.0
Percentage
20.0
15.0
10.0
5.0
0.0
96 97 98 99 00' 01' 02' 03' 04' 05' 06' 07' 08' 09' 10 11
Agric, for & fishing 2.9 2.3 3.3 2.7 2.5 2.6 2.4 3.7 3.2 2.6 2.8 2.9 3.0 2.9 2.7 2.5
Mining & quar 14.2 13.8 16.0 18.4 20.8 24.4 26.0 22.4 21.7 23.2 25.0 26.0 28.3 26.7 27.1 29.4
Statssa GDP 2011
Mining within the primary sector is contributing 29.4% in 2011 which is far more than agriculture’s contribution to the
provincial economy. Whilst mining remains the most prominent sector in the provincial economy, much effort is required to
beneficiate the minerals and maximize output. Although agriculture’s contribution to the GDP-R is minimal and dwindling
(contributing only 2.5% in 2011), it contributes substantially to national and household levels of food security and to exports
while generating substantial linkages and multipliers through income and employment creation. The LEGDP
Implementation Action Plans should clearly be directed to improve the competitiveness and performance of this sector,
while expanding access to the historically disadvantaged to enter this sector successfully.
4.2. Manufacturing, Electricity, Gas & Water and Construction
Manufact, Elec, gas & water and Constr Contribution
5.0
4.0
Percentage
3.0
2.0
1.0
0.0
96 97 98 99 00' 01' 02' 03' 04' 05' 06' 07' 08' 09' 10 11
Manufac 4.8 4.5 4.0 3.7 3.8 3.6 3.5 3.6 3.6 3.4 3.1 2.7 3.3 2.8 2.7 2.5
Elec, gas & water 3.7 3.5 3.3 2.9 2.9 2.5 2.5 2.9 2.6 2.7 2.5 2.5 2.4 2.9 2.8 2.8
Constr 2.9 2.7 2.4 2.1 2.0 1.8 1.7 1.4 1.5 1.6 1.7 1.9 2.0 2.4 2.3 2.5
Statssa GDP 2011
Manufacturing recorded a high contribution of 4.8% in 1996 and a lower contribution of 2.5% in 2011. The contribution of
the industry has been declining since 1996, and this is a cause for concern as manufacturing (as highlighted by the
12LEGDP) is a strategic industry to grow the economy and to create jobs. This sector is currently receiving national attention
through the Industrial Policy Action Plan and the recently launched new growth path. The Electricity, gas and water
industry made the highest contribution of 3.7% in 1996 and the lowest 2.3% in 2008, the contribution has picked up again
since 2008 to 2011. The green economy is particularly expected to play a key role in this sector due to climate change and
increased demand for energy in the province. The construction industry contributed 2.5% to the provincial economy; this
sector’s contribution is the least significant contributor within the secondary industry since 1996.
4.3. Wholesale, Retail, Motor trade, Catering & Accommodation and Transport, Storage & Communication
Wholesale & trade and Trans & communication Contribution
16.0
14.0
12.0
Percentage
10.0
8.0
6.0
4.0
2.0
0.0
96 97 98 99 00' 01' 02' 03' 04' 05' 06' 07' 08' 09' 10 11
Wholesale, retail and motor trade; catering and
14.2 13.4 12.4 12.3 12.7 12.2 11.2 11.4 11.7 11.1 10.6 10.2 10.5 10.1 10.7 10.8
accommodation
Transport, storage and communication 7.0 7.0 6.8 7.1 7.7 7.3 7.5 7.8 8.5 8.4 7.5 6.9 6.7 6.6 6.3 5.4
Statssa GDP 2011
The contribution of wholesale, retail, catering and accommodation industry has been declining since 1996 however it
remains an important sector to the provincial economy. The sector has contributed 10.8% compared to 5.4% contribution
made by transport, storage and communication sector. The transport, storage and communication sector is expected to
increase in the future due to government plans to roll-out ICT programmes and other logistics initiatives linked to the SEZ
and SIP programmes.
4.4. Finance, Real Estate & business services, Personal Services and General Government services
Finance, Personal and Gov services
25.0
20.0
Percentage
15.0
10.0
5.0
0.0
96 97 98 99 00' 01' 02' 03' 04' 05' 06' 07' 08' 09' 10 11
Finance, real estate … 17.4 17.3 16.4 15.9 14.4 14.4 14.2 15.1 14.4 14.9 15.2 15.2 14.5 14.8 14.1 14.0
Personal services 5.0 4.9 4.7 4.7 4.8 4.5 4.5 4.7 4.7 4.7 4.4 4.4 4.1 4.4 4.0 3.8
General government 19.1 21.8 21.3 20.8 19.2 17.7 17.3 17.5 17.7 16.6 16.3 16.3 15.6 16.8 17.6 16.0
Statssa GDP 2011
13General Government Services is one of the biggest contributor within the tertiary sector and to the provincial economy. The
sector contributed 16% in 2011 as compared to financial and personal services which contributed 14% and 3.8%
respectively. The situation whereby government services one of the biggest contributor to the provincial economy is not
healthy nor sustainable because an economy underpinned by a strong consumption and credit extensions is not desirable
as compared to an economy underpinned by a strong production.
5. Limpopo Growth Rate per sector
Limpopo Growth Rate per Sector
14.0
12.0
10.0
Percentage
8.0
6.0
4.0
2.0
0.0
-2.0
-4.0
-6.0
96 97 98 99 00' 01' 02' 03' 04' 05' 06' 07' 08' 09' 10 11
Primary Industries -5.5 5.5 6.4 1.0 -1.8 12.6 7.6 2.7 1.5 1.2 -0.6 1.3 -2.5 -4.1 4.4 0.8
Secondary Industries 6.4 2.8 -1.1 -1.7 7.3 0.2 4.4 1.5 5.3 6.1 7.5 6.5 3.3 -4.9 4.0 1.2
Tertiary industries 4.5 9.1 3.5 2.9 0.3 5.5 3.1 2.4 3.2 5.6 6.9 5.4 4.4 0.2 1.7 2.6
Statssa GDP 2011
The Limpopo provincial economy (as part of the national economy) was not immune to the 2008/09 global recession. As a
result the province recorded the second biggest negative growth rate in the primary sector after the 1996 East Asian
financial crisis. The secondary sector also took a plunge in 2009 due to decreased demand and production/manufacturing
activities. The economy has shown signs of recovery in 2010 and 2011 although the growth rates are not as significant.
The tertiary sector has never experienced negative growth rates since 1996 and has managed to absorb the 2008/09
shocks.
5.1. Agriculture, Forestry & Fishing and Mining & Quarrying
Growth Rate in Agriculture and Mining
30.0
25.0
20.0
Percentage
15.0
10.0
5.0
0.0
-5.0
-10.0
96 97 98 99 00' 01' 02' 03' 04' 05' 06' 07' 08' 09' 10 11
Agriculture, forestry and fishing 4.7 -1.5 24.1 8.8 -2.3 4.0 11.0 2.0 0.1 23.4 -6.9 3.6 17.8 0.9 -1.4 -0.6
Mining and quarrying -6.3 6.0 5.0 0.3 -1.8 13.4 7.3 2.8 1.6 -0.8 0.1 1.1 -4.7 -4.7 5.2 1.0
Statssa GDP 2011
14The growth in the agriculture sector has demonstrated high volatility, peaking at 24.1% in 1998 and dropping to a low
negative 6.9% in 2006. The sector further experienced negative growth rates in 2010 and 2011 with 1.4% and 0.6%
respectively. This is a concern for the province as agriculture in the one of the strategic pillars and the biggest employer in
the provincial economy. Mining is one of the highly sensitive sectors and integrated to the global economy. The mining
growth rates has declined for two consecutive years i.e. in 2008 and 2009, both at negative 4.7%. The sector has
demonstrated positive signs of recovery in 2010 and 2011 with 5.2% and 1.0% respectively. Although the percentage
contribution for this industry to the provincial economy is the highest (at 29.4% in 2011), deliberate strategic interventions
are required to transform or industrialise it through value addition.
5.2. Manufacturing, Electricity, Gas & Water and Construction
Growth Rate in Manufact, Elec, gas & water and Construct
20.0
15.0
10.0
Percentage
5.0
0.0
-5.0
-10.0
-15.0
96 97 98 99 00' 01' 02' 03' 04' 05' 06' 07' 08' 09' 10 11
Manufacturing 1.5 2.7 -0.8 1.4 6.1 3.4 1.6 -1.5 5.0 4.3 6.9 6.3 3.3 -10.9 6.0 1.7
Electricity, gas and water 14.0 5.0 1.7 -3.0 5.8 -4.4 3.8 17.3 6.5 5.3 4.7 2.9 -2.4 -4.5 4.0 0.9
Construction 7.1 0.1 -5.4 -6.0 12.5 -0.1 11.4 -12.7 4.1 11.7 13.4 12.2 11.4 4.9 0.9 0.8
Statssa GDP 2011
The importance of Manufacturing in the economy cannot be overemphasized; worldwide research has demonstrated that
manufacturing has the capability to create more labour absorbing activities. The province’s manufacturing sector has not
been doing well since 1996 and requires some serious attention. Although the sector has experienced a good growth rate
of 6.0% in 2010 its contribution to the provincial economy remains inadequate to address the provincial economic
challenges. Electricity, gas and water remains one of the most important sector as an enabler to the growth of the
economy. The sector’s growth rate peaked in 2003 at 17.3% and was hardest hit in 2009 during the global recession at
negative 4.5%. Construction industry has shown significant growth rates since the announcement and preparation of
hosting the FIFA 2010 World Cup peaking at 13.4% in 2006 and maintaining the healthy growth rates until 2009 despite
the global financial crises.
155.3. Wholesale, Retail, Motor Trade, Catering & Accommodation and Transport, Storage & Communication
Growth Rate in Wholesale and Transport
25.0
20.0
Percentage
15.0
10.0
5.0
0.0
-5.0
96 97 98 99 00' 01' 02' 03' 04' 05' 06' 07' 08' 09' 10 11
Wholesale, retail and motor trade;
3.9 2.3 1.9 5.7 7.1 7.0 0.8 -2.3 5.1 6.9 7.4 3.9 1.6 -0.7 3.2 3.7
catering and accommodation
Transport, storage and communication 10.2 12.0 9.1 11.3 6.3 19.8 16.4 4.4 2.5 2.3 5.7 6.4 5.3 -1.8 1.0 2.5
Statssa GDP 2011
The Wholesale, retail and motor trade, catering and accommodation industry has been fairly stable growing at an average
3.6% from 1996 to 2011. The transport, storage and communication depicts a general stable but a downward sloping
trend. The sector reached the highest growth rate of 19.8% in 2001 and the lowest growth rate of negative 1.8% in 2009
due to global recession.
5.4. Finance, real estate & business services, Personal services and General Government services
Finance, Personal and Government Services
25.0
20.0
Percentage
15.0
10.0
5.0
0.0
-5.0
-10.0
96 97 98 99 00' 01' 02' 03' 04' 05' 06' 07' 08' 09' 10 11
Finance, real estate and business
4.8 3.2 0.3 -1.3 -6.1 7.5 1.3 5.7 5.0 8.7 11.2 7.3 6.6 0.6 1.3 3.2
services
Personal services 2.9 0.2 6.3 3.7 4.7 2.3 2.5 5.4 1.6 3.9 6.5 5.6 4.2 -2.5 0.1 2.0
General government services 3.3 20.9 4.8 1.9 -1.6 -0.9 0.6 1.2 1.3 4.1 3.4 3.9 3.7 2.2 2.0 1.6
Statssa GDP 2011
The finance, real estate and business services shows a general stable trend except for the sharp decline of 6.1% realised
in 2000. Although the global economic recession was mainly due to the financial crisis, the sector managed to grow at
0.6% in 2009 and has gradually shown positive growth rates in 2010 and 2011 at 1.3% and 3.2% respectively. This is due
to the prudent fiscal policy of the South African government. Personal services sector has grown at an average of 3.1%
from 1996 to 2011. The sector’s is fairly stable and only realised a negative growth rate of 2.5% in 2009 (the only negative
growth rate since 1996) due to the global recession. General Government services peaked in 1997 at 20.9% and realised
a negative growth rate of 1.6% and 0.9% in 2000 and 2001 respectively.
16Chapter 3
Key Focus Areas of the Limpopo Green Economy Plan:
National Perspective and Provincial Priorities
This chapter traces the development of the green economy thinking in South Africa. It is based on the document derived
from the national Green Economy Summit in 2010 and the results of the processes which took place since: the preparation
and hosting the conference of the parties of the United Nations Framework Convention on Climate Change (COP17 of
UNFCCC) in Durban, 2011 and the Rio+20 Sustainability Summit in Brazil, 2012. It also highlights some of the specific
circumstances in Limpopo in all key focus areas.
Figure 6: South Africa Policy Drivers behind a Green Economy
Source: LEDET Strategic Planning January 2013, Trotter, SCIR
171. Sustainable Production and Consumption
National Considerations
Although South Africa has progressed well in encouraging and promoting sustainable consumption and production (SCP)
there are a number of challenges that need to be addressed. In many instances the challenges presented below present
opportunities for strengthening SCP efforts in the country:
Gaps in environmental data remain, which greatly hamper efforts to make better policy decisions. There is also a
general need to improve the availability of quantified data on the environmental, economic and social costs and
benefits of implementing cleaner production practices.
The low cost of resources such as water and electricity has in the past contributed to patterns of production and
consumption that are wasteful and inefficient. This situation has been exacerbated by the generation and treat-
ment of waste which are costly from a financial and health perspective.
South Africa is faced with low rates of academic achievement in mathematics and science and a severe shortage
of entrepreneurial and technology transfer skills and mechanisms.
The skills shortage has been compounded by weak cohesion in research programmes, shortage of market-
focused research and a relatively low tendency among academics to commercialize research.
The SCP initiatives remain fragmented. Insufficient co-ordination in government departments regarding the triple
bottom line for sustainable development means that there is a lack holistic approach to the entire production and
consumption cycles.
Inadequate enforcement of legislation and implementation of policy is a key constraint to promoting SCP in South
Africa.
Limited funding through government revenue structures as well as a lack of appropriate incentives such as eco-
nomic instruments has constrained the implementation of SCP related projects.
Inadequate education about energy efficiency and waste minimization and recycling, to name just two key SCP
objectives, has resulted in high rates of consumption by consumers.
The lack of incentives and penalties has meant that unsustainable patterns of consumption have been encour-
aged.
Policy and Governance Requirements
There is need for macro-economic analysis, research, global and national support which will translate to meeting demands
of consumers in terms of improving efficiency while at the same time making business sense. Cleaner production need to
be driven from national economic strategy.
What must be done now?
Build awareness on the benefits of SCP
Encourage more players to adopt SCP practices in order to develop a competitive market and create job
opportunities;
Provide a clear, credible and independent guide to consumers;
Embark on education campaigns that would encourage consumers to purchase products with lower environmen-
tal impacts;
Embark on campaigns that would assist behavioural change as part of implementation of various technologies to
work successfully;
Enhance local content in government procurement.
Limpopo Priorities
Align the sustainability plans of all industrial sectors in Limpopo with the National Sustainable Development
Strategy and Action Plan
Establish Limpopo as Green Tourism Destination Nationally and Internationally
Green Limpopo Tertiary Sector
182. Water Management
National Considerations
Threats, Challenges and Opportunities for Action
Currently there are about 19 water resource management areas in S.A. and a quarter (five) of the total 19 water manage-
ment areas experience water shortages (present scenario). A further quarter has water surpluses and remainder are in
balance. Shortages will become more prevalent if proper attention is not given to providing more water (scenario 2025).
Figure 7: Current State and Projections for Water Availability at Main SA Catchments
Source: South Africa Second National Communication to the UNFCCC, 2011
Although there are some inherent benefits in relation to transboundary management of water resources, the accompanying
challenges to realise the full potential of benefit-sharing at transboundary level cannot be ignored. The following are among
the crucial ones synonymous within the South African context.
Disproportionate distribution of water resources:
The agricultural sector consumes 62% of the total water resource. It is concerning to note that this sector is not
yielding benefits in proportion with consumption patterns;
In the domestic arena (27%) the urban area far outweighs the proportion which the rural areas consume the
resource with 23% and 4% respectively.
Inter-basin water transfers are expensive - cost recovery of water services serve as a barrier to access to safe
water by poor people;
Ageing water infrastructure and limited access – costly to maintain infrastructure;
Some economic activities are impacting negatively on water quality and the environment (acid mine drainage) –
due to resource constraints and lack of capacity, it is often difficult to monitor and assess the quality of water with
more emphasis placed on water quantity instead;
Unlawful use of water – in certain areas people make illegal connections while others, use water intended for
domestic use for agricultural purposes;
Demand outweighs supply – demand of water usage has over the years increased in all sectors, making it difficult
to provide good quality water to consumers;
19 Human settlements – with increased urbanisation and movement of people to areas close to work opportunities, a
number of settlements have surfaced as result. Often these settlements have no adequate reticulation systems or
are sometimes of poor quality making it easy for groundwater to be polluted resulting in, groundwater not being a
viable option;
Abundance of ocean water – some areas are experiencing drought despite an abundance of ocean water;
Insufficient data, data limitations and poor information about the cultural, social, and political norms of the existing
population often hinder development of an effective planning strategy;
Disparities in intellectual capital and technological innovation which are essential for sustainable management.
The physical nature of a river basin can confound efforts to manage the basin's resources; because basins are
irregular and receive water flows from multiple sources, difficulties are often encountered when attempting to
divide a basin into discrete, manageable subunits;
Further, the stochastic nature of rainfall forecasting makes prediction and control of the water problematic;
Limited potential for further resource development in most areas.
The following are potential areas where action could be taken:
Use national development goals or water-related challenges as a starting point;
Secure commitment at the highest level, but ensure a broad base of support which reaches down to the grass-
roots;
Involve high-level officials in water-related sectors from the outset and assign the task of developing a strategy to
a multi-sectoral steering group;
Stakeholders awareness of the scarcity of water can lead to meaningful involvement in the different process;
Create adequate knowledge base to make informed decisions;
Acknowledgement that water is an integrator of all sectors when it comes to sustainable development;
Ensure a realistic plan of implementation that includes a clear definition of roles and responsibilities, a sound
financing strategy, provision for capacity-building and systems to monitor progress and make adjustments as
needed;
Optimising the contribution of water for growth and development requires the consideration of complex links
between activities that influence and are influenced by how water is developed and managed and how a more
efficient use of the water as a limited resource can be secured;
Policy and Governance Requirements
Water policy impacts economic development and in turn macro-economic policy impacts sustainable water use. Upstream
land use decisions impact downstream water availability and water management decisions impact land degradation. Given
the numerous and complex links between activities that influence and are influenced by how water is developed and
managed, a more coherent and integrated approach makes good sense.
Effective coordination among various government departments need to be promoted. This will in turn improve resource
management and scientific understanding of the water cycle through cooperation in joint observation and research, and for
this purpose encourage and promote knowledge-sharing and provide capacity building and the transfer of technology.
What needs to be done now?
1. Mainstreaming water- it is critical that water is put at the forefront of planning, not an after-thought;
2. Strengthening sectoral co-operation;
3. Strengthen institutional and regulatory capacity;
4. Improve water management;
5. Addressing service backlogs- assess persistent backlogs and devise strategy for service delivery;
6. Changing water use behaviour - effect change in behaviour by regulation, self-regulate, use of market-based in-
struments and awareness and education.
20Limpopo Priorities
Facilitate Water Security in Limpopo by creating awareness
Efficient use of water in mining
Alternative water storage
Improved Reticulation systems
Recycling of water from sewage farms
Reduce water in agricultural consumption
Water harvesting from fog and rain
STP biogas production
Catchment management
Reduced house hold consumption
Regulate swimming pools
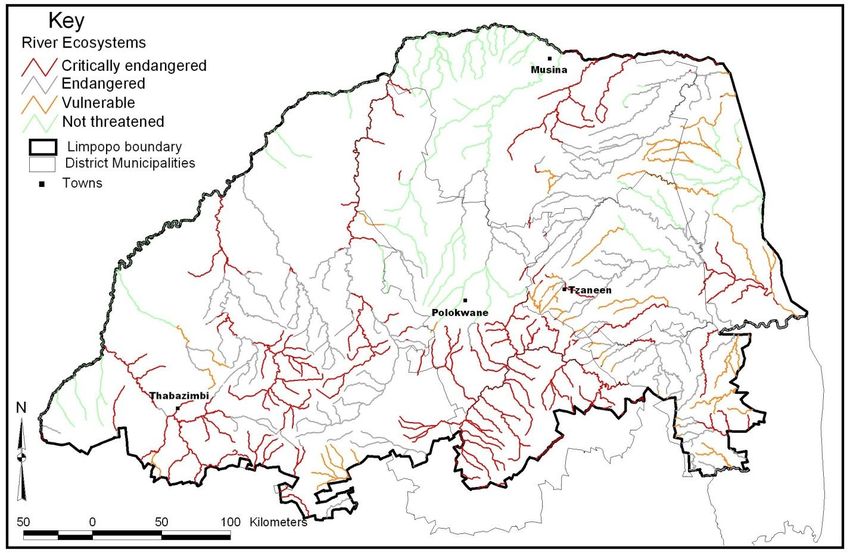
Figure 8: State of River Ecosystems in Limpopo
Source: Limpopo State of the Environment Report 2006
213.Sustainable Waste Management Practices
National Considerations
Threats, challenges, and opportunities for action
The business sector indicate that although there was appreciation for the enabling policy environment within the waste
management discourse, there was rising concern about government’s ability to enforce adherence to the policies. Fur-
thermore, according to business sector there was a tendency for government to be too interventionist through red tape and
inflationary business costs for implementing green waste management. These interventions tended to digress from
business’ drive to ensure that it does business in an efficient manner, while contributing to the agenda of green waste man-
agement.
Some businesses were doing more than others, and were not getting the recognition they deserved. Furthermore, the
introduction of the waste management hierarchy presents the added challenge of managing the transition in business
practice from the current waste management system while ensuring that waste management measures are environmen-
tally sustainable.
Waste management also presents an opportunity to address climate change. The recycling industry for example typically
creates new products with a lower use of energy, and hence carbon emissions, than the use of virgin material. Therefore
support to the recycling sector is typically a GHG mitigation action. The removal of organic materials from the waste stream
for use as aerobic composting material will also reduce methane emissions due to anaerobic digestion and is typically a
job creating process. Similarly, the use of waste as fuel in cement kilns or other waste-to-energy processes both displaces
fossil fuels and also reduces landfill gas formation.
The relevance of the waste management sector in the alleviation of poverty is unquestionable, but the contribution of this
sector needs to be upscale in order to maximize the impact.
Policy and governance requirements
The current legislative framework was permissive of greater impact with regard to the green waste management agenda,
but could benefit from further engagements between the DEA and several stakeholders, especially business and local
government. The Act, and its effective functioning, could be sufficiently encapsulated in the review of the strategy docu-
ment. The biggest policy and regulatory challenge was ensuring that the green waste management agenda took into
account the need for a capital and labour intensive approach thus ensuring job creation and associated poverty alleviation
and community ownership of the agenda.
What must be done now?
1. There is need for government to improve efficiency of the legislation by intervening for impact and less intervening
where the green waste management does actually work. Monitoring that business and other stakeholders are
compliant with existing waste management legislation also means reinforcing good “green waste management”
practice by introducing an incentive scheme, couple with penalties for poor green waste management.
2. There is further a need for government to allow, through administrative and funding support, foe the private sector
to innovate in green waste management thus inculcating ownership of the waste management hierarchy.
3. The extent of ownership and practice of the green waste management agenda by municipalities is cause for con-
cern and speaks to poor communication lines between national government and municipalities on this imperative.
Through existing structures at SALGA, the DEA needed to ensure representation of the green waste
management agenda thus accessing the complex and efficient network afforded by organised local government.
This network would not only allow for effective messaging with municipalities, but would further provide a network
for the sharing of positive lessons and models from elsewhere in the world and the country.
22Limpopo priorities:
Facilitate Efficient Waste Management in Limpopo by:
1. Licensing of waste disposal sites
2. Monitoring of conditions of licenses
3. Creating awareness around waste issues
Waste Beneficiation:
1. Labour intensive waste collection practices
2. Recycling of Tyres, Paper, Glass, Metal, Electronic waste
3. Establishment of material recovery centers (facilities)
4. Recovery of methane from waste disposal sites and sewer treatment plants for electricity production
Figure 9: Waste Disposal Sites in Limpopo Province
Source: Maselela T, Manager General Waste Management, Branch Environment, LEDET, 2013
234. Clean Energy and Energy Efficiency
National Considerations
Threats, challenges, and opportunities for action
The fossil fuels dominate the energy sector, with coal providing 75% of the fossil fuel demand and accounting for more
than 90% of electricity generation. In 2009, the energy sector contributed 80% of the country’s greenhouse gas emissions
(DEA, 2009). Growing awareness of the threat of climate change, rising prices for fossil fuels, growing concerns over
energy supply security and recent electricity price increases will be driving factors to increase an interest on making re-
newable energy more and more competitive in South Africa.
To couple with that, the National Energy Regulator of South Africa (NERSA) approved Renewable Energy Feed-In Tarrifs
(REFIT) to stimulate the development of renewable energy sector. Evidence of climate change has become more com-
pelling and the South African Cabinet has strengthened its commitment by approving a Long Medium Term Mitigation
Scenarios which provides various scenarios for the deployment of clean and renewable energy technologies.
Renewable Energy Technology can also be implemented in decentralized off-grid applications, which simply means that
more jobs can be created in rural areas of South Africa to alleviate poverty and increase energy security of supply. Jobs in
construction, fabrication (SWH), installing, operating, and maintaining renewable energy systems tend to be more local in
nature and can thus benefit unemployed rural poor in South Africa.
Based on the cabinet approved long-term mitigation scenarios (LTMS), the most stringent of which inter alia suggests that
around 50 per cent of South Africa’s energy would have to come from renewable sources in 2050. Assuming this equates
with a target of 15 per cent of electricity from renewables in 2020, 36,400 new direct jobs and 109,100 indirect jobs could
be created. In addition, as many as 700,000 people could be employed in biofuels.
If South Africa generates just 15% of total electricity use in 2020 using Renewable Energy Technology, it will create 36 400
new direct jobs, without taking any jobs away from coal-based electricity. Over 1.2 million direct and indirect jobs would be
generated if a portion of South Africa’s total energy needs, including fuels, were sourced with Renewable Energy
Technologies by 2020.
Policy and Governance Requirements
Clean energy alternative a cross-cutting issue among various sectors and need coordination. In addressing policy and gov-
ernance issues the following should be emphasized:
• Strengthen LTMS and linkages to other policy mechanisms e.g. IRP2, IPAP;
• Enforce energy efficiency & savings targets;
• Incentivise switch to cleaner technology;
• Behaviour change through fiscal interventions e.g. tax policy, measures;
• Set aggressive long term targets to stimulate industrialisation, set-up of local manufacturing.
What can be done now?
1. Build awareness on the benefits of Clean Energy and Alternative technologies country wide;
2. Promote and encourage the development of renewable and environmentally sound electricity generation tech-
nologies;
3. Encourage more players to enter the generation industry in order to develop a competitive power market through
the IRP and Independent Systems Market Operator (ISMO);
4. Implement renewable energy target and specific plan for expanding our capacity in renewable energy;
5. Set ambitious targets for boosting electricity generation through alternative and clean energy;
What can be done in the medium to long term?
A need to address skills shortages in the sector;
Stimulate the development of new and renewable sources of energy through various mechanisms such as incentives, etc.;
More support to Research and Development in the sector;
Embark on campaigns that would assist behavioural change as part of implementation of various technologies to work
successfully.
24Figure 10: South African Green House Gas Emissions
Source: Long Tern Mitigation Scenarios, 2010
Figure 11: Proposed Mitigation Measures to Bridge the Emissions Gap
Source: Long Tern Mitigation Scenarios, 2010
25Limpopo Priorities
Energy security is a major component in the implementation of the LEGDP.
A. Limpopo has the potential to develop several tier renewable energy complex:
1. Production of electricity through Concentrated Solar Plants –
the province has favorable solar radiation and land to build plant(s) with generation capacity of not less than 100
MW; its geographic situation will allow transmission and sale to Zimbabwe, Botswana, Mpumalanga, Gauteng.
Potential exists for further increase of generating capacity.
2. Production of electricity off the Grid by small (5 MW) solar power plants -
There are dwellings where Eskom’s grid would not reach as it is not economically viable.
3. Production of components for solar panels -
Silicon reserves and the second biggest silicone smelter in the world are in Limpopo and in Polokwane.
Industrial enterprises to beneficiate the resource by creating local employment and development of the human
resource of the province can be created.
4. Production of solar chargers for cell phones, small scale electrical devises can be initiated and franchise further
developed.
5. Bio-gas generation at agricultural farms
B. Energy Efficiency
1. Issue regulations for use of electricity in all public buildings (provincial government, municipalities, schools,
hospitals, community centers)
2. Assess energy efficiency in all public buildings
3. Retrofit all public buildings accordingly
4. Use solar panels for all street lights (bulk procurement, local production, installation)
5. Create public awareness on energy efficiency together with Eskom and NGOs
C. Human resource development
1. Introduce energy efficiency modules in study curriculum
2. Limpopo FET college for renewable energy artisans
Thus, the actions in the implementation plan are as follows:
Facilitate awareness creation about energy security
Facilitate Energy efficiency in Limpopo by:
1.Monitoring consumption in government buildings
2. Off Grid power generation, where possible (provincial nature reserves)
3. Bio fuels / Bio gass production
4. Solar water heaters installations in new buildings
5. Solar panels production in Limpopo
Develop capacity for generation of electricity from renewable sources
26Figure 12: Solar Radiation in Limpopo: January
Source: GAP4, LEDET&CSIR, 2011
275. Resource Conservation and Management
National Considerations
Threats, challenges and Opportunities for action
The human demand on natural ecosystems has had an adverse impact. It is thus critical that the human footprint on
natural eco systems be reduced. These are key areas of challenges that could also be opportunities to introduce strategies
that mitigate these adverse effects.
The current scenario on the preservation of the ecosystem comes with perverse incentives that are more harmful
than what they are intended to achieve. There is an absence of standards to determine what is “conservation”
friendly. For instance, increased price charged for “organic” products, the markets is not yet ready for biodiversity
friendly products;
The Human Development Index illustrates that demand exceeds supply in the mining of minerals. The waste pro-
duction in South Africa poses both a challenge and an opportunity for viable economic ventures;
Target setting remains a challenge, there are no clear targets outlined;
Science base to measure impact is not yet conclusive, Scientists and economists need to generate the baselines;
Defining incentives for resource efficiencies or resource gains. There needs to be a split from conservation gain to
conservation control e.g. the issue on hunting in a protected area is an issue for further discussion in legislature;
Defensive cost – cost of non action, meaning that the cost structure for business is not well managed by the
government;
Future economic gains from conservation need to be articulated clearly.
The value of biodiversity and ecosystem services is not adequately captured by current economic instruments, ecosystem
service assessment need to be reviewed. A connected landscape where different elements are clustered together lead to
rapid urbanization which puts pressure on basic facilities. As a result the resilience of landscape is decreased and this
poses risks for floods, sand transport, storms, etc. The opportunity here is in mainstreaming and enhancing biodiversity
friendly production landscapes that are well planned.
The invasion of alien species poses a big threat to the ecosystem. Climate change implications are not accounted for in
figures and the projected future could be more. More emphasis needs to be placed on prevention work. There needs to be
comprehensive funding mechanism to cater for entire ecosystem functioning.
Policy Governance Requirements
South Africa as a developing country needs to generate its own perspective for a green economy paradigm. The country
needs stable policies for the longer term (unaffected by changes in government) to make a green economy possible. The
following are policy governance requirements.
Enhance regulatory systems for improved synergy between conservation and production industries.
Split commercial game output management from regulatory control.
Commercial wildlife ranching proposes a model that is separate from biodiversity and conservation.
Global competitiveness for biological products.
What can be done now?
1. Interdisciplinary knowledge generation on embedded systems;
2. Knowledge transfer into planning instruments that ensure landscape sustainability and maintenance;
3. A more engaged civil society;
4. The government should provide an empowering framework for conservation of the ecosystem and biodiversity;
5. Expedite the National Land Degradation Fund as a vehicle for enabling civil society support for green economy
restoration and conservation initiatives;
6. Expand funding partnerships between conservation and development funds for implementation demonstrations.
28You can also read