Learning from a Pandemic. The Impact of COVID-19 on Education Around the World
←
→
Page content transcription
If your browser does not render page correctly, please read the page content below
Chapter 1
Learning from a Pandemic. The Impact
of COVID-19 on Education Around
the World

Fernando M. Reimers

Abstract This introductory chapter sets the stage for the book, explaining the goals,
methods, and significance of the comparative study. The chapter situates the theoret-
ical significance of the study with respect to research on education and inequality, and
argues that the rare, rapid, and massive change in the social context of schools caused
by the pandemic provides a singular opportunity to study the relative autonomy of
educational institutions from larger social structures implicated in the reproduction
of inequality. The chapter provides a conceptual educational model to examine the
impact of COVID-19 on educational opportunity. The chapter describes the evolution
of the COVID-19 pandemic and how it resulted into school closures and in the rapid
deployment of strategies of remote education. It examines available evidence on the
duration of school closures, the implementation of remote education strategies, and
known results in student access, engagement, learning, and well-being.

1.1 Introduction

The COVID-19 pandemic shocked education systems in most countries around the
world, constraining educational opportunities for many students at all levels and
in most countries, especially for poor students, those otherwise marginalized, and
for students with disabilities. This impact resulted from the direct health toll of the
pandemic and from indirect ripple effects such as diminished family income, food
insecurity, increased domestic violence, and other community and societal effects.
The disruptions caused by the pandemic affected more than 1.7 billion learners,
including 99% of students in low and lower-middle income countries (OECD, 2020c;
United Nations, 2020, p. 2).
   While just around 2% of the world population (168 million people as of May 27,
2021) had been infected a year after the coronavirus was first detected in Wuhan,
China, and only 2% of those infected (3.5 million) had lost their lives to the virus
(World Health Organization, 2021a), considerably more people were impacted by

F. M. Reimers (B)
Harvard Graduate School of Education, Harvard University, Cambridge, MA, USA
e-mail: fernando_reimers@harvard.edu

© The Author(s) 2022                                                                  1
F. M. Reimers (ed.), Primary and Secondary Education During Covid-19,
https://doi.org/10.1007/978-3-030-81500-4_1
2                                                                         F. M. Reimers

the policy responses put in place to contain the spread of the virus. Beyond the
infections and fatalities reported as directly caused by COVID-19, analysis of the
excess mortality since the pandemic outbreak, suggests that an additional 3 million
people may have lost their lives to date because of the virus (WHO, 2021b).
    As the General Director of the World Health Organization declared the outbreak of
COVID-19 a Public Health Emergency of International Concern (PHEIC) on January
30, 2020 (WHO, 2020a), countries began to adopt a range of policy responses to
contain the spread of the virus. The adoption of containment practices accelerated as
the COVID-19 outbreak was declared a global pandemic on March 11, 2020 (WHO,
2020b).
    Chief among those policy responses were the social distancing measures which
reduced the ability of many people to work, closed businesses, and reduced the ability
to congregate and meet for a variety of purposes, including teaching and learning. The
interruption of in-person instruction in schools and universities limited opportunities
for students to learn, causing disengagement from schools and, in some cases, school
dropouts. While most schools put in place alternative ways to continue schooling
during the period when in-person instruction was not feasible, those arrangements
varied in their effectiveness, and reached students in different social circumstances
with varied degrees of success.
    In addition to the learning loss and disengagement with learning caused by the
interruption of in-person instruction and by the variable efficacy of alternative forms
of education, other direct and indirect impacts of the pandemic diminished the ability
of families to support children and youth in their education. For students, as well
as for teachers and school staff, these included the economic shocks experienced by
families, in some cases leading to food insecurity, and in many more causing stress
and anxiety and impacting mental health. Opportunity to learn was also diminished by
the shocks and trauma experienced by those with a close relative infected by the virus,
and by the constraints on learning resulting from students having to learn at home,
and from teachers having to teach from home, where the demands of schoolwork had
to be negotiated with other family necessities, often sharing limited space and, for
those fortunate to have it, access to connectivity and digital devices. Furthermore,
the prolonged stress caused by the uncertainty over the evolution and conclusion of
the pandemic and resulting from the knowledge that anyone could be infected and
potentially lose their lives, created a traumatic context for many that undermined
the necessary focus and dedication to schoolwork. These individual effects were
reinforced by community effects, particularly for students and teachers living in
communities where the multifaceted negative impacts resulting from the pandemic
were pervasive.
    Beyond these individual and community effects of the pandemic on students,
and on teachers and school staff, the pandemic also impacted education systems
and schools. Burdened with multiple new demands for which they were unprepared,
and in many cases inadequately resourced, the capacity of education leaders and
administrators, who were also experiencing the previously described stressors faced
by students and teachers, was stretched considerably. Inevitably, the institutional
bandwidth to attend to the routine operations and support of schools was diminished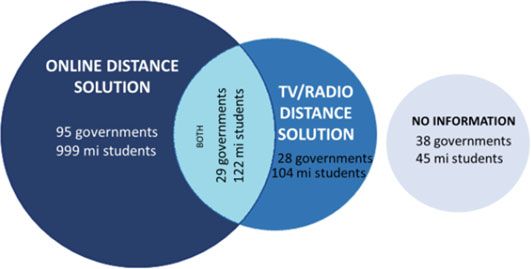
1 Learning from a Pandemic. The Impact of COVID-19 …                                   3

and, as a result, the ability to manage and sustain education programs was hampered.
Routine administrative efforts to support school operations as well as initiatives to
improve them were affected, often setting these efforts back.
    Published efforts to take stock of the educational impact of the pandemic to date,
as it continues to unfold, have largely consisted of collecting and analyzing a limited
number of indicators such as enrollment, school closures, or reports from various
groups about the alternative arrangements put in place to sustain educational oppor-
tunity, including whether, when, and how schools were open for in-person instruc-
tion and what alternative arrangements were made to sustain education remotely.
Often these data have been collected in samples of convenience, non-representative,
further limiting the ability to obtain true estimates of the education impact of the
pandemic on the student population. A recent review of research on learning loss
during the pandemic identified only eight studies, all focusing on OECD countries
which experienced relatively short periods of school closures (Belgium, the Nether-
lands, Switzerland, Spain, the United States, Australia, and Germany). These studies
confirm learning loss in most cases and, in some, increases in educational inequality,
but they also document heterogeneous effects of closures on learning for various
school subjects and education levels (Donelly & Patrinos, 2021).
    There have also been predictions of the likely impact of the pandemic, consisting
mostly of forecasts and simulations based on extrapolations of what is known about
the interruption of instruction in other contexts and periods. For example, based on an
analysis of the educational impact of the Ebola outbreaks, Hallgarten identified the
following likely drivers of school dropouts during COVID-19: (1) the reduction in the
availability of education services, (2) the reduction in access to education services,
(3) the reduction in the utilization of schools, and (4) lack of quality education.
Undergirding these drivers of dropout are these factors: (a) school closures, (b) lack
of at-home educational materials, (c) fear of school return and emotional stress caused
by the pandemic, (d) new financial hardships leading to difficulties paying fees, or
to children taking up employment, (e) lack of reliable information on the evolution
of the pandemic and on school reopenings, and (f) lack of teacher training during
crisis. (Hallgarten, 2020, p. 3).
    Another type of estimate of the likely educational cost of the pandemic includes
forecasts of the future economic costs for individuals and for society. A simulation of
the impact of a full year of learning loss estimated it as a 7.7% decline in discounted
GDP (Hanushek & Woessman, 2020). The World Bank estimated the cost of the
education disruption as a $10 trillion dollars in lost earnings over time for the current
generation of students (World Bank, 2020).
    Many of the reports to date of the educational responses to the pandemic and their
results are in fact reports of intended policy responses, often reflecting the views
of the highest education authorities in a country, a view somewhat removed from
the day-to-day realities of teachers and students and that provides information about
policy intent rather than on the implementation and actual effect of those policies. For
instance, the Inter-American Development Bank conducted a survey of the strategies
for education continuity adopted by 25 countries in Latin America and the Caribbean
during the first phase of the crisis, concluding that most had relied on the provision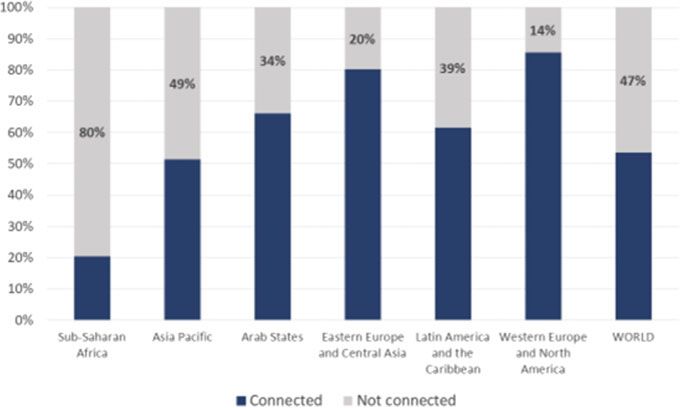
4                                                                         F. M. Reimers

of digital content on web-based portals, along with the use of TV, radio, and printed
materials, and that very few had integrated learning management systems, and only
one country had kept schools open (Alvarez et al., 2020).
   These reports, valuable as they are, are limited in what they contribute to under-
standing the ways in which education systems, teachers, and students were impacted
by the pandemic and about how they responded, chiefly because it is challenging
to document the impact of an unexpected education emergency in real time, and
because it will take time to be able to ascertain the full short- and medium-term
impact of this global education shock.

1.2 Goals and Significance of this Study

This book is a comparative effort to discern the short-term educational impact of the
pandemic in a selected number of countries, reflecting varied levels of financial and
institutional education resources, a variety of governance structures, varied levels of
education performance, varied regions of the world, and countries of diverse levels
of economic development, income per capita, and social and economic inequality.
Our goal is to contribute an evidence-based understanding of the short-term educa-
tional impact of the pandemic on students, teachers, and systems in those countries,
and to discuss the likely immediate effects of such an impact. Drawing on thirteen
national case studies, a chapter presenting a comparative perspective in five OECD
countries and another offering a global comparative perspective, we examine how
the pandemic impacted education systems and educational opportunity for students.
Such systematic stock-taking of how the pandemic impacted education is important
for several reasons. The first is that an understanding of the full global educational
impact of the pandemic necessitates an understanding of the ways in which varied
education systems responded (such as the nature and duration of school closures,
alternative means of education delivery deployed, and the goals of those strategies
of education continuity during the pandemic) and of the short-term results of those
responses (in terms of school attendance, engagement, learning and well-being for
different groups of students). In order to understand the possible student losses in
knowledge and skills, or in educational attainment that the current cohort of students
will experience relative to previous or future cohorts, and to understand the conse-
quences of such losses, we must first understand the processes through which the
pandemic influenced their opportunities to learn. Such systematization and stock-
taking are also essential to plan for remediation and recovery, in the immediate
aftermath of the pandemic and beyond. While the selection of countries was not
intended to represent the entire world, the knowledge gained from the analysis of
the educational impact of the pandemic on these diverse cases, as well as making
visible what is not yet known, will likely have heuristic value to educators designing
mitigation and remediation strategies in a wide variety of settings and may provide
a useful framework to design further research on this topic.
1 Learning from a Pandemic. The Impact of COVID-19 …                                  5

   In addition, the pandemic is likely to exacerbate preexisting challenges and to
create new ones, increasing unemployment for instance or contributing to social frag-
mentation, which require education responses. Furthermore, there were numerous
education challenges predating the pandemic that need attention. Addressing these
new education imperatives, as well as tackling preexisting ones, requires ‘building
back better’; not just restoring education systems to their pre-pandemic levels of func-
tioning, but rather realigning them to these new challenges. Examining the short-term
education response to the pandemic provides insight into whether the directionality
of such change is aligned to ‘building back better’ and with the kind of priorities that
should guide those efforts during the remainder of the pandemic and in the pandemic
aftermath.
   Lastly, the pandemic provides a rare opportunity to help us understand how educa-
tion institutions relate to other institutions and to their external environment under
conditions of rapid change. Much of what we know about the relationship of schools
to their external environment is based on research carried out in much more stable
contexts, where it is difficult to discern what is a cause and what is an effect. For
instance, there is robust evidence that schools often reflect and contribute to repro-
ducing social stratification, providing children from different social origins differ-
ential opportunities to learn, and resulting in children of poor parents receiving less
and lower quality schooling than children of more affluent parents. It is also the
case that educational attainment is a robust predictor of income. Increases in income
inequality correlate with increases in education inequality, although government
education policies have been shown to mitigate such a relationship (Mayer, 2010).
   The idea that education policy can mitigate the structural relationship between
education and income inequality suggests that the education system has certain
autonomy from the larger social structure. But disentangling to what extent school
policy and schools can just reproduce social structures or whether they can trans-
form social relations is difficult because changes in education inequality and social
inequality happen concurrently and slowly, which makes it difficult to establish
what is cause and what is effect. However, a pandemic is a rare rapid shock to that
external environment, the equivalent of a solar eclipse, and thus a singular oppor-
tunity to observe how schools and education systems respond when their external
environment changes, quite literally, overnight. Such a shock will predictably have
disproportionate impacts on the poor, via income and health effects, presenting a
unique opportunity to examine whether education policies are enacted to mitigate
the resulting disproportionate losses on educational opportunity from such income
and health shocks for the poor and to what extent they are effective.

1.3 A Stylized Global Summary of the Facts

A full understanding of the educational impact of the pandemic on systems, educa-
tors, and students will require an analysis of such impact in three time frames:
the immediate impact, taking place while the pandemic is ongoing; the immediate
6                                                                           F. M. Reimers

aftermath, as the epidemic comes under control, largely as a result of the popula-
tion having achieved herd immunity after the majority has been inoculated; and the
medium term aftermath, once education systems, societies, and economies return to
some stability. Countries will differ in the timeline at which they transition through
these three stages, as a function of the progression of the pandemic and success
controlling it, as a result of public health measures and availability, distribution, and
uptake of vaccines, and as a result of the possible emergence of new more virulent
strands of the virus which could slow down the efforts to contain the spread. There are
challenges involved in scaling up the production and distribution of vaccines, which
result in considerable inequalities in vaccination rates among countries of different
income levels. It is estimated that 11 billion doses of vaccines are required to achieve
global herd immunity (over 70% of the population vaccinated). By May 24, 2021,
a total of 1,545,967,545 vaccine doses had been administered (WHO, 2021a), but
75% of those vaccines have been distributed in only 10 high income countries (WHO,
2021c).
    Of the 9.5 billion doses expected to be available by the end of 2021, 6 billion doses
have already been purchased by high and upper middle-income countries, whereas
low- and lower-income countries—where 80% of the world population lives—have
only secured 2.6 billion, including the pledges to COVAX, an international develop-
ment initiative to vaccinate 20% of the world population (Irwin, 2021). At this rate,
it is estimated that it will take at least until the end of 2022 to vaccinate the lowest
income population in the world (Irwin, 2021).
    The educational impact of the pandemic in each of these timeframes will likely
differ, as will the challenges that educators and administrators face in each case,
with the result that the necessary policy responses will be different in each case. The
immediate horizon—what could be described as the period of emergency—can in
turn be further analyzed in various stages since, given the relatively long duration of
the pandemic, spanning over a year, schools and systems were able to evolve their
responses in tandem with the evolution of the epidemic and continued to educate to
varying degrees as a result of various educational strategies of education continuity
adopted during the pandemic. During the initial phase of this immediate impact, the
responses were reactive, with very limited information on their success, and with
considerable constraints in resources available to respond effectively. This initial
phase of the emergency was then followed by more deliberate efforts to continue
to educate, in some cases reopening schools—completely or in part—and by more
coordinated and comprehensive actions to provide learning opportunities remotely.
The majority of the analysis presented in this book focuses on this immediate horizon,
spanning the twelve months between January of 2020, when the pandemic was
beginning to extend beyond China, as the global outbreak was recognized on March
11, through December of 2020.
    The pandemic’s impact in the immediate aftermath and beyond will not be a focus
of this book, largely because most countries in the world have not yet reached a post-
pandemic stage, although the concluding chapter draws out implications from the
short-term impact and responses for that aftermath.
1 Learning from a Pandemic. The Impact of COVID-19 … 7
Education policy responses need to differentially address each of these three
timeframes: short-term mitigation of the impact during the emergency; immediate
remediation and recovery in the immediate aftermath; and medium-term recovery
and improvement after the initial aftermath of the pandemic.
As the epidemic spread from Wuhan, China—where it first broke out in December
of 2019—throughout the world, local and national governments suspended the oper-
ation of schools as a way to contain the rapid spread of the virus. Limiting gatherings
in schools, where close proximity would rapidly spread respiratory infections, had
been done in previous pandemics as a way to prevent excess demand for critical
emergency services in hospitals. Some evidence studying past epidemics suggested
in fact that closing schools contributed to slow down the spread of infections. A
study of non-pharmaceutical interventions adopted during the 1918–19 pandemic in
the United States shows that mortality was lower in cities that closed down schools
and banned public gatherings (Markel et al., 2007). A review of 79 epidemiolog-
ical studies, examining the effect of school closures on the spread of influenza and
pandemics, found that school closures contributed to contain the spread (Jackson
et al., 2013).
In January 26, China was the first country to implement a national lockdown of
schools and universities, extending the Spring Festival. As UNESCO released the first
global report on the educational impact of the pandemic on March 3, 2020, twenty-
two countries had closed schools and universities as part of the measures to contain
the spread of the virus, impacting 290 million students (UNESCO, 2020). Following
the World Health Organization announcement, on March 11, 2020, that COVID-19
was a global pandemic, the number of countries closing schools increased rapidly.
In the following days 79 countries had closed down schools (UNESCO, 2020).
Following the initial complete closure of schools in most countries around the
world there was a partial reopening of schools, in some cases combined with localized
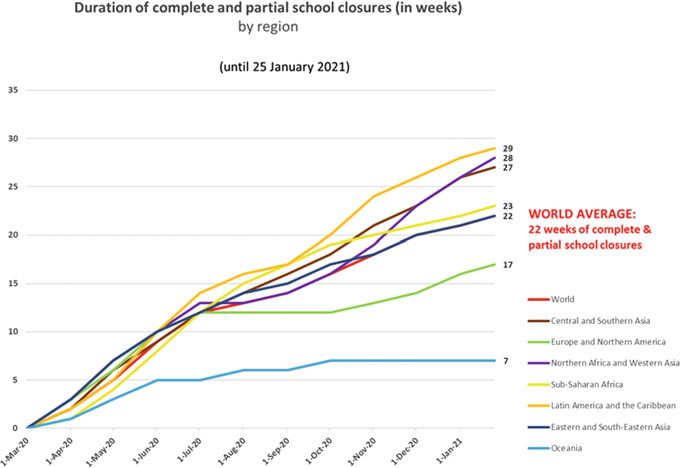
closings. By the end of January 2021, UNESCO estimated that globally, schools had
completely closed an average of 14 weeks, with the duration of school closures
extending to 22 weeks if localized closings were included (UNESCO, 2021). There
is great variation across regions in the duration of school closures, ranging from
20 weeks of complete national closings in Latin America and the Caribbean to just
one month in Oceania, and 10 weeks in Europe. There is similar variation with respect
to localized closures, from 29 weeks in Latin America and the Caribbean to 7 weeks
in Oceania, as seen in Fig. 1.1. By January 2021, schools were fully open in 101
countries.
As it became clear that it would take considerable time until a vaccine to
prevent infections would become available, governments began to consider options
to continue to educate in the interim. These options ranged from total or partial
reopening of schools to creating alternative means of delivery, via online instruction,
distributing learning packages, deploying radio and television, and using mobile
phones for one- or two-way communication with students. In most cases, deploying
these alternative means of education was a process of learning by doing, some-
times improvisation, with a rapid exchange of ideas across contexts about what
was working well and about much that was not working as intended. As previous8 F. M. Reimers
Fig. 1.1 Duration of complete and partial school closures by region by January 25, 2021. Source
UNESCO (2021)
experience implementing these measures in a similar context of school lockdown
was limited, there was not much systematized knowledge about what ‘worked’ to
transfer any approach with some confidence of what results it would produce in the
context created by the pandemic. As these alternatives were put in place, educators
and governments learned more about what needs they addressed, and about which
ones they did not.
For instance, it soon became apparent that the creation of alternative ways to
deliver instruction was only a part of the challenge. Since in many jurisdictions
schools deliver a range of services—from food to counseling services—in addition
to instruction, it became necessary to find alternative ways to deliver those services
as well, not just to meet recognized needs prior to the pandemic but because the
emergency was increasing poverty, food insecurity, and mental health challenges,
making such support services even more essential.
As governments realized that the alternative arrangements to deliver education
had diminished the capacity to achieve the instructional goals of a regular academic
year, it became necessary to reprioritize the focus of instruction.
In a study conducted at the end of April and beginning of May 2020, based on a
survey administered to a haphazard sample of teachers and education administrators
in 59 countries, we found that while schools had been closed in all cases, plans
for education continuity had been implemented in all countries we had surveyed.
Those plans involved using existing online resources, online instruction delivered
by students’ regular teachers, instructional packages with printed resources, and1 Learning from a Pandemic. The Impact of COVID-19 … 9
educational television programmes. The survey revealed severe disparities in access
to connectivity, devices, and the skills to use them among children from different
socio-economic backgrounds. On balance, however, the strategies for educational
continuity were rated favourably by teachers and administrators, who believed they
had provided effective opportunities for student learning. These strategies prioritized
academic learning and provided support for teachers, whereas they gave less priority
to the emotional and social development of students.
These strategies deployed varied mechanisms to support teachers, primarily by
providing them access to resources, peer networks within the school and across
schools, and timely guidance from leadership. A variety of resources were used to
support teacher professional development, mostly relying on online learning plat-
forms, tools that enabled teachers to communicate with other teachers, and virtual
classrooms (Reimers & Schleicher, 2020).
Some countries relied more heavily on some of these approaches, while others
used a combination, as reported by UNESCO and seen in Fig. 1.2.
A significant number of children did not have access to the online solutions
provided because of lack of connectivity, as shown in a May 2020 report by UNESCO.
In Sub-Saharan Africa, a full 80% of children lacked internet at home; this figure
was 49% in Asia Pacific; 34% in the Arab States and 39% in Latin America, but it
was only 20% in Eastern Europe and Central Asia and 14% in Western Europe and
North America (Giannini, 2020).
Similar results were obtained by a subsequent cross-national study adminis-
tered to senior education planning officials in ministries of education, conducted
by UNESCO, UNICEF, and the World Bank. These organizations administered
two surveys between May and June 2020, and between July and October 2020,
to government officials in 118 and 149 countries, respectively. The study docu-
mented extended periods of school closures. The study further documented differ-
ences among countries in whether student learning was monitored, with much greater
levels of monitoring in high income countries than in lower income countries.
Fig. 1.2 Government-initiated distance learning solutions and intended reach. Source Giannini
(2020)10 F. M. Reimers
Fig. 1.3 Share of students with Internet at home in countries relying exclusively on online learning
platforms. Source Giannini (2020)
The study also confirmed that most governments created alternative education
delivery systems during the period when schools were closed, through a variety of
modalities including online platforms, television, radio, and paper-based instruc-
tional packages. Governments also adopted targeted measures to support access to
these platforms for disadvantaged students, provided devices or subsidized connec-
tivity, and supported teachers and caregivers. The report shows disparities between
countries at different income levels, with most high-income countries providing such
support and a third of lower income countries not providing any specific support for
connectivity to low-income families (UNESCO-UNICEF-the World Bank, 2020).
The UNESCO-UNICEF-World Bank surveys reveal considerable differences in
the education responses by level of income of the country. For instance, whereas
by the end of September of 2020 schools in high-income countries had been closed
27 days, on average, that figure increased to 40 days in middle-income countries, to
68 days in lower middle-income countries, and to 60 days in low-income countries
(Ibid, 15).
For most countries there were no plans to systematically assess levels of students’
knowledge and skills as schools reopened, and national systematic assessments were
suspended in most countries. There was considerable variation across countries,
and within countries, in terms of when schools reopened and how they did so.
Whereas some countries offered both in-person and remote learning options—and
gave students a choice of which approach to use—others did not offer choices. There
were also variations in the amount of in-person instruction students had access to once
schools reopened. Some schools and countries introduced measures to remediate
learning loss as schools reopened, but not all did.1 Learning from a Pandemic. The Impact of COVID-19 … 11
1.4 The Backdrop to the Pandemic: Enormous
and Growing Inequality and Social Exclusion
The pandemic impacted education systems as they faced two serious interrelated
preexisting challenges: educational inequality and insufficient relevance. A consid-
erable growth in economic inequality, especially among individuals within the same
nations, has resulted in challenges of social inclusion and legitimacy of the social
contract, particularly in democratic societies. Over the last thirty years, income
inequality has increased in countries such as China, India, and most developed coun-
tries. Over the last 25 years there are also considerable inequalities between nations,
even though those have diminished over the last 25 years. The average income of a
person in North America is 16 times greater than the income of the average person in
Sub-Saharan Africa. 71% of the world’s population live in countries where inequality
has grown (UN, 2021). The Great Recession of 2008–2009 worsened this inequality
(Smeedling, 2012).
One of the correlates of income inequality is educational inequality. Studies show
that educational expansion (increasing average years of schooling attainment and
reducing inequality of schooling) relates to a reduction in income inequality (Coadi &
Dizioly, 2017). But education systems, more often than not, reflect social inequalities,
as they offer the children of the poor, often segregated in schools of low quality,
deficient opportunities to learn skills that help them improve their circumstances,
whereas they provide children from more affluent circumstances opportunities to gain
knowledge and skills that give them access to participate economically and civically.
In doing so, schools serve as a structural mechanism that reproduces inequality, and
indeed legitimize it as they obscure the structural forces that sort individuals into
lives of vastly different well-being with an ideology of meritocracy that in effect
blames the poor for the circumstances that their lack of skills lead to, when they have
not been given effective opportunities to develop such skills.
There is abundant evidence of the vastly different learning outcomes achieved by
students from different social origins, and of the differences in the educational envi-
ronments they have access to. In the most recent assessment of student knowledge
and skills conducted by the Organization for Economic Cooperation and Develop-
ment (OECD), the socioeconomic status of students is significantly correlated to
student achievement in literacy, math, and science in all 76 countries participating
in the study (OECD, 2019). On average, among OECD countries, 12% of the vari-
ance in reading performance is explained by the socioeconomic background of the
student. The strength of this relationship varies across countries, in some of them
it is lower than the average as is the case in Macao (1.7%), Azerbaijan (4.3%),
Kazakhstan (4.3%), Kosovo (4.9%), Hong Kong (5.1%), or Montenegro (5.8%).
In other countries, the strength of the relationship between socioeconomic back-
ground and reading performance is much greater than the average such as in Belarus
(19.8%), Romania (18.1%), Philippines (18%), or Luxembourg (17.8%). A signif-
icant reading gap exists between the students in the bottom 25% and those in the
top 25% of the socioeconomic distribution, averaging 89 points, which is a fifth of12 F. M. Reimers
the average reading score of 487, and almost a full standard deviation of the global
distribution of reading scores in PISA. In spite of these strong associations between
social background and reading achievement, there are students who defy the odds; the
percentage of students whose social background is at the bottom 25%—the poorest
students—whose reading performance is in the top 25%—academically resilient
students—averages 11% across all OECD countries. This percentage is much greater
in the countries where the relationship between social background and achievement is
lower. In Macao, for instance, 20% of the students in the top 25% of achievement are
among the poorest 25%. In contrast, in countries with a strong relationship between
socioeconomic background and reading achievement, the percentage of academi-
cally resilient students among the poor is much lower, in Belarus and Romania it is
9%. These differences in reading skills by socioeconomic background are even more
pronounced when looking at the highest levels of reading proficiency, those at which
students can understand long texts that involve abstract and counterintuitive concepts
as well as distinguish between facts and opinions based on implicit clues about the
source of the information. Only 2.9% of the poorest students, compared with 17.4%
among the wealthier quarter, can read at those levels of proficiency on average for
the OECD (OECD, 2019b, p. 58). Table 1.1 summarizes socioeconomic disparities
in reading achievement. The relationship of socioeconomic background to students’
knowledge and skills is stronger for math and science. On average, across the OECD,
13.8% of math skills and 12.8% of science skills are predicted by socioeconomic
background.
The large number of children who fail to gain knowledge and skills in schools has
been characterized, by World Bank staff and others, as ‘a global learning crisis’ or
‘learning poverty’, though the evidence on the strong correlation of learning poverty
to family poverty suggests that this should more aptly be characterized as ‘the learning
crisis for the children of the poor’ (World Bank, 2018). These low levels of learning
have direct implications for the ability of students to navigate the alternative education
arrangements put in place to educate during the pandemic; clearly students who can
read at high levels are more able to study independently through texts and other
resources than struggling readers.
The second interrelated challenge is that of ensuring that what ALL children learn
in school is relevant to the challenges of the present and, most importantly, of the
future. While the challenge of the relevance of learning is not new in education, the
rapid developments in societies, resulting from technologies and politics, create a new
urgency to address it. For students with the capacity to set personal learning goals, or
with more self-management skills, or with greater skills in the use of technology, or
with greater flexibility and resiliency, or with prior experience with distance learning,
it was easier to continue to learn through the remote arrangements established to
educate during the pandemic than it was for students with less developed skills in
those domains. While the emphasis on the development of such breadth of skills, also
called twenty-first century skills, has been growing around the world, as reflected in
a number of recent curriculum reforms, there are large gaps between the ambitious
aspirations reflected in modern curricula and standards, and the implementation of
those reforms and instructional practice (Reimers, 2020b; Reimers, 2021).Table 1.1 Snapshot of socio-economic disparities in academic performance
Countries/economies with a mean performance/strength of socio-economic gradient/share of resilient students above the OECD
average
Countries/economies with a mean performance/strength of socio-economic gradient/share of resilient students not significantly
different from the OECD average
Countries/economies with a mean performance/strength of socio-economic gradient/share of resilient students below the OECD
average
Mean reading score in Coverage Index 3: Strength: percentage of Difference between Percentage of
PISA 2018 coverage of 15-year-old variance in reading advantaged2 and disadvantaged students
population performance explained disadvantaged who are academically
by ESCS1 (R2 ) students in reading resilient3
Mean % Score dif %
OECD average 487 M 12.0 89 11
B-S-J-Z (China) 555 0.81 12.6 82 12
Singapore 549 0.95 13.2 104 10
Macao (China) 525 0.88 1.7 31 20
Hong Kong (China) 524 0.98 5.1 59 16
1 Learning from a Pandemic. The Impact of COVID-19 …
Estonia 523 0.93 6.2 61 16
Canada 520 0.86 6.7 68 14
Finland 520 0.96 9.2 79 13
Ireland 518 0.96 10.7 75 13
Korea 514 0.88 8.0 75 13
Poland 512 0.90 11.6 90 11
Sweden 506 0.86 10.7 89 11
New Zealand 506 0.89 12.9 96 12
(continued)
13Table 1.1 (continued)
14
Countries/economies with a mean performance/strength of socio-economic gradient/share of resilient students above the OECD
average
Countries/economies with a mean performance/strength of socio-economic gradient/share of resilient students not significantly
different from the OECD average
Countries/economies with a mean performance/strength of socio-economic gradient/share of resilient students below the OECD
average
Mean reading score in Coverage Index 3: Strength: percentage of Difference between Percentage of
PISA 2018 coverage of 15-year-old variance in reading advantaged2 and disadvantaged students
population performance explained disadvantaged who are academically
by ESCS1 (R2 ) students in reading resilient3
Mean % Score dif %
United States 505 0.86 12.0 99 10
United Kingdom 504 0.85 9.3 80 14
Japan 504 0.91 8.0 72 12
Australia 503 0.89 10.1 89 13
Chinese Taipei 503 0.92 11.4 89 12
Denmark 501 0.88 9.9 78 12
Norway 499 0.91 7.5 73 12
Germany 498 0.99 17.2 113 10
Slovenia 495 0.98 12.1 80 12
(continued)
F. M. ReimersTable 1.1 (continued)
Countries/economies with a mean performance/strength of socio-economic gradient/share of resilient students above the OECD
average
Countries/economies with a mean performance/strength of socio-economic gradient/share of resilient students not significantly
different from the OECD average
Countries/economies with a mean performance/strength of socio-economic gradient/share of resilient students below the OECD
average
Mean reading score in Coverage Index 3: Strength: percentage of Difference between Percentage of
PISA 2018 coverage of 15-year-old variance in reading advantaged2 and disadvantaged students
population performance explained disadvantaged who are academically
by ESCS1 (R2 ) students in reading resilient3
Mean % Score dif %
Belgium 493 0.94 17.2 109 9
France 493 0.91 17.5 107 10
Portugal 492 0.87 13.5 95 10
Czech Republic 490 0.95 16.5 105 9
Netherlands 485 0.91 10.5 88 13
1 Learning from a Pandemic. The Impact of COVID-19 …
Austria 484 0.89 13.0 93 10
Switzerland 484 0.89 15.6 104 9
Croatia 479 0.89 7.7 63 15
Latvia 479 0.89 7.2 65 12
(continued)
15Table 1.1 (continued)
16
Countries/economies with a mean performance/strength of socio-economic gradient/share of resilient students above the OECD
average
Countries/economies with a mean performance/strength of socio-economic gradient/share of resilient students not significantly
different from the OECD average
Countries/economies with a mean performance/strength of socio-economic gradient/share of resilient students below the OECD
average
Mean reading score in Coverage Index 3: Strength: percentage of Difference between Percentage of
PISA 2018 coverage of 15-year-old variance in reading advantaged2 and disadvantaged students
population performance explained disadvantaged who are academically
by ESCS1 (R2 ) students in reading resilient3
Mean % Score dif %
Russia 479 0.94 7.3 67 13
Italy 476 0.85 8.9 75 12
Hungary 476 0.90 19.1 113 8
Lithuania 476 0.90 13.2 89 11
Iceland 474 0.92 6.6 72 13
Belarus 474 0.88 19.8 102 9
Israel 470 0.81 14.0 121 8
Luxembourg 470 0.87 17.8 122 8
Ukraine 466 0.87 14.0 90 12
(continued)
F. M. ReimersTable 1.1 (continued)
Countries/economies with a mean performance/strength of socio-economic gradient/share of resilient students above the OECD
average
Countries/economies with a mean performance/strength of socio-economic gradient/share of resilient students not significantly
different from the OECD average
Countries/economies with a mean performance/strength of socio-economic gradient/share of resilient students below the OECD
average
Mean reading score in Coverage Index 3: Strength: percentage of Difference between Percentage of
PISA 2018 coverage of 15-year-old variance in reading advantaged2 and disadvantaged students
population performance explained disadvantaged who are academically
by ESCS1 (R2 ) students in reading resilient3
Mean % Score dif %
Turkey 466 0.73 11.4 76 15
Slovak Republic 458 0.86 17.5 106 9
Greece 457 0.93 10.9 84 12
Chile 452 0.89 12.7 87 11
Malta 448 0.97 7.6 85 13
1 Learning from a Pandemic. The Impact of COVID-19 …
Serbia 439 0.88 7.8 73 13
United Arab Emirates 432 0.92 11.1 105 7
Romania 428 0.71 18.1 109 9
Uruguay 427 0.77 16.0 99 9
(continued)
17Table 1.1 (continued)
18
Countries/economies with a mean performance/strength of socio-economic gradient/share of resilient students above the OECD
average
Countries/economies with a mean performance/strength of socio-economic gradient/share of resilient students not significantly
different from the OECD average
Countries/economies with a mean performance/strength of socio-economic gradient/share of resilient students below the OECD
average
Mean reading score in Coverage Index 3: Strength: percentage of Difference between Percentage of
PISA 2018 coverage of 15-year-old variance in reading advantaged2 and disadvantaged students
population performance explained disadvantaged who are academically
by ESCS1 (R2 ) students in reading resilient3
Mean % Score dif %
Costa Rica 426 0.63 15.6 83 10
Cyprus 424 0.92 6.8 69 13
Moldova 424 0.95 17.3 102 8
Montenegro 421 0.95 5.8 55 14
Mexico 420 0.66 13.7 81 11
Bulgaria 420 0.72 15.0 106 6
Jordan 419 0.57 7.7 64 12
Malaysia 415 0.72 16.3 89 10
Brazil 413 0.56 14.0 97 10
(continued)
F. M. ReimersTable 1.1 (continued)
Countries/economies with a mean performance/strength of socio-economic gradient/share of resilient students above the OECD
average
Countries/economies with a mean performance/strength of socio-economic gradient/share of resilient students not significantly
different from the OECD average
Countries/economies with a mean performance/strength of socio-economic gradient/share of resilient students below the OECD
average
Mean reading score in Coverage Index 3: Strength: percentage of Difference between Percentage of
PISA 2018 coverage of 15-year-old variance in reading advantaged2 and disadvantaged students
population performance explained disadvantaged who are academically
by ESCS1 (R2 ) students in reading resilient3
Mean % Score dif %
Colombia 412 0.62 13.7 86 10
Brunei Darussalam 408 0.97 16.0 103 9
Qatar 407 0.92 8.6 93 9
Albania 405 0.46 7.8 61 12
Bosnia and Herzegovina 403 0.82 7.3 58 13
1 Learning from a Pandemic. The Impact of COVID-19 …
Argentina 402 0.81 17.1 102 8
Peru 401 0.73 21.5 110 6
Saudi Arabia 399 0.85 11.5 74 11
Thailand 393 0.72 12.0 69 13
(continued)
19Table 1.1 (continued)
20
Countries/economies with a mean performance/strength of socio-economic gradient/share of resilient students above the OECD
average
Countries/economies with a mean performance/strength of socio-economic gradient/share of resilient students not significantly
different from the OECD average
Countries/economies with a mean performance/strength of socio-economic gradient/share of resilient students below the OECD
average
Mean reading score in Coverage Index 3: Strength: percentage of Difference between Percentage of
PISA 2018 coverage of 15-year-old variance in reading advantaged2 and disadvantaged students
population performance explained disadvantaged who are academically
by ESCS1 (R2 ) students in reading resilient3
Mean % Score dif %
North Macedonia 393 0.95 10.2 80 13
Baku (Azerbaijan) 389 0.46 4.3 41 17
Kazakhstan 387 0.92 4.3 40 16
Georgia 380 0.83 9.4 68 12
Panama 377 0.53 17.0 95 9
Indonesia 371 0.85 7.8 52 14
Morocco 359 0.64 7.1 51 13
Lebanon 353 0.87 12.2 103 9
Kosovo 353 0.84 4.9 40 17
(continued)
F. M. ReimersTable 1.1 (continued)
Countries/economies with a mean performance/strength of socio-economic gradient/share of resilient students above the OECD
average
Countries/economies with a mean performance/strength of socio-economic gradient/share of resilient students not significantly
different from the OECD average
Countries/economies with a mean performance/strength of socio-economic gradient/share of resilient students below the OECD
average
Mean reading score in Coverage Index 3: Strength: percentage of Difference between Percentage of
PISA 2018 coverage of 15-year-old variance in reading advantaged2 and disadvantaged students
population performance explained disadvantaged who are academically
by ESCS1 (R2 ) students in reading resilient3
Mean % Score dif %
Dominican Republic 342 0.73 8.9 65 12
Philippines 340 0.68 18.0 88 8
Spain M 0.92 M M m
Source (OECD, 2019b, Table II.1. p. 17)
1 Learning from a Pandemic. The Impact of COVID-19 …
2122 F. M. Reimers
The challenges of low efficacy and relevance have received attention from govern-
ments and from international development agencies, including the United Nations
and the OECD. The UN Sustainable Development Goals, for instance, propose a
vision for education that aligns with achieving an inclusive and sustainable vision
for the planet, even though, by most accounts, the resources deployed to finance the
achievement of the education goal fall short with respect to those ambitions. In 2019
UNESCO’s director general tasked an international commission with the preparation
of a report on the Futures of Education, focusing in particular on the question of how
to align education institutions with the challenges facing humanity and the planet.
1.5 The Pandemic and Health
The main direct effect of the Coronavirus disease is in infecting people, compro-
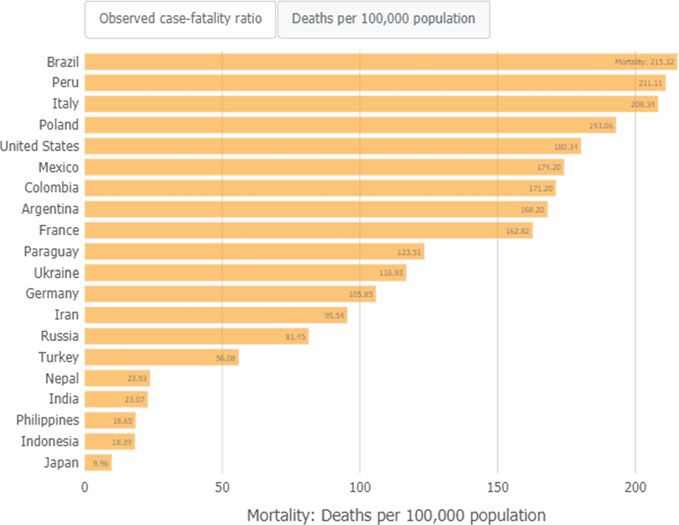
mising their health and in some cases causing their death. By May 27 of 2021,
168,040,871 people worldwide had become infected, of whom 3,494,758 had died
reportedly from COVID-19 (World Health Organization, 2021a) and an additional
3 million had likely died from COVID-19 as they were excess deaths relative to the
total number of deaths the previous year (World Health Organization, 2021b). As
expected, more people are infected in countries with larger populations, but the rate
of infection by total population and the rate of deaths by total population suggest
variations in the efficacy of health policies used to contain the spread as shown in
Fig. 1.4, which includes the top 20 countries with the highest relative number of
COVID-19 fatalities. These differences reflect differences in the efficacy of health
policies to contain the pandemic, as well as differences in the response of the popula-
tion to guidance from public health authorities. Countries in which political leaders
did not follow science-based advice to contain the spread, and in which a consider-
able share of the population did not behave in ways that contributed to mitigate the
spread of the virus, not wearing face masks or socially distancing for instance, such
as in Brazil and the United States, fared much poorer than those who did implement
effective public health containment measures such as China, South Korea, or Singa-
pore, with such low numbers of deaths per 100,000 people that they are not even on
this chart of the top 20.
1.6 The Pandemic, Poverty, and Inequality
The social distancing measures limited the ability of business to operate, reducing
household income and demand. This produced an economic recession in many coun-
tries. For example, in the United States, 43% of small businesses closed temporarily
(Bartik et al., 2020).
A household survey in seventeen countries in Latin America and the Caribbean
demonstrates that the COVID-19 pandemic differentially impacted households at1 Learning from a Pandemic. The Impact of COVID-19 … 23 Fig. 1.4 Number of reported COVID-19 deaths per 100,000 population in the 20 countries with the highest rates as of May 27, 2021. Source Johns Hopkins University. Coronavirus Resource Center (2021) different income levels. The study shows significant and unequal job losses with stronger effects among the lowest income households. The study revealed that 45% of respondents reported that a member of their household had lost a job and that, for those owning a small family business, 58% had a household member who had closed their business. These effects are considerably more pronounced among the households with lower incomes, with nearly 71 percent reporting that a household member lost their job and 61 percent reporting that a household member closed their business compared to only 14 percent who report that a household member lost their job and 54 percent reporting that a household member closed their business among those households with higher incomes (Bottan et al., 2020). It is estimated that the global recession augmented global extreme poverty by 88 million people in 2020, and an additional 35 million in 2021 (World Bank, 2020). A survey conducted by UNICEF in Mexico documented a 6.7% increase in hunger and a 30% loss in household income between May and July of 2020 (UNICEF México, 2020). Because schools in some countries offer a delivery channel for meals as part of poverty reduction programming, several countries created alternative arrangements during the pandemic to deliver those or replaced them with cash transfer programs.
24                                                                          F. M. Reimers

Sao Paulo, Brazil, for instance, created a cash transfer program “Merenda en Casa”
to replace the daily meal school programs (Dellagnelo & Reimers, 2020; Sao Paulo
Government, 2020).
    In the summer of 2020, Save the Children conducted a survey of children and
families in 46 countries to examine the impact of the crisis, focusing on participants in
their programs, other populations of interest, and the general public. The report of the
findings for program participants—which include predominantly vulnerable children
and families—documents violence at home, reported in one third of the households.
Most children (83%) and parents (89%) reported an increase in negative feelings
due to the pandemic and 46% of the parents reported psychological distress in their
children. For children who were not in touch with their friends, 57% were less happy,
54% were more worried, and 58% felt less safe. For children who could interact with
their friends less than 5% reported similar feelings. Children with disabilities showed
an increase in bed-wetting (7%) and unusual crying and screaming (17%) since the
outbreak of the pandemic, an increase three times greater than for children without
disabilities. Children also reported an increase in household chores assigned to them,
63% for girls and 43% for boys, and 20% of the girls said their chores were too many
to be able to devote time to their studies, compared to 10% of boys (Ritz et al., 2020).

1.7 Readiness for Remote Teaching During a Pandemic

Countries varied in the extent to which they had, prior to the pandemic, supported
teachers and students in developing the capacities to teach and to learn online, and
they varied also in the availability of resources which could be rapidly deployed as
part of the remote strategy of educational continuity. Table 1.2 shows the extent to
which teachers were prepared to use Information and Communication Technologies
(ICT) in their teaching based on a survey administered by the OECD in 2018. The
percentage of teachers who report that the use of ICT was part of their teacher prepa-
ration ranges from 37 to 97%. There is similar variation in the percentage of teachers
who feel adequately prepared to use ICT, or who have received recent professional
development in ICT, or who feel a high need for professional development in ICT.
There is also quite a range in the percentage of teachers who regularly allow students
to use ICT as part of their schoolwork.
    This variation, along with variation in availability of technology and connectivity
among students, creates very different levels of readiness to teach remotely online
as part of the strategy of educational continuity during the interruption of in-person
instruction.
1 Learning from a Pandemic. The Impact of COVID-19 … 25
Table 1.2 Readiness to use ICT in teaching
Countries/economies where the indicator is above the OECD average
Countries/economies where the indicator is not statistically different from the
OECD average
Countries/economies where the indicator is below the OECD average
Percentage Percentage Percentage Percentage Percentage Percentage
of teachers of teachers of teachers of teachers of teachers of
for whom who felt for whom reporting a who principals
the “use of “well “use of ICT high level of “frequently” reporting
ICT for prepared” for teaching” need for or “always” shortage or
teaching” or “very has been professional let students inadequacy
has been well included in development use ICT for of digital
included in prepared” their recent in ICT skills projects or technology
their for the use professional for teaching class work for
formal of ICT for development instruction
education teaching activities
or training
Chapter 4 Chapter 4 Chapter 5 Chapter 5 Chapter 2 Chapter 3
Alberta 71 42 56 8 66 12
(Canada)
Australia* 65 39 67 11 78 12
Austria 40 20 46 15 33 18
Belgium 51 28 40 18 29 29
- Flemish 56 34 45 9 38 16
Comm.
(Belgium)
Brazil 64 64 52 27 42 59
Bulgaria 58 50 63 23 44 26
CABA 53 50 61 20 64 39
(Argentina)
Chile 77 67 51 17 63 13
Colombia 75 59 78 34 71 64
Croatia 47 36 73 26 46 25
Czech 45 28 41 13 35 24
Republic
Denmark 47 40 47 11 90 13
England 75 51 40 5 41 15
(UK)
Estonia 54 30 74 19 46 12
Finland 56 21 74 19 51 20
France 51 29 50 23 36 30
Georgia 45 47 67 33 53 29
(continued)26 F. M. Reimers
Table 1.2 (continued)
Countries/economies where the indicator is above the OECD average
Countries/economies where the indicator is not statistically different from the
OECD average
Countries/economies where the indicator is below the OECD average
Percentage Percentage Percentage Percentage Percentage Percentage
of teachers of teachers of teachers of teachers of teachers of
for whom who felt for whom reporting a who principals
the “use of “well “use of ICT high level of “frequently” reporting
ICT for prepared” for teaching” need for or “always” shortage or
teaching” or “very has been professional let students inadequacy
has been well included in development use ICT for of digital
included in prepared” their recent in ICT skills projects or technology
their for the use professional for teaching class work for
formal of ICT for development instruction
education teaching activities
or training
Hungary 51 66 69 20 48 36
Iceland 46 26 63 21 54 5
Israel* 58 47 69 29 52 40
Italy 52 36 68 17 47 31
Japan 60 28 53 39 18 34
Kazakhstan 75 69 90 30 66 45
Korea 59 48 61 21 30 24
Latvia 55 48 77 23 48 41
Lithuania 45 57 69 24 62 30
Malta 70 49 48 14 48 6
Mexico 77 80 64 16 69 44
Netherlands 49 29 61 16 51 16
New 59 34 73 14 80 18
Zealand
Norway 46 36 58 22 m 11
Portugal 47 40 47 12 57 55
Romania 70 70 52 21 56 50
Russian 69 72 75 15 69 32
Federation
(continued)1 Learning from a Pandemic. The Impact of COVID-19 … 27
Table 1.2 (continued)
Countries/economies where the indicator is above the OECD average
Countries/economies where the indicator is not statistically different from the
OECD average
Countries/economies where the indicator is below the OECD average
Percentage Percentage Percentage Percentage Percentage Percentage
of teachers of teachers of teachers of teachers of teachers of
for whom who felt for whom reporting a who principals
the “use of “well “use of ICT high level of “frequently” reporting
ICT for prepared” for teaching” need for or “always” shortage or
teaching” or “very has been professional let students inadequacy
has been well included in development use ICT for of digital
included in prepared” their recent in ICT skills projects or technology
their for the use professional for teaching class work for
formal of ICT for development instruction
education teaching activities
or training
Saudi 73 72 76 28 49 61
Arabia
Shanghai 79 63 77 30 24 10
(China)
Singapore 88 60 75 14 43 2
Slovak 62 45 60 17 47 25
Republic
Slovenia 53 67 59 8 37 4
South 62 54 53 32 38 65
Africa
Spain 38 36 68 15 51 21
Sweden 37 37 67 22 63 10
Turkey 74 71 61 7 67 22
United 86 86 85 10 77 31
Arab
Emirates
United 63 45 60 10 60 19
States
Viet Nam 97 80 93 55 43 82
OECD 56 43 60 18 53 25
average-31
Source OECD, TALIS 2018 Database, Tables I.4.13, I.4.13, I.5.18, I.5.21, I.2.1 and I.3.63
*Participation rate of principals is too low to ensure comparability for principals’ reports and country
estimates are not included in the OECD average. Information on data for Israel: https://oe.cd/israel-
disclaimerYou can also read