Lawn below the Royal Crescent Ha-ha, Bath - Further geophysical study - 20-25 September 2021
←
→
Page content transcription
If your browser does not render page correctly, please read the page content below
Lawn below the
 Royal Crescent
  Ha-ha, Bath
Further geophysical study

   20-25 September 2021

Janet Pryke and John Oswin
                             i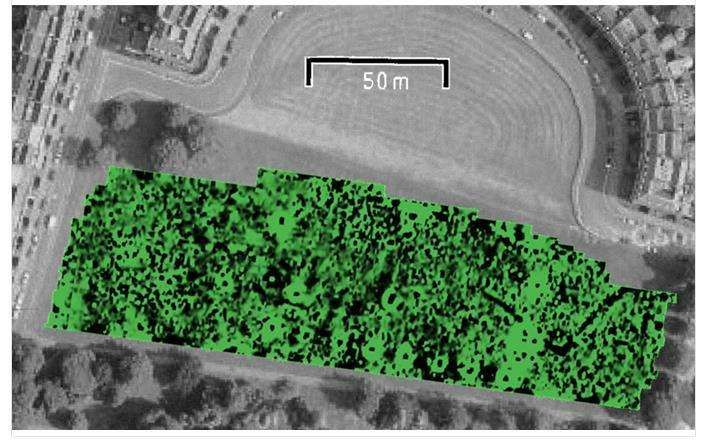
DRAFT

Lawn below the Royal Crescent Ha-ha, Bath

         Report on a further geophysical survey

         Bath and Counties Archaeology Society
                        ©2021

              Janet Pryke and John Oswin

                                                  i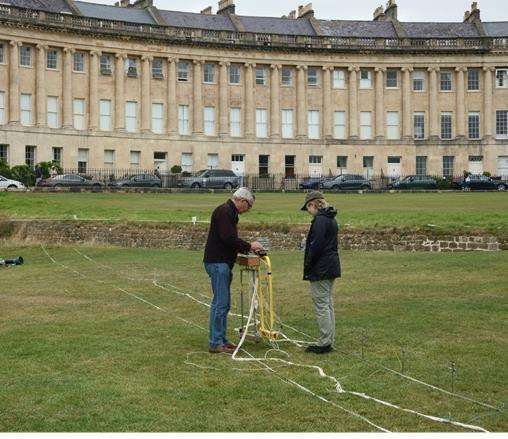
Summary

The lawn below the Royal Crescent Ha-ha in Bath was part of an archaeological investigation in
2002 for a Time Team television programme on Channel 4. In this they confirmed the route of
and excavated a known Roman road across this lawn, and also revealed and excavated a ditch
containing Bronze Age remains. Our previous work extended the geophysical part of this work,
and we obtained some results indicating other possible developments in the area. This is a
continuation of this work. This shows a linear high resistivity feature extending from the north
west towards the south east under the lawn, appearing to at depth beyond the proposed Roman
road line. This is adjacent to and parallel to a very deep and wide low resistivity volume crossing
the area. Our results also indicate differential resistivity results at depth below the soil. These
may indicate that these areas may have been filled or levelled over time, a process either man-
made or following down-slip from the hillside, with subsequent development on the new ground
level.

                                                                                                  i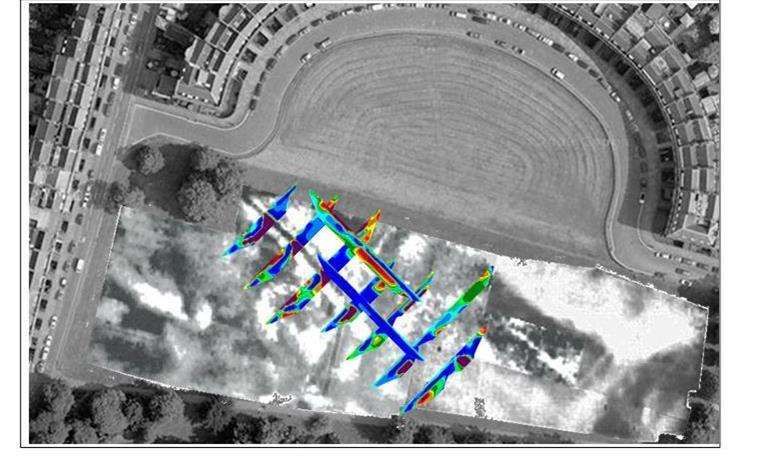
Table of Contents

Summary                                                                         i
Table of Contents                                                               ii
List of Figures                                                                 iii
Acknowledgements                                                                iv
1     Introduction                                                              1
1.1 Location                                                                    1
1.2 Background information                                                      1
1.3 Scope                                                                       6
2     Survey Method                                                             7
2.1 Gridding                                                                    7
2.2 Resistivity profiling                                                       7
2.3 Topographical readings                                                      7
2.4 Programme                                                                   7
3     Results                                                                   8
3.1 Topography                                                                  8
3.2 Profile layout                                                              8
3.3 Results from profiles crossing the linear features (A) in Figure 3          9
3.4 Results from NW-SE profiles crossing the area                               11
3.5 Results from profiles crossing the NW edge of the linear deep low resistance
      volume extending NW to SE across the area                                 13
4     Discussion                                                                15
References                                                                      18
Appendix
Individual profiles from project                                                19

                                                                                      ii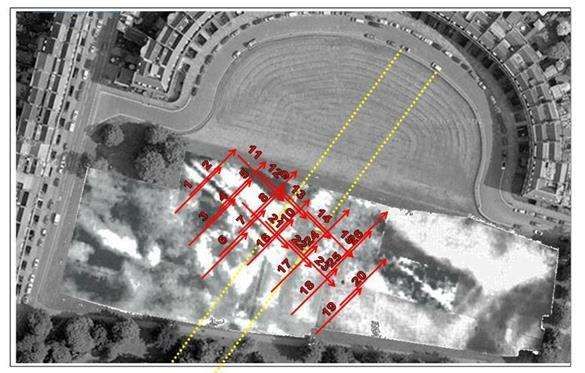
List of Figures

1.1   The lawn below the Royal Crescent Ha-ha                                       1
1.2   Parch marks in the lawn observed in dry summers                               2
1.3   The composite of the resistance results from Time Team and our work.          3
1.4   Results from our previous work showing the corner of the enclosure
1.5   Magnetometry over the lawn                                                    5
3.1   The Royal Crescent lawn and the lawn below the Ha-ha showing the
      heights in m                                                                  8
3.2   The arrangement of the profiles                                               8
3.3   Profiles crossing the linear features (A) shown in Figure 1.3                 9
3.4   Profiles 16-19 continuing the line of the high resistance feature to the SW   10
3.5   Profiling lines crossing the Roman road line                                  11
3.6   Profiles crossing the proposed Roman road route showing surface detail        12
3.7   Profiles running SE-NW towards the Ha-ha                                      13
4.1   The profiles taken during this project assembled                              15

                                                                                         iii
ACKNOWLEDGEMENTS
Permission for the survey was obtained from the B&NES Parks department. It is a
continuation of the project discussed with and supported by the (then) Bath & North East
Somerset Council (B&NES) Archaeological Officer, Richard Sermon.

Many thanks go to the group of the Society’s volunteers who have helped with this work:
Tim Lunt, Sharn Pepperell, Ian Perkins, John Knapper, Terri Bell, Julie Bielovich, Rick
Buettner (and for photographing this survey) and Linda Barrow. Thanks are due to
BACAS for supplying the equipment and also for their encouragement and support, to
many of its members for discussion over the years, and to Robin Holley its Director of
Archaeology when this project was being planned for his advice.

We are also very grateful for the permission to use results in our continued work from the
report by Dr John Gater (of then Geoscan, GSB Prospection Ltd, now SUMO Group).
We acknowledge and appreciate the help, comments and advice that has also been given
by Ian Brooks of Engineering Archaeological Services (EAS), Clare Baxter, Collections
Manager of the Alnwick Castle collection, Dirk Booms and Paul Roberts then of the
British Museum, during the previous work, and from Susan Fox and Zofia
Matyjaszkiewicz of the Roman Baths Museum, Maurice Tucker of Bath Geological
Society, and all the help given from the Bath Record Office. Through the project there is
especially appreciation of the guidance and advice from Marek Lewcun and the
discussion with Peter Davenport.
Acknowledgement is due for the publicly available information from the Environment
Agency for LiDAR data and to Google Maps.

                                                                                        iv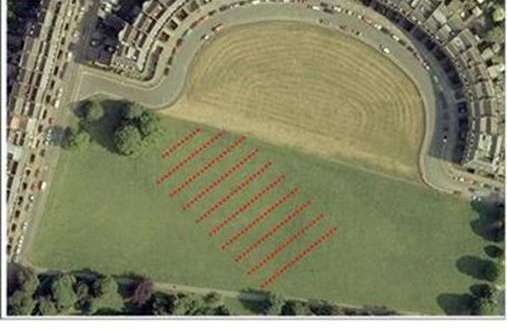
1. INTRODUCTION

1.1 Location
This is the report of a geophysical investigation of the lawn below the Royal Crescent
Ha-ha, Bath. It was designed to analyse part of this area in more detail and to relate these
results to previous geophysics in this area including to our work from 2012 and 2013.1,2,3
The lawn is within the Bath Conservation Area and the World Heritage Site. The Royal
Victoria Park is in the English Heritage Register of Historic Parks and Gardens. The
lawn is owned by Bath & North East Somerset Council (B&NES).
The area is on the north slope of the Avon river valley. Its geology is in a layer of
Charmouth Mudstone. The area includes limestone as seen in the quarry in the Park to
the west. To its north are the Fullers Earth and Inferior Oolite layers of the higher slopes
of Lansdown.
No development is known on the site before the building of the Royal Crescent. It had
been agricultural land, being part of Barton Middle Field (Barton Farm). When the Royal
Crescent was built the fields in front of it became known as the Crescent Fields.
This project involved resistivity profiling of a section of the area shown in Figure 1.1.

                                                                Figure 1.1 The lawn below the
                                                                Royal Crescent Ha-ha,
                                                                separated from the curved-
                                                                edged Royal Crescent lawn by
                                                                the linear Ha-ha.
                                                                The area surveyed is marked in
                                                                red.

                                                                            40m    ↑N

1.2 Background information
Information from the records shows that the area is surrounded by places that show a
Roman historic presence. These include to the north, behind the Crescent and in Julian
Road, in Royal Victoria Park to the west, and to the east along Gravel Walk and also a
site close to the Brock Street entrance to the area where Roman cremation urns and
associated finds were found.1,4,5,6 Haverfield drew a “Miscellaneous?” symbol in the area
to the south of this in his map of Roman Bath,6 and Skinner reported the find of a green
glass vase from “the part of Crescent Fields where gardens were created” as well as
“stone coffins in the vicinity”.7 A Roman bracelet was found in a trench to the south, dug
when the Charlotte Street car park (which replaced the gardens) was extended.8 A
quantity of Roman pottery was discovered around the creation of the Royal Victoria Park
                                                                                               1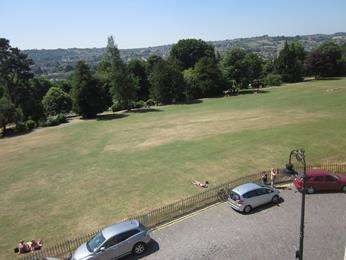
in 1830. The Park included parts of the Crescent Fields and the Bath Commons to the
west. The small remaining collection of this is now at Alnwick Castle.9 Most of it is
described with the general provenance of the Park. Only one of these items was given the
provenance as Crescent Fields, a Roman flask described as “not really found after the
middle of the mid-1st century BC, to 30-20BC at the latest”.10
Indications of this area’s past history are indicated by the parch marks visible in the grass
in dry summers (see Figure 1.2).
Figure 1.2 Parch marks in the lawn observed in dry summers

a                                                     b
2013 Photograph looking down from the top floor      2018 A view looking to the SE across the lawn
of No. 1 Royal Crescent across the eastern part      from the trees in the NW corner
of the lawn, showing the darker green (ditch) line
excavated by Time Team (arrowed)
,

The work of Time Team in 2002 showed the presence of previous developments under
this lawn. They described a gravel Roman road its proposed route followings the Foss
Way alignment route across the area heading for the River Avon. They excavated a
burial by the side of this road in both their trenches. To the east of this road, and
following the parch mark information as shown in Figure 1.2a, they excavated a V-
shaped ditch which contained finds including some dating back to the Late Bronze Age,
and also indicating earlier Mesolithic presence from flint remains. This ditch was
described as having been maybe a field boundary ditch or part of a settlement enclosure.
The Bronze Age occupation was considered to be quite close by due to the “quite large
sherds” of pottery and the butchered animal bone.
In addition to the information shown in the television programme, the clear linear band
of high resistance readings corresponding to the dried out line seen in Figure 1.2b was
noted by them as appearing to be of archaeological interest as well as other indications. It
was stated that the variation they observed in the area could be natural or associated with
landscaping/gardening as well as possibly being of archaeological in origin.
As a member’s project with BACAS in 2012 Janet Pryke with John Oswin, and BACAS
volunteers carried out a geophysics project which extended the Time Team resistance
survey work to cover the whole lawn.3 This investigation was set up to contribute to the
suggestion that was being put together, based on a wide range of indications from a range
                                                                                                     2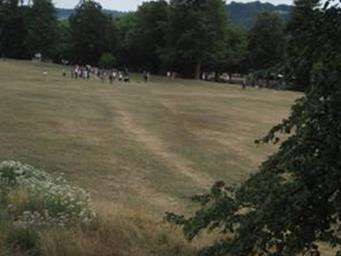
of sources, that this area might possibly be the site of an early Roman presence, possibly
military in nature, in Bath (Pryke unpublished observations). However even with these
added geophysics results, the accumulated indications made a list of tentative
possibilities and did not make a convincing case. These considerations have been added
to over the years and make up the background to this project.
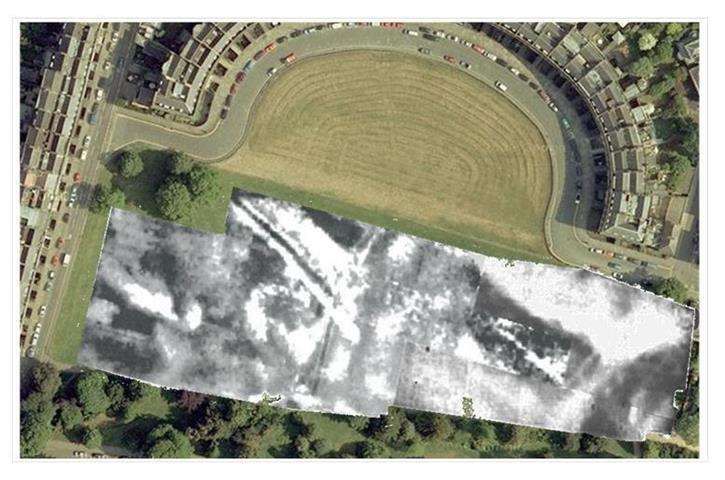
A composite of ground resistance1,3 results from our and Time Team’s work is shown in
Figure 1.3, with acknowledgement to John Gater for his permission for the use of the
(then) Geoscan results in this work. We have compared these with the results from EAS
done for B&NES in 2006 and all three sets of results showed a good similarity of pattern,
with slightly less definition in the latter set, which was done at 1m reading electrode
spacing (we used 0.5m).
Figure 1.3 The composite of the
resistance results from Time Team and
our work. The inset shows areas
commented on in the text.
The yellow lines show the proposed
Roman road route and the asterisks
mark the position of Time Team’s 4
trenches
The yellow lines in Figure 1.3 inset show the route of the Roman road proposed by Time
Team.1 In their work they had not been able to extend their excavation to the bottom of
the gravel layer beyond 0.5m and so did not define the road depth or any foundation
3layer. In this investigation this will be surveyed further in our profiling. In Figure 1.3 a
dark (higher resistance) area running in this approximate direction (blue in the inset) can
be seen possibly crossed by the light (low resistance) area extending from the NW
direction. There is at least one similar looking higher resistance line to the east at a more
vertical angle (also blue) not crossed by this lighter area. This lighter area appears to
widen and continue to the southeast.
Passing NW to SE, there is a very strong high resistance (dark coloured) line shown in
area A, with a light coloured low resistance area to the north and south of it, the northerly
one being considerably wider. Our results from 2012 had indicated there may be
evidence of a possible past deep ditch or watercourse in this position,3 but those results
used only a single 31m profile length and did not reach to the depths of the current
project. These results will be extended in this project.
In Figure 1.3 to the east of these linear features is the area B. In this area a comparison
with our survey results, which extended further to the east than those by Time Team
shows in Figure 1.4 that the ditch excavated by them continues to a right-angled corner
(arrowed). It extends up towards the top of the lawn (as shown in Figure 1.2a).
Figure 1.4 Results from our previous work showing the enclosure continuing the ditch excavated by Time
Team
In Figure 1.3 to the NE of A is a regular-looking high resistance area (C) which was
noted in the Time Team report1 as being of possible archaeological significance, but not
investigated further by them. This is surveyed further here.
Other features were noted by them outside the television programme, and one of those,
the possibly rectangular feature marked purple in Figure 3 inset was profiled by us in our
earlier work. Here the regular shaped area appeared in cross section as a high resistivity
volume, extending about 18x10m to about 2.5m depth from the surface. We also
observed immediately beneath part of it an irregular 3m wide high resistivity volume
4extending down to beyond 3.3m. Other possible areas of possible significance can be
observed in the variations in resistance intensity across the lawn in Figure 1., but only
those considered further in this work are described here.
The resistance measurement results were added to by us in our project in 2012 with a
magnetometry survey over the whole area, the results of which are shown in Figure 1.5.
This is very noisy plot which indicates much use of the area in the past. Two areas are
marked in the inset. The first in purple marks the line of the ditch excavated by Time
Team (B in Figure 1.3). This survey indicates a circular, possibly ditched, area in the
corner of this image, not seen in the resistance survey shown in Figure 1.4. In 2012 we
profiled over this area and possible ditch remains to just over 0.5m depth were observed.
This area is just to the east of the most easterly Time Team excavation area.
Figure 1.5 Magnetometry over the lawn, 3
with areas discussed in the text marked in
the inset
In Figure 1.5 across the bottom middle section is what appears to be a regular
arrangement of more highly magnetic remains (marked in red in the inset), a pattern that
might be indicative of regular metal fixings. At approximately right angles to this is an
elongated mass of higher magnetic anomalies that may be linear, the effect of which
appears to obliterate any possible anomaly line due to the ditch described above.
5This area was used for allotments during WWII, which could have added additional
material contributing to the complexity seen here as well as that of any previous
occupation and use. In photograph during WWII, the orientation of the elongated
allotment plots can be seen to be at right angles to the pathway at the southern edge of
the lawn.11
The resistivity profiles to be carried out in this survey were designed to carry out
investigation to extend this information, to survey across the areas around A and C in
Figure 1.3 and also to include the Roman road route, using extended and deeper
resistivity profiling than we used before.
1.3 Scope
This report is intended as a report designed to disseminate the results after the end of the
survey for information and comment towards possible development of the project.
62 Survey Method
2.1 Gridding
The 0 point was on the Ha-ha at the east edge of the angular buttress before the start of
the western Crescent curve. A base line was run W-E from there along the base of the
Ha-ha. From a point 25m along this line a 15m grid layout was assembled by laying out
using a 15/17/8 right-angled triangle system.
2.2 Resistivity profiling
These measurements were done using a Frobisher TAR3 (kindly donated to BACAS by
the Bathscape organisation). Measurement data were downloaded to a Lenovo laptop
Windows 10 computer (also generously supplied to BACAS by Bathscape) and
converted using RES2DINV. In each case a 31 m line of probes, 1m apart, was set out
along the length and profiles taken using probe separation measurements of 1 to 9m or 1
to 6m.
Concatenated profile lines are shown in several surveyed areas in the Results section.
The individual profiles are all in the Appendix.
2.3 Topographical readings
Topographical information was read from LiDAR information obtained from the
Environment Agency. The data were processed using QGIS 3.14.
2.4 Programme
The survey was planned over one week in September, 20-24th. The weather was fine,
bright and good for this work.
The geophysics work was completed by the team of volunteers from BACAS.
73 Results
3.1 Topography
The lawn is set across a slope extending from 40m at the SW corner to 49m at the NE
corner as shown in Figure 3.1). As the slope is relatively smooth and only the very ends
of the lines were affected by any approach to the Ha-ha and its ditch no topographical
adjustments have been made to our profiling results across their lengths.
In the underlying LiDAR image in Figure 3.1 a slight differential in shading and in the
contouring can be seen running approximately NS across the centre of the lawn.
Figure 3.1 The Royal Crescent lawn
and the lawn below the Ha-ha
showing the heights in m.
LiDAR DTM_ST7065...
3.2 Profile layout
The resistivity profile layout in this project is summarised in Figure 3.2 showing the
layout of the profiles arranged in a 15m grid pattern.
Figure 3.2 The arrangement of the profiles
83.3 Results from resistivity profiles crossing the linear features (A) in Figure 1.3
The high and low resistance linear features marked A in Figure 1.3 were crossed with a
series of resistivity profile lines set up to run about SW to NE, 15m apart. The
concatenated image of the successive profiles 1&2, 3,4&5, 6,7,8&9 and 16,10 are shown
in Figure 3.3a-d arranged in alignment with the position of the observed high resistance
feature (red/purple coloured) towards the middle line indicated by the red arrow.
Figure 3.3 Profiles crossing the linear features (A) shown in Figure 1.3
a Profiles 1&2 SW-NE overlapping at 11m
b Profiles 3,4&5 SW-NE overlapping at 11m
c Profiles 6,7,8&9 SW-NE overlapping at 11m
d Profiles 16&10 SW-NE overlapping at 11m
These four show a band of higher resistivity results about 2m wide close to the surface,
which if continuous, shows decreasing resistance along the length towards the SE. These
volumes are all situated above a wider higher resistivity volume deeper under the ground.
Alongside these high resistivity possibly linear features is a large deep low resistance
(blue) volume to its right with another shallower resistance volume to its left. The large
9deep one extends deeper than 5m. We had observed this deep low resistivity volume in
our 2012 geophysics work, extending beyond the depth those results reached, and had
hoped that the deeper measurement in this project might reach the bottom of the low
resistance feature. As seen in Figure 3.3 this was not achieved even at >5m.
The profiles in Figures 3.3b and c cross towards their NE ends the area of interest
marked as C in Figure 1.2. This correlates with a high resistivity volume extending to
about 1m depth between 40-48m in 3.3b and 45-58m in 3.3c. [Profiles set up at right
angles to these to cross this area and will be shown in Figure 3.5.]
The apparent line of the high resistance apparently linear feature shown and arrowed in
Figure 3.3 was continued with profiles 17, 18 and 19 to the SE set up at 15m intervals,
shown together with profile 16 in Figure 3.4.
Figure 3.4 Profiles 16-19 continuing the line of the high resistance feature to the SW (indicated by red arrow)
Profile 16
Profile 17
Profile 18
Profile 19
10The last profile extends from next to the path across the bottom of the lawn. It was
observed by us that in this part of the grass there is an accumulation of water as it was
very easy to get the probes into the ground here, unlike higher up the slope. Our 2012
results had indicated that the large low resistivity feature did appear to continue to this
part of the lawn, and appears to be shown in the right hand side of these profiles. There is
no continuation into this area of the (arrowed) higher resistivity linear volume near the
surface shown in Figure 3.3. A comparison of the higher resistivity features at 2-4m
depth does show there may appear to be linear continuation of this at depth. If so the one
in profile 19 may indicate displacement, and profile 17 shows its relatively lower
resistivity results. Both profiles 16 and 17 are in the proposed Roman road route shown
in Figure 1.3.
3.4 Results from NW-SE profiles crossing the area
A line of resistivity profiles was set up to run NW to SE starting from the Ha-ha at 27m
from 0 (profiles 11-15). This was designed so the concatenated profiles shown in Figure
3.5a were sure to cross the highly resistant area C in Figure 1.3 and to continue across the
proposed road route (between about 38–58 m).
A second line of profiles (Figure 3.5b) was set up 15m to the SW of these (profiles 21-
23). The proposed Roman road route crosses it at about 20-40m as shown in Figure 3.5b.
This figure has a lower scale as it shows much lower values, presumably due to it
running along the deep low resistivity volume described above. Figure 3.5c shows it
with the same scale as 3.5a where this latter profile indicates that the deep lower
resistance volume from the NW extends beyond the proposed Roman road route.
Figure 3.5 Profiling lines crossing the Roman road line indicated by arrows
a Profiles 11-15 overlapping at 11m NW-SE,
b Profiles 21-23 overlapping at 15m NW-SE, set up 15m to the SW of those in Figure 9a (lower scale)
c Profiles 21-23 overlapping at 15m NW-SE, set up 15m to the SW of those in Figure 9a (same scale)
11With the rescaling comparable differentiation is observable between 3.5a and b. In
profile 3.5a the area noted as one that may appear “structural in origin”1 and shown in
area C in Figure 1.3 correlates with a high resistivity volume between 10 and 33m
(marked blue). This extends at three levels between 0.5 and 2.5m depth and may indicate
some structural remains.
The remains of the Roman road were excavated on two sites by Time Team (Figure 1.3,
areas avoided in this profiling). Their excavation process involved removing topsoil of
0.3m, over 0.1m of clay subsoil, revealing a layer of gravel at least 0.5m thick.1 The
results underneath the road arrows indicate that the higher resistivity indications near the
surface in these profiles do not go much deeper than this, the observations extending
down to just >1m.
The profiles coinciding with the proposed Roman road route were further compared in
Figure 3.6 extending the upper area of the graph for better comparison of the information
close to the surface.
Figure 3.6 Profiles crossing the proposed Roman road route showing surface detail
a Profiles 13/14
b Profiles 22/23
In this direct comparison of the pattern some similarities can be picked out but no
comparison is easy to make and the presence of a defined road line or foundation
structure across the proposed width is not clearly apparent from these results.
Profiles 16 and 17 are in the approximate area of the proposed Roman road (Figure 3.3).
Profile 16, shown in Figure 3.4, shows little indication, but profile 17, 15m to the SE,
could run along the area, and it appears to show similar surface resistivity patterning near
the surface along some of its length as that observed in Figure 3.6.
123.5 Results from profiles crossing the NW edge of the linear deep low resistance
volume extending NW to SE across the area
The large deep low resistivity volume is indicated from these results to cross the lawn
area from the NW area with the trees and corresponds to a lighter area in the composite
resistance image in Figure 1.3. To the north of this is the area excavated by Time Team
showing evidence of settlement remains (B in Figure 1.2 inset) which is in a much darker
higher resistance image area. Profiles were run across the line of this edge to attempt to
investigate its nature and these are shown in Figure 3.7.
This edge is not seen in Figure 3.7a (profile 24) set up to the west of area B. It might be
indicated in Figure 3.7c (arrowed), at its right hand end, but it is clearly shown as a
differentiated volume in Figure 3.7b (arrowed), and with a possible layer giving less high
resistivity results to the left (lighter arrow).
Figure 3.7 Profiles running SE-NW towards Ha-ha aligned as above
a Profile 24 running from line shown in Figure 7b towards the Ha-ha
b Profile 25-26 at 15m to the SE of the profile above
c Profile 20, 15m to the SE of the profile in Figure 9b the edge of the high resistivity area marked with an
arrow
13The results seen in profile 24 in Figure 3.7a may include upper levels including some of
the Roman road remains as it continues profile 17 (Figure 3.4) and there is some
similarity between that and results ion the profiles in Figure 3.6a&b can in the resistivity
results close to the surface.
In the profiles in Figure 3.7 other higher resistivity results can be observed. Profile 24
(Figure 3.7a) shows an elongated high resistivity volume at 3m depth, also possibly seen
at the end of the right angled profile seen in Figure 3.3d. Both the profiles in Figures 3.7b
and c show an irregular high resistance volume at >2m depth. It can be noted that at in an
analysis at high scale the image in profile 20 shows differentiation so it does not appear
to be due to one of the underground void cavities known to be present at the bottom of
the lawn further to the west2,3
144 Discussion
The results can be compared across the area by assembling these resistivity profile results
into a single image as shown in Figure 4.1.
Figure 4.1 The profiles taken during this project assembled over the resistivity map shown in Figure 1.3
The resistance survey and the resistivity profile image indicate that very large resistivity
volume runs from the NW corner of the lawn, and this from these results appears to
extend to the bottom SE part of the lawn. Our results do not go deep enough, at just over
5m, to define its volume. There are a range of possibilities for the origin of such a linear
low resistance area, from its being a palaeochannel, to its being the remains of a water
course or a very large ditch.
It is aligned to the NW pointing towards the spring areas in Middle and High Common,
but our geophysics results from Royal Victoria Park do not indicate similar low
resistance results to continuing across to there.12 The line passes at about 200m to the
NW of this rea to the south of the possible group of standing stones, four large blocks of
rough limestone set deep into the clay, detected in excavations in 1985, under the level
ground towards the top of the allotments behind Marlborough Buildings (shown in
Figure 4.1 to the west of the Royal Crescent).13 This line does not seem to show any
continuation from the main watercourse, Mud/Mad/Muddle Brook, in its course from the
springs up the hill towards now culverted behind Marlborough Buildings in its descent
towards the river. Any course it had to the NW would have crossed the route of the
known large ditch that was open when pictured in the 18th century,14 at right angles to the
15Royal Crescent, a ditch later to be built over with Marlborough Buildings. Continued
down the slope the line of this possible feature points towards the old walled city area.
However it can also be noted that this is the orientation of geological trends in the
bedrock.15
Parallel to this is the linear highly resistant feature observed in our results. If man-made,
the northerly part of this appears to be a built up volume on top of a deeper high
resistivity volume. This latter volume, at least 5m across about and 1.5m deep, continues
to progress at below 2m depth (so not detectable to the resistance meter) towards the SE
edge of the lawn. If these results indicate structural material the upper high resistance
volume could have been a wall or boundary. We note it shows a kink. It is known that in
Roman developments slight kinks in reorientation have been created e.g.16 The built-up
part is at least 60m long (from the parch mark) and the possible continuation is at least
another 45m long. The disappearance of the surface feature occurs at the road position
described by Time Team.
The indications from the previous resistance survey as well as the profiles in this project
indicate that there may have been infilling of this area over time resulting in the burial of
earlier remains. Although area C in Figure 3, the area containing the Bronze Age
remains, was not observed in detail in this survey, where our results crossed into this area
there appeared to be a continuous higher resistivity volume to the surface. There was no
low resistivity observed over it which would be expected if there was slumping of such
ground down the hillside slope across the whole area in extremely wet weather
conditions. This area could have been left exposed if it was already at a higher level
position.
The wide road line described by Time Team was crossed by our profiles, but our results
do not add to extend the description by Time Team.1 No clear foundation can be seen for
this roadway and the cross section of a wide road area is not clearly distinguishable in
Figure 3.6. The arrangements may be the results of additional complexity. It has been
noted that there appear to be a higher resistivity volume at 2m depth beneath part of it as
shown in Figure 3.6b. If this were to be a road cross section there remains the possibility
this could be an earlier version of the Foss Way direction road route across the area.
Other areas show high resistivity volumes in Figure 3, including the regular building-
type shape noted by Time Team (B) that might be possibly structural in origin. The
results in Figures 8b&c and 9a show the extent of high resistivity material apparently
relating to this, extending in depth to less than 2m, results which could be consistent with
a structural development.
A further possibly regular area indicating structural remains is seen in Figures 3.5a, at
about 2.5- 4.5m depth. It is at least 22m wide so could possibly indicate large structural
remains in this position. This overlaps with the wide road line proposed by Time Team,
16so if it was a building the supposition would have to be that it would have been there at a
different time or be a part of the road route structure.
Consideration of our observed resistivity differential showing possible developments at
depth could add to information including the wall of unknown origin consisting of large
stones which was photographed in 186017 next to the railing on the south side of the
pathway running along the bottom of this lawn. In the photograph it is not shown to
depth but does extend downwards into the soil.
We have described indications of possible areas of structural development that have been
observed in these results. If these results are not the result of geological differentiation,
they do appear to indicate areas of layered structural development under the lawn. These
if so appear to have been infilled or covered before further developments were created on
top of them. These areas also appear to be created in a relatively ordered manner either
on an orientation NW/SE (approximate to the Foss Way direction) or N/S, more in line
with the more recent developments.
We look forward to further discussion and consultation towards the possible
development of suggestions to help explain the nature and pattern of these results, and to
hopefully lead towards continuation of the investigation.
17References
1. Time Team (Channel 4) Series 10 Episode 7, https://www.channel4.com/programmes/time-
team/on-demand/33104-007; Davenport, P. 2004 Julian Road and Royal Victoria Park,
Bath. Evaluation Report, Time Team/Bath Archaeological Trust, including GSB
Prospection, Geophysical Survey report 2002/88, Julian Road and Royal Victoria Park,
Bath, 2002
2. Engineering Archaeological Services (EAS) reports 2006, B&NES HER Sites and
Monuments Record, EBN 3523
3. Pryke, J. A. and J. Oswin 2013 The lawn below the Royal Crescent Ha-ha, Bath, a report
on geophysical surveys and Appendix to 2013 Report Geophysics in areas near the Royal
Crescent, Bath (BACAS website)
4. Davenport, P. ed. 2000. Archaeology in Bath Excavations, Julian Road. BAR Series 284 1999
5. MBN 11837 & 11838 Roman creation urns at Royal Victoria Park & Roman burial near
Gravel Walk Bath, M. Lewcun 2001 10-12 Crescent Lane, Bath A desktop archaeological
assessment of the implications of development
6. Haverfield, F. J. 1906. Romano-British Somerset: Part 2, Bath in Victoria County History
7. Skinner, J. 1818-1820 Vol. XXIII. (ff. 308). Journal of tours in Co. Somerset; 1818, 1820.
County of Somerset: p. 220
8. Bath Museums service SMR B271 1982
9. Collingwood, B.J. 1880. A descriptive catalogue of antiquities at Alnwick Castle
10. Roberts, P. (then British Museum) and D. Booms personal communication
11. English Heritage National Monument Record, Swindon, Air photographs
RAF/106G/UK/1522, 329 RVp2 1945
12. Lewcun, M. personal communication
13. Chapman, M. 2003. The Lost Streams of Bath for Survey of Old Bath
14. Watercolour by Thomas Malton 1769 Victoria Art Gallery, BATVG:PD:1918.1820
15. Gallois, R.W. 2006. The geology of the hot springs at Bath Spa, Somerset. Geoscience in
south-west England, 11, 168-173
16. Pitts, L.F. and J.K. St. Joseph 1985 Inchtuthil, the Roman legionary fortress excavations
1952-65 Britannia Mon. Ser. 6, 31
17. Royal Crescent 1860?, photograph, Bath Central Library Collection (Bath in Time ref.
12228)
18APPENDIX
Individual profiles not shown in text, numbered as in Figure 3.2
1
2
3
4
5
6
197
8
9
10
11
12
2013
14
15
21
22
23
2124
25
26
22You can also read