Land Use Land Cover Changes and Encroachment Issues in Kapkatet Wetland, Kenya
←
→
Page content transcription
If your browser does not render page correctly, please read the page content below
Open Journal of Ecology, 2021, 11, 493-506
                                                                                                https://www.scirp.org/journal/oje
                                                                                                           ISSN Online: 2162-1993
                                                                                                             ISSN Print: 2162-1985

Land Use Land Cover Changes and
Encroachment Issues in Kapkatet Wetland,
Kenya

Ronald Kibet1,2* , Charles Olusifayo Olatubara3, Chris O. Ikporukpo4, Alice Jebiwott5
1
  Department of Environmental Management, Pan African University Life and Earth Sciences Institute (PAULESI), Private Bag,
University of Ibadan, Ibadan, Nigeria
2
  Department of Natural Resources and Environmental Science, Kisii University, Kisii, Kenya
3
  Department of Urban and Regional Planning, University of Ibadan, Private Bag, Ibadan, Nigeria
4
  Department of Geography, University of Ibadan, Private Bag, Ibadan, Nigeria
5
  Department of Development Studies, Catholic University of Eastern Africa, Nairobi, Kenya

How to cite this paper: Kibet, R., Olatu-        Abstract
bara, C.O., Ikporukpo, C.O. and Jebiwott,
A. (2021) Land Use Land Cover Changes            Kapkatet Wetland is a vital ecosystem in Kenya that supports rural livelih-
and Encroachment Issues in Kapkatet Wet-         oods through the provision of various ecological goods and services. Howev-
land, Kenya. Open Journal of Ecology, 11,        er, this ecosystem has been undergoing rapid degradation arising from com-
493-506.
                                                 peting land uses. It’s important to document these changes to obtain insights
https://doi.org/10.4236/oje.2021.117032
                                                 that can aid decision-making for effective restoration and conservation. This
Received: January 30, 2021                       study, therefore, sought to assess the extent and patterns of land use and land
Accepted: July 11, 2021                          cover changes in Kapkatet Wetland between 1986 and 2019, and their driving
Published: July 14, 2021
                                                 forces. The study followed a mixed-method research approach involving a
Copyright © 2021 by author(s) and                combination of remote sensing and descriptive surveys. To quantify the wet-
Scientific Research Publishing Inc.              land changes, remotely sensed imageries for 1986, 2000, and 2019 were utilized
This work is licensed under the Creative         in classifying land use and land cover maps through the Maximum Likelihood
Commons Attribution-NonCommercial                algorithm. Household questionnaires and focus group discussions were used to
International License (CC BY-NC 4.0).
http://creativecommons.org/licenses/by-nc/4.0/
                                                 obtain information about peoples’ perceptions of the driving forces of land-
                 Open Access                     scape change within the wetland. Results generally showed that Kapkatet wet-
                                                 land declined by 24.77% over the past years (1986-2019). Wetland vegetation
                                                 declined drastically as open grounds increased while tree cover and disturbed
                                                 reeds showed a fluctuating trend. These changes were majorly driven by land
                                                 conversion activities within the wetland. The study recommends a commu-
                                                 nity-based enforcement approach to existing laws and policies by both Na-
                                                 tional and Local governments to curb the continuous loss of this wetland.

                                                 Keywords
                                                 Wetlands, Land Use/Land Cover, Kapkatet Wetland, Change Detection,

DOI: 10.4236/oje.2021.117032           Jul. 14, 2021               493                                    Open Journal of Ecology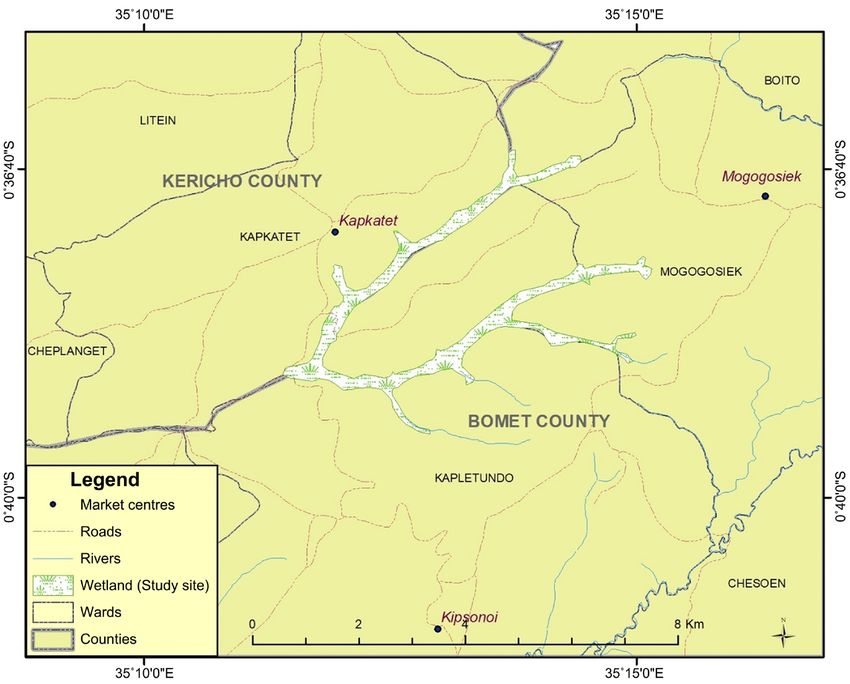
R. Kibet et al.

                                 Remote Sensing

                               1. Introduction
                               Wetland biomes are very sensitive to any form of interference emanating either
                               from anthropogenic activities or natural causes. For a very long time, they have
                               been perceived as biomes of little or no ecological value, wastelands [1]. This
                               ideology has contributed significantly to the continuous loss of more than half of
                               the global wetlands’ acreages even though they provide diverse ecological and
                               hydrological services [2]. Many of the global wetlands have been drained to pave
                               way for the emerging anthropogenic activities like agricultural and infrastruc-
                               tural developments [3]. Between the years 1993-2007, approximately 6% of the
                               global wetland acreages were lost due to encroachment [4]. Urbanization has al-
                               so contributed significantly to encroachment issues like in the case of Jin-
                               ja-Uganda where a study by [5] found out that industries established in Jinja had
                               been discharging raw effluents into a nearby wetland which negatively impacted
                               the health status of the wetland. The short-term benefits accrued from most of
                               the economic activities carried out within wetlands like crop cultivation have
                               never surpassed goods and services accrued from such ecosystems [2].
                                  Landscape spatial patterns, particularly those of wetlands, are often dynamic
                               owing to intra-annual variations in ecosystem variables, whether driven by nat-
                               ural or anthropogenic influences [6]. Change detection of land use and land
                               cover changes provide a fantastic opportunity to learn more about complex and
                               dynamic ecosystems such as wetlands [7]. Availability of precise and reliable
                               land use and land cover change information is critical for environmental plan-
                               ning for sustainable development as it enhances understanding of the anthropo-
                               genic influence on the terrestrial ecosystem [8] [9]. Remote sensing technology
                               has over time been adopted as a tool to detect, identify, measure, assess, and
                               generate information on patterns of land use changes over wetlands in various
                               parts of the world [10] [11]. [12] affirmed that remote sensing approaches can be
                               used to monitor, classify, or manage wetlands. Remote sensing techniques used
                               to classify wetlands include visual inspection and analysis, supervised classifica-
                               tion, unsupervised classification, hybrid classification, and principal component
                               analysis [12].
                                  For many years, remote sensing techniques have been used in wetland re-
                               search around the globe. Synthetic-aperture radar (SAR)-based change detection
                               approach utilizing Sentinel-1 time series was applied in studying landscape
                               changes in two wetlands in Spain and France [7]. The study concluded that it
                               was effective in providing a precise characterization of areas with a lot of fluctu-
                               ation as well as those with slow and steady changes. Using Landsat imageries, a
                               combination of NDVI and NDWI indices were applied in land cover change de-
                               tection of Tanguar Haor wetland, a Ramsar site in Bangladesh, in which it was
                               established that about 40% of land cover under forests and highland vegetation

DOI: 10.4236/oje.2021.117032                        494                                     Open Journal of Ecology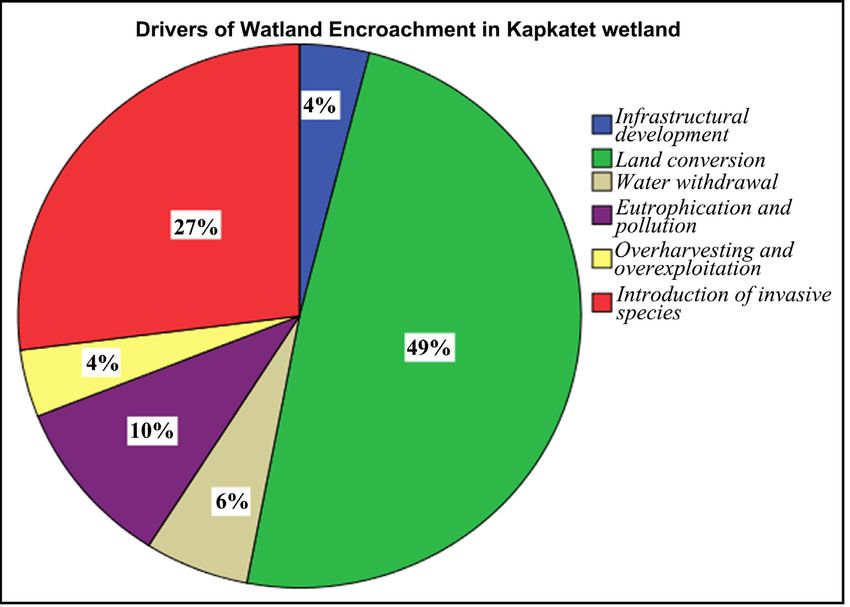
R. Kibet et al.

                               had been converted to residential and agricultural land over 30 years period [8].
                               In Iran, pixel-based change detection was to evaluate land cover changes in the
                               Hamoun Wetland from 1987-2016. Fluctuations water, which is a response to
                               both climatic and anthropogenic factors, was found to be a major determinant of
                               land cover changes [9]. Multispectral ASTER images, classified through artificial
                               neural networks and support vector machine algorithms, were used in perform-
                               ing land use and land cover change detection at Sultan Marshes wetland in Tur-
                               key for the period between 2005 and 2012 [12]. The study observed that between
                               2005 and 2012, marshes and steppe lands shrank, while water and agricultural
                               areas increased. [13] used Landsat imageries in mapping wetland dynamics of Isi-
                               mangaliso Wetland Park in South Africa. According to their findings, alterations
                               in vegetation and water body extents had exacerbated the Isimangaliso Wetland
                               Park’s dramatic decrease in recent years. In Kenya, remote sensing techniques
                               have been used to assess land use and land cover change detection in Rumuruti
                               [14], Nyando Wetland [15], Tana River Basin [16], and Ombeyi Wetland [17]
                               among other large wetlands. These studies cumulatively indicated that the land-
                               scape of Kenya’s wetlands is actively transforming due to human-induced factors.
                                  Kenya’s wetland areas are estimated to cover a landmass of between 3% - 4%
                               which translates to about 14,000 km2 [18]. The National Environment Manage-
                               ment Authority (NEMA-Kenya) reported that Kenya’s wetland areas have de-
                               clined from 4% cover to 2% mainly due to population pressure [19]. The rapidly
                               increasing population in Kenya has led to the competing land uses and
                               over-utilization of these fragile ecosystems through wetland reclamation for
                               construction of infrastructural facilities, commercial forestry establishment and
                               agricultural operations among others [19] [20]. Over the last fifty years, these
                               anthropogenic impacts have hastened ecological change and exacerbated land
                               degradation challenges to the existing wetland resources in Kenya, putting their
                               ability to continue providing essential ecological services under substantial
                               threat [1]. Future protection and sustainable management of these fragile eco-
                               systems require insights that can inform policy and decision-makers [21]. How-
                               ever, information on the scale of ecological changes in wetlands in Kenya is still
                               inconclusive since previous research and management efforts were majorly fo-
                               cused on urban-based wetlands, those along major watercourses and designated
                               Ramsar sites, neglecting the community-based wetlands [1] such as the Kapkatet
                               which mostly support rural livelihoods. To conserve and safeguard Kenyan wet-
                               lands resources, it is necessary to monitor all wetlands and their associated land
                               features. Therefore, this study aimed at assessing the trends of land use and land
                               cover changes in Kapkatet Wetland between 1986 and 2019 and their driving
                               forces. This research is designed to provide insights that can aid decision-making
                               for effective restoration and conservation of this wetland resource.

                               2. Materials and Methods
                               2.1. Study Area
                               Kapkatet wetland is a community-based wetland which is located in the South

DOI: 10.4236/oje.2021.117032                       495                                    Open Journal of Ecology
R. Kibet et al.
Rift region and serves as an important landmark separating Bomet and Kericho
Counties in Kenya (Figure 1). It lies on an altitude of 1,957 meters with geo-
graphic coordinates of Latitudes 0˚38'59"S and Longitude 35˚11'23"E & 35.2˚E
[22]. It also serves as the headwaters of the Kipsonoi River, an important tribu-
tary draining its water to Lake Victoria. The rainfall pattern in the region is
evenly distributed with annual averages ranging between 1000 mm and 1400
mm; and temperatures ranging from 16˚ to 24˚ [23]. According to Census car-
ried out in 2009, Kapkatet wetland is estimated to be supporting a population of
more than 34,684 residents [24] who rely on its goods and services. This wetland
is rich in various macrophytes with predominant vegetation being Cyperus spp.
and Polygonum spp and many other non-woody plants both emergent and
submerged. Surprisingly, most of the natural vegetation at the edges has exten-
sively been replaced with exotic trees, paddocks, and a span of crop fields in
other sections. Reeds have over time been utilized by locals for roofing, making
sheds for crop nurseries, and tea nurseries for Kapkatet factory amongst other
uses. The soil composition is mostly alluvial clays which are fertile and supports
myriads of anthropogenic activities like crop cultivation and are also used for
brick making. Moreover, this ecosystem serves as a historic site where most of
the Kalenjin cultural activities and festivals are undertaken. Besides, several or-
ganisms, both terrestrial and aquatic, inhabit this wetland. A very good example
of birds common in this wetland is the endangered grey crowned crane (Balea-
rica regulorum) who nest and glean on varieties of food substrates available on
the subsurface of this wetland. Predominant land use activity surrounding the
Figure 1. Map showing locations of bomet and kericho counties where Kapkatet wetland
is located (Source: Author).
DOI: 10.4236/oje.2021.117032 496 Open Journal of EcologyR. Kibet et al.
wetland is farming, tea farming (Camellia sinensis) being a major cash crop
though some engage in small-scale horticultural farming. Tea plantations and
exotic trees are common along the periphery of this wetland. High market de-
mand for wood fuel mainly by Litein and Kapkatet Tea Factories and several in-
stitutions and hotels located within Kapkatet Town has triggered plantation of
fast-growing eucalyptus trees on or at a proximity to the wetland. In addition to
this, erratic rainfalls in the recent past have further contributed to the high de-
pendence rate on wetland products by the locals.
2.2. Research Methods
2.2.1. Remote Sensing Analysis
To evaluate the spatiotemporal dynamics of land use land cover changes (LUCCC)
in Kapkatet wetland, imageries for the years 1986 (Landsat 4-5 TM), 2000
(Landsat 7 ETM+), and 2019 (SENTINEL) were obtained from USGS/ESA da-
tabases. All the acquired images were referenced to the Kenyan Coordinate Sys-
tem using UTM projections and WGS 84 datum on Arc GIS 10.2 software. Con-
siderations made while obtaining these images were on seasons over which they
were captured. Only those of dry seasons across the three years were utilized in
this study. This is because during dry seasons, there is minimal cloud cover
hence higher precision, and also various anthropogenic activities are rampant
particularly on the wetland during such periods [25].
Pre-processing and processing activities of Landsat and Sentinel images were
done using Arc GIS 10.2. This involved the process of geometric image correc-
tion for clarity over the identified periods (1986, 2000 & 2019). For digital image
processing, false colour composites were created using bands 2, 3, and 4 for each
of the images. The images were then geo-referenced in the UTM projection
WGS84-reference ellipsoid. GIS data which consisted of Global Positioning Sys-
tem (GPS) ground-truthing data were entered into ArcGis 10.2 software. Super-
vised classification of the satellite imagery was used to produce land use wetland
cover classes. The maximum likelihood classification technique was performed
using the spectral bands 2, 3, and 4 in each of the satellite images. Feature ex-
traction, selection of training data, and selection of suitable classification ap-
proaches were carried out to generate each of the wetland cover classes of the
study area. Accuracy assessment was achieved by comparing samples of pixels
from the classification results and the ground-truthing data collected using a
GPS machine from the field.
Overall accuracy was calculated by dividing the number of pixels for a partic-
ular class with the overall number of reference pixels for that particular class. To
derive the information on the wetland cover and wetland change over these
three periods, four distinct classes (Table 1) were only chosen from the wetland
regions. They were selected based on observable features identified in the pho-
tographs captured during the field survey and ground-truthing exercise. Post
classification comparison method was used for change detection whereby images
of different dates were first classified and labelled individually and the classified
DOI: 10.4236/oje.2021.117032 497 Open Journal of EcologyR. Kibet et al.
Table 1. Wetland cover classes.
Wetland Cover Classes Description
Composed of both hardwood and softwood trees planted within the
Tree Cover
wetland buffer region, along the edges, or on the wetland area
Non-woody plants which are either emergent or submerged and grows
Papyrus reeds
within the wetland
A section on the wetland with scattered patches of wetland vegetation or
Open grounds non-woody trees or/and section converted to cropland, grassland, or
alien vegetation
Disturbed Papyrus
Partially/completely burnt or trimmed wetland vegetation
reeds/wetland vegetation
images were then compared and changed areas extracted. An error matrix me-
thod was used to check for classification accuracy. All the other computations
were done using ArcGIS 10.4 software. Variations in terms of wetland cover
classes were deduced from the findings with varying percentages of classes over
the past three decades. Computation for wetland area change over the periods
(1986-2019) was done using the following method;
Wetland area ∆ ( 2019 − 1986 )
=%∆ × 100
Original Wetland area (1986 )
where; %∆ is Percentage Change.
2.2.2. Descriptive Survey
Household Survey: Both structured and semi-structured questionnaires were
used to obtain information on the drivers of wetland encroachment. The purpo-
sive sampling technique was adopted to identify households located within a ra-
dius of ≤1 km from the wetland and those whose parcels of land extend to this
wetland. Because of time and resources, respondents (n = 100) consisting of an
adult in each of the identified households, willing and capable of providing the
required information, were allowed to fill in the questionnaires with the help of
two trained field assistants. According to the gender disparities, 69 were male
and 31 were female drawn from the two counties. In cases where an adult was
not available or not willing to be interviewed, the next household was chosen.
The data from the household survey were entered and coded using SPSS soft-
ware and thereafter, quantitative data subjected to descriptive statistics to obtain
frequencies and percentages.
Focused Group Discussions (FGDs): This study utilised four FGDs, three in
Bomet County (Chesilyot, Togomin and Cheptangulgei Villages) and one in Ke-
richo County (Rungut village). The number of FGDs was higher in Bomet
County, because a larger portion of the wetland is located in this county. The
villages selected represented the entire region of the study area. A total of 40
residents participated in the four FGDs consisting of youths, local leaders and
outstanding men and women in the community. The researcher liaised with
both the village elder and the assistant chiefs in finding suitable places for hold-
DOI: 10.4236/oje.2021.117032 498 Open Journal of EcologyR. Kibet et al.
ing these discussions. Moderators were chosen to guide the discussions.
3. Results and Discussion
3.1. Classification and Distribution of LULC Changes in Kapkatet
Wetland
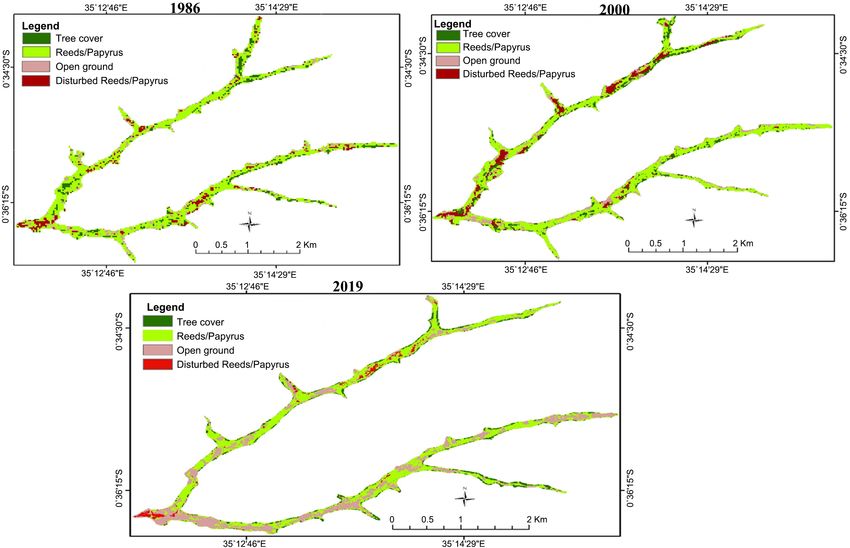
Four classes of LULC were identified in the study area. The classified LULC
maps of 1986, 2000, and 2019 (Figure 2) show that the wetland is characterized
by tree cover, reeds/papyrus, open ground, and disturbed reeds/papyrus. The
areal distribution of these four LULC classes concerning time was determined and
presented in Table 2. The results revealed that with regards to total surface area
coverage, reeds/papyrus was the largest with 2,362,500 m2, followed by tree cover
(431,100 m2), open ground (354,600 m2), and finally disturbed reeds/papyrus
(328,500 m2). The total surface area of the wetland was found to be 3,476,700 m2.
3.2. Spatial-Temporal Trends and Change Detection
The study results (Table 2) indicated that LULC types in the Kapkatet Wetland
have undergone significant transformation over the years.
3.2.1. Reeds/Papyrus
The coverage of reeds/papyrus in 1986 (2,362,500 m2) was higher than the one
for the year 2019 (1,349,400 m2), showing a loss over time. The coverage of this
Figure 2. Masked land use/cover maps for the years 1986, 2000 & 2019.
DOI: 10.4236/oje.2021.117032 499 Open Journal of EcologyR. Kibet et al.
Table 2. Changes of land use/cover area (%) and computations of annual changes for the period 1986-2019.
Area (sq. m) % Change
Wetland Use/Cover
1986 2000 2019
(%) (%) (%) (%) ∆1986-2000 (%) ∆2000-2019
Tree Cover 431,100 12 409,950 13 275,500 11 1% −3%
Reeds/Papyrus 2,362,500 68 1,950,300 63 1,349,400 52 −5% −11%
Open Ground 354,600 10 395,780 13 889,300 34 3% 21%
Disturbed Reeds/Papyrus 328,500 9 339,750 11 101,300 4 2% −7%
TOTAL 3,476,700 100 3,095,780 100 2615,500 100
LULC has been on a decreasing trend for the last three decades, decreasing by
5% between 1986 and 2000 and further by 11% from 2000 to 2019. The popula-
tion of the Kapkatet region just like any other part of the country has been the
major driver which contributed to the change. Demand for more food by this
population has necessitated the expansion of farming lands, thus contributing to
the degradation of wetland vegetations. [26] also reported a similar trend in their
study where there was a loss of papyrus in Dunga (50%), Koguta (47%), and
Kusa (34%) between the years 1964 and 2000. An elderly participant during an
FGD in Chesilyot village reported having been observing a declining trend of
birds scavenging on this wetland over the past three decades. This is an indirect
parameter that could be linked to the decline in reeds/papyrus cover. Planting
non-native vegetations like eucalyptus trees could also be attributed to the de-
cline in papyrus/reeds cover. [27] acknowledged that eucalyptus species planted
on riparian zones have invasive characteristics that alter with the floristic diver-
sity, stand structure and the diversity of wetland vegetations.
3.2.2. Tree Cover
Similar to reeds/papyrus, tree coverage initially recorded in 1986 (431,100 m2)
was determined to be higher than the one recorded for 2019 (275,500 m2), an in-
dication of tree cover loss. From 1986 to 2000, tree cover marginally increased by
1% before eventually decreasing by 3% between 2000 and 2019. The most pre-
dominant exotic vegetations along the periphery of this wetland are the euca-
lyptus trees. Owing to its fast growth and market demand forces, eucalyptus
farming in this area is becoming a lucrative business. The external market de-
mand from mushrooming industries such as the Kenya Tea Development Au-
thority (KTDA) owned factories namely, Kapkatet, Litein, Chelal and Tebesonik;
private tea factories like Korara and Bureti tea factories mainly rely on the locals
for the supply of firewood [28]. This explains why there was a decrease in tree
cover between the years 2000 and 2019. Additionally, in recent years the gov-
ernment through its devolved function of the environment has reinstated and
enforced the 2009 regulations on the use and management of wetlands, river-
banks, lakeshores and seashores [23].
DOI: 10.4236/oje.2021.117032 500 Open Journal of EcologyR. Kibet et al.
3.2.3. Open Ground
The coverage of open grounds however has been increasing over the years. The
coverage in 1986 (354,600 m2) was found to be lower than the coverage for 2019
(889,300 m2), hence an increased open ground. Generally, open ground recorded
a 3% increased coverage between 1986 and 2000 and a further 21% increased
coverage from 2000 and 2019. The expansion of open grounds was noted to be
as a result of crop cultivation and burning of wetland vegetations especially dur-
ing dry seasons as part of the pre-fallowing process engaged by some of the resi-
dents whose lands extend to this wetland. Zones adjacent to the wetland were
also found out to be dominated by exotic trees, tea bushes or horticultural farms,
a similar feature reported by [22] on this wetland. This is an indication that nat-
ural vegetations which initially dominated the watershed areas were destroyed
and replaced by exotic species including crops.
3.2.4. Disturbed Reeds/Papyrus
The extent of coverage of the papyrus and reeds experienced a percentage
change from −5% between the years 1986 and 2000 to a percentage change of
−11% in the periods between 2000 and 2019. This change is attributable to the
increased percentage change of open grounds from 3% (1986-2000) to 21%
(2000-2019) which accounted for the decline in the papyrus and reeds. This in-
dicates that this wetland has over time been encroached hence affecting the spa-
tial extent of the vegetation cover in the wetland. Anthropogenic activities car-
ried out in the area have also greatly contributed to the dwindling of this wet-
land. An elderly man during FGD in Chesilyot Village highlighted that it was a
norm in the community to undertake cultural festivals for example, initiation
ceremonies which were conducted annually around December in specific locali-
ties within this wetland. Also, he further mentioned that initiates used to con-
struct their huts using reeds and twigs sourced from the wetland. There was a
need therefore to preserve this ecosystem which comprehends what was ob-
served through satellite imageries where reeds covered a higher percentage
(68%) as compared with open grounds and the disturbed reeds that covered 10%
and 9% respectively.
3.3. Drivers of Encroachment in Kapkatet Wetland
The probable drivers of wetland encroachment were based on the respondents’
perceptions and ranked by frequencies of listed stressors as shown in Figure 3.
However, the most significant drivers have been discussed as follows;
3.3.1. Land Conversion
Study results indicated that 49% (n = 100) of the respondents perceived land
conversion as an impetus of wetland encroachment in the study area. Field visits
undertaken during dry periods were a true manifestation of how rapidly this
wetland was being converted for economic use. Wetland vegetations especially
papyrus reeds were being burnt by different landowners in favour of the growth
of non-perennial crops, livestock grazing fields, the establishment of woodlots,
DOI: 10.4236/oje.2021.117032 501 Open Journal of EcologyR. Kibet et al.
Figure 3. Anthropogenic activities contributing to wetland encroachment.
fish ponds and harvesting of soils for brick-making. These findings were similar
to what was reported in the Nyando Wetland where such economic activities
eventually contributed to the loss of its biodiversity, altered fish breeding
grounds and bird habitats [29]. Horticultural farming in some sections of the
wetland was also noticeable with the majority of the FGD participants claiming
the availability of water and fertile soils in such areas during dry periods as mo-
tivation for farming. This is in line with the study conducted by [30] who also
found out that the major reasons for wetlands degradation in Tanzania were a
result of population pressure that led to the demand for more agricultural land.
Studies conducted in Tempisque Basin by Daniels & Cumming [31] also showed
that demand for more land contributed to the conversions of the wetland in
areas where they were most accessible and unprotected.
3.3.2. Introduction of Invasive Species Plants
On the drivers of encroachment, 27% (n = 100) of the respondents indicated the
introduction of invasive species as a factor of encroachment. Most of those who
had lived in the area for more than 20 years (76%, n = 100), stated that vegeta-
tion on this wetland indeed had changed over the past decades. Furthermore,
during FGD discussions, one of the participants who happened to be elderly
noted also that papyrus reeds which initially were dense, are now in patches with
grass, exotic trees, and shrubs taking over the entire wetland region. This infor-
mation buttressed the findings from satellite imageries that showed that wetland
size and vegetations have declined in the past three decades. This finding is also
consistent with that of [32] who noted that the introduction of invasive species
was one of the drivers of wetland change. A similar problem was also expe-
rienced in the riparian zones of the Western Cape of South Africa where euca-
lyptus among other invasive species led to the degradation of the wetland [27]
DOI: 10.4236/oje.2021.117032 502 Open Journal of EcologyR. Kibet et al.
[33]. The ability of eucalyptus trees to alter the vegetation structure and wetland
hydrology has also contributed to the reduction of food resources for the avi-
fauna in the area. The allelopathic nature attributed to eucalyptus comes with
new ecological niches which appear to be benefiting alien species over the native
ones. Invasion of wetland grasses was also noticeable in some parts of the wet-
land due to the increased use of NPK fertilisers by tea farmers. This corroborates
with the findings by [22] [34].
3.3.3. Eutrophication and Pollution
Eutrophication especially in Sub-Saharan Africa poses a threat to surface waters
including wetland ecosystems. According to the household respondents, 10% (n
= 100) attributed this factor as among the drivers of wetland encroachment in
the area, citing that indeed some of the residents have established tea plantations
along the periphery of this wetland. The majority of the farmers in the area en-
gage in tea farming [23] which requires a constant supply of fertilizers contain-
ing supplements of nitrogen, phosphorus, and potassium (NPK). Considering
the terrain and drainage pattern in the area, often much of the runoffs from
these farms laden with traces of NPK find their way to the wetland, changing its
vegetation regime [22] found out the pH levels on this wetland were low, a factor
which he attributed to high levels of chemicals especially nitrogen and phos-
phorus emanating from the adjacent tea farms. Dissolved wastes from livestock
droppings while grazing on the wetland vegetations also contributed significant-
ly to eutrophication in this area [22] [35]. The findings are also consistent with
those of [36] who indicated that Las Tablas de Daimiel wetland has been im-
paired by eutrophication, salinisation and pollution as a result of discharging
municipal and agricultural wastes toward the wetland. Siltation due to marram
road was observed in sections close to a footbridge heading to Kapletundo Ward
which had converted a section of the wetland into a field. It was further observed
that solid wastes carried by water runoffs from Kapkatet Town were being depo-
sited on the site which is attributed to the continued decline in wetland species.
Car washing activities were also highlighted by one of the FGD participants at
Chesilyot as a major contributor to water pollution. Laboratory analysis of water
from Daraja Sita, a section on this wetland, showed that it had high conductivity
rates than all the other sampled areas [22].
4. Conclusion
Results show a dwindling trend of wetland cover over the past thirty-three years
(1986-2019). Arrays of anthropogenic activities were found out to have contri-
buted to the wetland loss with the land conversion for agricultural purposes be-
ing the most dominant economic driver of encroachment. Different classes used
to deduce the changing pattern indicated variations with open grounds depicting
an increasing trend within the selected periods. Considering that the wetland is
purely communally owned, private landowners whose lands extend to the wet-
land have resorted to utilizing their parcels in different ways with the majority
DOI: 10.4236/oje.2021.117032 503 Open Journal of EcologyR. Kibet et al.
converting them into paddocks and crop farms for subsistence use. This act has
therefore left the ecosystem vulnerable with minimal interventions from both
the local and national government. Emerging land-use pressures coupled with
weak environmental laws in such areas will continue to put pressure on this
ecosystem with solutions lying on quick intervention from establishing commu-
nity-based resource management committees whose responsibilities will be to
oversee their utilization and advice accordingly on the need for conservation.
County governments, on the other hand, should develop resource inventory that
will ensure up-to-date data of all the resources available which can as well be uti-
lized for informed decision making.
Acknowledgements
This is part of the research dissertation submitted to the Pan African University
Institute of Life and Earth Sciences (PAULESI), University of Ibadan, Nigeria. I
duly acknowledge and thank those who contributed either by improving or re-
viewing this paper.
Conflicts of Interest
The authors declare no conflicts of interest regarding the publication of this pa-
per.
References
[1] Okeyo-Owuor, J.B., Raburu, P.O., Masese, F.O. and Omari, S.N. (2012) Wetlands of
Lake Victoria Basin, Kenya: Distribution, Current Status and Conservation Chal-
lenges. Community-Based Approach to the Management of Nyando Wetland, Lake
Victoria Basin, Kenya, 1.
[2] Millennium Ecosystem Assessment, M.E.A. (2005) Millennium Ecosystem Assess-
ment: Ecosystems and Human Well-Being. Island Press, Washington DC.
[3] Ajibola, M.O., Adeleke, A.M., Ogungbemi, O.A. and Ogungbemi, A.O. (2016) An
Assessment of Wetland Loss in Lagos Metropolis, Nigeria. Developing Country
Studies, 6, 1-7.
[4] Prigent, C., Papa, F., Aires, F., Jimenez, C., Rossow, W.B. and Matthews, E. (2012)
Changes in Land Surface Water Dynamics since the 1990s and Relation to Popula-
tion Pressure. Geophysical Research Letters, 39, L08403.
https://doi.org/10.1029/2012GL051276
[5] Oguttu, H.W., Bugenyi, W.F., Leuenberger, H., Wolf, M. and Bachofen, R. (2008)
Pollution Menacing Lake Victoria: Quantification of Point Sources around Jinja
Town, Uganda. Water SA, 34, 89-98. https://doi.org/10.4314/wsa.v34i1.180865
[6] Coppin, P., Jonckheere, I., Nackaerts, K., Muys, B. and Lambin, E. (2004) Review
Article Digital Change Detection Methods in Ecosystem Monitoring: A Review. In-
ternational Journal of Remote Sensing, 25, 1565-1596.
https://doi.org/10.1080/0143116031000101675
[7] Muro, J., Canty, M., Conradsen, K., Hüttich, C., Menz, G., Nielsen, A.A., Skriver,
H., Strauch, A. and Thonfeld, F. (2016) Identification of Dynamic Cover Types in
Wetlands by Using Multitemporal Cross-Polarized Sentinel-1 Images. ESA Living
Planet Symposium 2016, Prague, 9-13 May 2016, p. 1.
DOI: 10.4236/oje.2021.117032 504 Open Journal of EcologyR. Kibet et al.
[8] Haque, M.I. and Basak, R. (2017) Land Cover Change Detection Using GIS and
Remote Sensing Techniques: A Spatio-Temporal Study on Tanguar Haor, Sunam-
ganj, Bangladesh. The Egyptian Journal of Remote Sensing and Space Science, 20,
251-263. https://doi.org/10.1016/j.ejrs.2016.12.003
[9] Kharazmi, R., Tavili, A., Rahdari, M.R., Chaban, L., Panidi, E. and Rodrigo-Comino, J.
(2018) Monitoring and Assessment of Seasonal Land Cover Changes Using Remote
Sensing: A 30-Year (1987-2016) Case Study of Hamoun Wetland, Iran. Environ-
mental Monitoring and Assessment, 190, 1-23.
https://doi.org/10.1007/s10661-018-6726-z
[10] Suresh, M., Tiwari, A. and Naraiah, R. P. (n.d.) Change Detection and Estimation of
Change Analysis Using Satellite Images.
[11] Papastergiadou, E.S., Retalis, A., Apostolakis, A. and Georgiadis, T. (2008) Envi-
ronmental Monitoring of Spatio-Temporal Changes Using Remote Sensing and GIS
in a Mediterranean Wetland of Northern Greece. Water Resources Management,
22, 579-594. https://doi.org/10.1007/s11269-007-9179-7
[12] Kesikoglu, M.H., Atasever, U.H., Dadaser-Celik, F. and Ozkan, C. (2019) Perfor-
mance of ANN, SVM and MLH Techniques for Land Use/Cover Change Detection
at Sultan Marshes Wetland, Turkey. Water Science and Technology, 80, 466-477.
https://doi.org/10.2166/wst.2019.290
[13] Orimoloye, I.R., Mazinyo, S.P., Kalumba, A.M., Nel, W., Adigun, A.I. and Ololade,
O.O. (2019) Wetland Shift Monitoring Using Remote Sensing and GIS Techniques:
Landscape Dynamics and Its Implications on Isimangaliso Wetland Park, South
Africa. Earth Science Informatics, 12, 553-563.
https://doi.org/10.1007/s12145-019-00400-4
[14] Mwita, E.J. (2013) Land Cover and Land Use Dynamics of Semi-Arid Wetlands: A
Case of Rumuruti (Kenya) and Malinda (Tanzania). Journal of Geophysics and Re-
mote Sensing, S1, 1. https://doi.org/10.4172/2469-4134.S1-001
[15] Okotto-Okotto, J., Raburu, P.O., Obiero, K.O., Obwoyere, G.O., Mironga, J.M.,
Okotto, L.G. and Raburu, E.A. (2018) Spatio-Temporal Impacts of Lake Victoria
Water Level Recession on the Fringing Nyando Wetland, Kenya. Wetlands, 38,
1107-1119. https://doi.org/10.1007/s13157-016-0831-y
[16] Langat, P.K., Kumar, L. and Koech, R. (2019) Monitoring River Channel Dynamics
Using Remote Sensing and GIS Techniques. Geomorphology, 325, 92-102.
https://doi.org/10.1016/j.geomorph.2018.10.007
[17] Nicodemus Osoro, O., Obade, P. and Gathuru, G. (2019) Anthropogenic Impacts
on Land Use and Land Cover Change in Ombeyi Wetland, Kisumu County, Kenya.
International Journal of Regional Development, 6, 57.
https://doi.org/10.5296/ijrd.v6i1.15292
[18] Ministry of Environment and Mineral Resources, MENR (2012) Kenya Wetlands
Atlas. Ministry of Environment and Mineral Resources.
[19] Gok. (2006) EU Kenya Country Environment Profile.
[20] Mulei, J.M., Onkware, A.O. and Otieno, D.F. (2016) Vegetation Community Struc-
ture and Diversity in Swamps Undergoing Anthropogenic Impacts in Uasin Gishu
County, Kenya. African Journal of Ecology and Ecosystems, 3, 175-184.
[21] Kansiime, F., Saunders, M.J. and Loiselle, S.A. (2007) Functioning and Dynamics of
Wetland Vegetation of Lake Victoria: An Overview. Wetlands Ecology and Man-
agement, 15, 443-451. https://doi.org/10.1007/s11273-007-9043-9
[22] Angima, M., Akama, J., Getabu, A. and Omondi, A. (2020) Assessment of Spa-
DOI: 10.4236/oje.2021.117032 505 Open Journal of EcologyR. Kibet et al.
tio-Temporal Variation of Selected Physico-Chemical Properties of Kapkatet Wet-
land, Kericho County, Kenya.
[23] (2018) County Government of Bomet County Integrated Development Plan.
[24] KNBS (2009) 2009 Kenya Population and Housing Census. An Analytical Report on
Housing Conditions, Amenities and Household Assets: Vol. XI (Issue March).
[25] Theau, J. (2011) Change Detection. In: Springer Handbook of Geographic Informa-
tion, Springer, Berlin, 75-94. https://doi.org/10.1007/978-3-540-72680-7_7
[26] Owino, A.O. and Ryan, P.G. (2007) Recent Papyrus Swamp Habitat Loss and Con-
servation Implications in Western Kenya. Wetlands Ecology and Management, 15,
1-12. https://doi.org/10.1007/s11273-006-9001-y
[27] Tererai, F., Gaertner, M., Jacobs, S.M. and Richardson, D.M. (2013) Eucalyptus In-
vasions in Riparian Forests: Effects on Native Vegetation Community Diversity, Stand
Structure and Composition. Forest Ecology and Management, 297, 84-93.
https://doi.org/10.1016/j.foreco.2013.02.016
[28] Oballa, P.O., Konuche, P.K.A., Muchiri, M.N. and Kigomo, B.N. (2010) Facts on
Growing and Use of Eucalyptus in Kenya. Kenya Forestry Research Institute, Nai-
robi, 30 p. https://doi.org/10.1007/s00330-014-3569-z
[29] Masese, F.O., Raburu, P.O. and Kwena, F. (2008) Threats to the Nyando Wetland.
In: Community Based Approach to the Management of Nyando Wetland, Lake Victo-
ria Basin, Kenya, Kenya Disaster Concern & VIRED International & UNDP, Nairo-
bi, 68-80.
[30] Munishi, P.K.T., Rweyemamu, R., Kideghesho, J.R. and Kilungu, H.H. (2012) The
Role of Bahi Swamp Wetlands in Enhancing Household Food Security and Income
of Adjacent Communities. Tanzania Journal of Forestry and Nature Conservation,
81, 115-132.
[31] Daniels, A.E. and Cumming, G.S. (2008) Conversion or Conservation? Under-
standing Wetland Change in Northwest Costa Rica. Ecological Applications, 18, 49-63.
https://doi.org/10.1890/06-1658.1
[32] Galatowitsch, S.M. (2018) Natural and Anthropogenic Drivers of Wetland Change.
In: The Wetland Book II: Distribution, Description, and Conservation, Springer Na-
ture, Berlin, 359-367. https://doi.org/10.1007/978-94-007-4001-3_217
[33] Forsyth, T. (2004) Critical Political Ecology: The Politics of Environmental Science.
Routledge, London. https://doi.org/10.4324/9780203017562
[34] Maurer, D.A. and Zedler, J.B. (2002) Differential Invasion of a Wetland Grass Ex-
plained by Tests of Nutrients and Light Availability on the Establishment and Clon-
al Growth. Oecologia, 131, 279-288. https://doi.org/10.1007/s00442-002-0886-8
[35] Murakaru, J.M. (2010) Seasonal Changes in Physico-Chemical Status and Algal
Biomass of Lake Naivasha, Kenya. Kenyatta University, Nairobi.
[36] Álvarez-Cobelas, M., Sánchez-Carrillo, S., Cirujano, S. and Angeler, D.G. (2010) A
Story of the Wetland Water Quality Deterioration: Salinization, Pollution, Eutro-
phication and Siltation. In: Ecology of Threatened Semi-Arid Wetlands, Springer,
Berlin, 109. https://doi.org/10.1007/978-90-481-9181-9_5
DOI: 10.4236/oje.2021.117032 506 Open Journal of EcologyYou can also read