Journal of Marine Science Research and Oceanography
←
→
Page content transcription
If your browser does not render page correctly, please read the page content below
ISSN: 2642-9020

Research Article                       Journal of Marine Science Research and Oceanography
Evidence for a recent (0.65 Ma) formation of the Isthmus of Panama
Leonidas Brikiatis

Unaffiliated, 17564, Palaeo Faliro, Greece                              *
                                                                         Corresponding Author
                                                                        Leonidas Brikiatis, Unaffiliated, 17564, Palaeo Faliro, Greece

                                                                        Submitted: 02 Feb 2023; Accepted: 20 Feb 2023 Published: 03 Mar 2023

Citation: Brikiatis, L. (2023). Evidence for a recent (0.65 Ma) formation of the Isthmus of Panama. J Mari Scie Res Ocean, 6(2),
25-68.

    Abstract
    The exact age of the final formation of the Isthmus of Panama is a critical reference point for oceanographic, climatic,
    biogeographic, and evolutionary hypotheses. The prevailing interpretation of geotectonic evidence is that the isthmus was completed
    between 12 Ma and 3 Ma, and an age of 3–4 Ma has been used as a benchmark in hundreds of studies over the past 30 years.
    Phylogeographic data indicate the existence of marine connections across the isthmus much more recently, however. Here, using
    the most updated data available, I reconsider the geological arguments invoked to conclude the age of 3–4 Ma and show that,
    in fact, this age is not supported by the current geological knowledge. Rather, recent geotectonic evidence, in conjunction with
    multiple lines of indirect phylogeographic, biostratigraphic, oceanographic, and paleoclimatic indications, suggests that as many
    as four transisthmian seaways persisted until as recently as the onset of the Middle Pleistocene (~0.65 Ma). The concurrence
    of the final formation of the Isthmus of Panama with the mid-Pleistocene Transition of glacial/interglacial periodicity suggests
    a tight relationship between these events. Unusual and contrasting climate phenomena, including the “900-Ka (cold) event”
    and the “greening” of South Greenland during the MIS 22 glacial maximum, can be explained by this palaeogeographical and
    palaeoceonographical scenario.

Keywords: 900-Ka event; Atrato Seaway; Bering Strait closure; Mid-Pleistocene Transition; Nicaraguan Seaway; Panama Isthmus
Formation
Introduction                                                            turning circulation (AMOC), the final formation of the isthmus
The most recent exposure of the Isthmus of Panama is one of the         modulated the modern European and global climates ([12-13] and
most significant events in the recent geological history of the Earth   references therein). Moreover, the operation of the isthmus as a
[1-3], because it resulted in the closure of the Central American       barrier to marine dispersals and a corridor for terrestrial dispersals
Seaway (CAS), which along with its precursor the Hispanic Cor-          affected the diversity and geographic distributions of the biota of
ridor, connected the Pacific and Atlantic Oceans since the Late Ju-     North and South America [1-2, 14]. Therefore, the age and regime
rassic (160 Ma) [4-5] (Figure 1A). Different ages have been pro-        of the final formation of the Isthmus of Panama have important
posed for the event, including the very ancient Miocene (23 Ma [1]      implications to oceanographic and climatic models, biogeograph-
or 14 Ma [6]) and the more recent Late Pliocene (3.5 Ma or 2.8 Ma       ic hypothesis, and the calibration of evolutionary rates [1-3]. For
[7-8]). Some authors have questioned these dates by highlighting        example, in the absence of relevant paleontological records, hun-
the persistence in more recent times of marine paleontological ev-      dreds of molecular dating studies of transisthmian “geminate” spe-
idence indicating shallow-water faunal exchanges from the Early         cies have calibrated their molecular clocks using a ~3–4 Ma age of
Pleistocene (Gelasian) until about 2–1.8 Ma [9-11]. Here, I define      the final formation of the Isthmus of Panama as a benchmark [1-2].
the formation of the isthmus as the complete interruption of any        This age is widely accepted at present and is based on interpre-
interoceanic communication.                                             tation of the available geological evidence, which is summarised
                                                                        in the Late Pliocene (3 Ma) palaeogeographical reconstruction of
Although the various proposed ages probably correspond to dis-          Coates & Obando [8] (Figure 1C) and reproduced in more recent
tinct ephemeral exposures [1], the most recent exposure (which          biogeographical analyses (e.g. [15]).
I will call “final” for simplicity) is the most important, because it
modulated the modern oceanographic, climatic, and biogeographic         Here, I review the geological arguments invoked to support the
configuration of the Earth. By influencing the Gulf Stream inten-       concept of the latest Pliocene (~3 Ma) age of the isthmus forma-
sity and, in turn, the configuration of the Atlantic meridional over-   tion and show that the current geotectonic evidence, in agreement

J Mari Scie Res Ocean, 2023                                                                                              Volume 6 | Issue 2 | 25
with multiple sources of phylogeographic, biostratigraphic, ocean-         the recent formation of the Isthmus of Panama can be related to the
ographic, and paleoclimatic data, suggest that the complete and fi-        occurrence of the great paleoclimatic change known as the (early
nal closure of the Isthmus of Panama occurred much more recently           to) mid-Pleistocene Transition (MPT) [16].
than was previously believed. I then discuss how the scenario of

                                                     North                       Caribbean
                                                    America Early Miocene
                                                                    arcs

                                                                                CAS
                                                                                 200        South
                                                 Pacific                         Km        America
                                                 Ocean
                                                           Late Cretaceous
                                                            to Eocene arcs

                                            A.
                                                                                        landmass
                                                                                          shelf

                                            B.
                                                                                        landmass
                                                                                          shelf

                                            C.

Figure 1: Previous palaeogeographical reconstructions of the Central American Seaway (CAS) and its ruminant straits. A) Early Mio-
cene reconstruction (~20 Ma) [139]; B) Late Miocene reconstruction (~6–7 Ma) [8]; C) Latest Pliocene reconstruction (~3 Ma) [8].
Geotectonic Data                                                           reconstruction [6] (Figure 1B), was considered to be subaerially
The hypothesis that the final formation of the Isthmus of Panama           exposed in their 3 Ma reconstruction (Figure 1C). In the following
occurred ~3 Ma is summarized in the latest Neogene-Quaternary              sections, I review the available geotectonic data in order to de-
palaeogeographical reconstructions of Coates & Coates & Obando             termine whether recent developments in geoscience support this
[8] (Figure 1B & 1C). According to that scenario, interoceanic ma-         palaeogeographical scenario.
rine communication through the isthmus was maintained until the
Pliocene via three persistent seaways (Figure 1C): the Nicaraguan          The Nicaraguan Seaway
Seaway (through the Nicaragua Depression), the Canal Seaway                The Nicaraguan Depression is a prominent, 40–70 km wide tecton-
(through the area of the current Panama Canal), and the Atrato             ic graben extending ~1000 km from the Caribbean side of Costa
Seaway (through the Atrato Basin of Colombia) (see also [17]).             Rica in the southeast to the northern Gulf of Fonseca in El Salva-
. Another seaway, here called the Barú Seaway, although shown              dor (Figure 2 & 3). The depression has been interpreted as having
in Coates & Obando’s Late Miocene (~6 Ma) palaeogeographical               probably developed since the Pliocene [18-19]. The most recent
J Mari Scie Res Ocean, 2023                                                                                            Volume 6 | Issue 2 | 26
structural studies of the El Salvador Fault Zone show that the gra-            Ma ago. This age is congruent with the end of the second, trans
ben structures are the result of a two-phase evolution starting with           tensional phase of the formation of the Nicaraguan Depression
an initial extensional phase that occurred between 7.2–6.1 Ma                  (1.9–0.8 Ma; Early Pleistocene), implying that the associated ex-
(latest Miocene) and 1.9–0.8 Ma (Early Pleistocene) [20]. At the               tensional structures are contemporaneous with, and might have led
northwest side of the Nicaraguan Seaway (sensu Coates & Obando                 to, the deposition of the El Salto Formation, which has a thickness
[8]), the shallow-water El Salto Formation unconformably over-                 of 100 m onshore and up to 1,000 m offshore.
lies older sequences (the Rivas, Brito, Masachapa, and El Fraile
Formations) of various ages from Cretaceous to Pliocene [19].                  The two large freshwater lakes, Lake Nicaragua and Lake Mana-
While the fossil sites in Nicaragua have so far produced only land             gua, contained in the Nicaraguan Depression are also considered
mammals of Late Pleistocene age, a baleen whale was found in the               to have been formatted since the Early Pleistocene [23]. Inves-
Mine K-11 locality within the El Salto Formation [21]. Pyroclas-               tigations of whether and when the lakes were last connected to
tic-alluvial deposits of the Las Sierras Group succeed the marine              the oceans did not reach a clear conclusion [24]. Nevertheless, the
deposits of the El Salto Formation, so the age of the El Salto depo-           occurrence of marine-like nematodes such as Theristus setosus
sition corresponds to the minimum age of the Nicaraguan Seaway                 (Btitschli) Filipjev (an inhabitant of marine and brackish envi-
at its northwest end. Based on molluscan fossil findings, an Early             ronments [25]), Polygastrophora octobulba [an inhabitant of ma-
Pliocene age has long been assigned to the El Salto Formation;                 rine and freshwater environments [26]), and the endemic Viscosia
however, that age is considered to be poorly constrained ([21]                 nicaraguensis [considered to originate from the marine Viscosia
and references therein). Correlation of offshore commercial wells              papillate [27]) in the lakes does not exclude the possibility that the
in the Sandino basin and onshore stratigraphic studies showed                  lakes were once connected directly to the sea ([24] and references
[22] that although the El Salto. Formation includes the complete               therein).
Pliocene, its top (sequence 12, SB12) reaches up to the MPT ~0.9

                                       Nicaragua                                                  Atlantic Ocean
                                   1
                                            2
                                                   3              Caribbean plate
                                       5               4
                                            Costa Rica
                      10⁰ N

                                                                                      8
                                                                  7
                                                             6          Panama                      9
                                                           1 Ma                                              10
                                                                  PTJ                                   11   Colombia

                                                                                                             13
                                                             PFZ

                                                                           Nazca plate                    12
                      5⁰ N
                                Cocos plate
                                                                                                              14
                                                                      Pacific Ocean
                                                                                                             15
                                           85⁰ W                                      80⁰ W

Figure 2: Modern map of the Isthmus of Panama with plate tectonic setting and marked locations of prominent features mentioned in
the text. 1) Nicaraguan Depression; 2) San Carlos Basin; 3) Northern Limón Basin; 4) Southern Limón Basin 5) Tempisque Basin; 6)
Burica Peninsula; 7) Barú volcano; 8) Panama Canal; 9) Chucunaque Basin; 10) Urabá Basin; 11) Salaquí river; 12) Serranía de Baudó;
13) Atrato Basin; 14) San Juan Paleohigh; 15) San Juan Basin. PFZ= Panama Fracture Zone; PTJ= Panama Triple Junction. Modified
from [40].

J Mari Scie Res Ocean, 2023                                                                                                  Volume 6 | Issue 2 | 27
85⁰W                             80⁰W

                                        North                                                         Land
                                       America
                                                                                                     Neritic
                        12⁰N
                                                               Caribbean
                                                                                                    Bathyal

                                                                                               950 Kya
                                                                                                   High stand

                        10⁰N
                                                                         ?

                                                    ?

                                                                                                     South
                                                                                                    America
                         8⁰N

                                                                                          Atrato
                               Pacific Ocean                                             Seaway

Figure 3: Latest Early Pleistocene palaeogeographical reconstruction of the Isthmus of Panama according to the conclusions of the
present study

In any case, Coates & Obando [8] independently showed that the          12.000 km2 onshore area, only three deep wells have been drilled
Pacific seashore reached at least the middle of the Nicaraguan          on land [28] and outcrops are extremely rare [33]. On the other
Seaway (Venado Formation, San Carlos Basin) during the Early            hand, the age of the Suretka Formation is unapproved, as no index
Pleistocene (see also [28]) and maybe had a southward connection        fossil that dates a geological age was ever found [34]. Therefore,
via the Tempisque Basin as well (see map in [15], and [29]). They       the stratigraphical data from the Southern Limón Basin are not
further suggested that thereafter, during the Pliocene, the Nicara-     representative of the palaeogeography of the Northern Limón Ba-
guan Seaway was connected (although somehow restricted by the           sin.
Sarapiquí Arch) to the Caribbean Sea through the Northern Limón
Basin.                                                                  Recent geological research based on well and seismograph-
                                                                        ic analyses showed that continuous marine Pleistocene deposits
The Northern Limón Basin is an undeformed, normal faulted back          can be laterally traced for several tens of kilometres on the north-
arc basin that is separated from the Southern Limón Basin by the        west-to-southeast coastline northwards of the Moín High [31, 35]
Moín High, and from the San Carlos Basin to the west by the             and across the whole coast of the Northern Limón Basin (see [28]:
Sarapiquí Arch [28]. Miocene regional uplifting of the inner arc        fig 10). Therefore, given the potential for extended Pleistocene
formed a series of intermountain basins on the western, inland por-     deposits in the Northern Limón Basin, the most recent age corre-
tion and shallow marine conditions on the eastern, Caribbean side.      sponding to the complete transoceanic exposure of the Nicaraguan
Subsequently, prograded fan deltaic, continental fan deposits, and      Seaway is not defined by the conglomerates of the Suretka Forma-
patch reef development produced bay conditions corresponding to         tion, but instead by the Early Pleistocene deposits of the Venado
the Plio-Pleistocene Suretka Formation [28]. Such a transition is       Formation in the San Carlos Basin. Today, only 34 m of relief sep-
displayed in the classic stratigraphic scheme of the Limón Basin        arates Caribbean and Pacific waters in the area of the San Carlos
[30] where the Middle Miocene–Early Pliocene, deltaic shallow           basin [36], and it is likely that the area has been slightly uplifted
marine Río Banano Formation is unconformably succeeded by               under the tectonic effect of the Cocos Ridge subduction beneath
the shallow marine and continental rocks of the Plio-Pleistocene        Costa Rica during the Early Pleistocene [37].
Suretka Formation (e.g. [31]). According to this very generalised
stratigraphical interpretation, the conglomerates of the Suretka        The Barú Seaway
Formation demonstrate the southwards exposure limit of the Nica-        In the Late Miocene (~6 Ma) palaeogeographical reconstruction of
raguan Seaway toward the Atlantic. This view is reproduced in the       Coates & Obando [8] (Figure 1B), the Atlantic Bocas del Toro Ba-
palaeogeographical reconstruction of Coates & Obando [8] which          sin and the Pacific Burica Basin are connected by a marine trough,
is based on a 2.5 Ma estimation for the age of the upper boundary       which I refer to as the Barú Seaway because of its location where
of the Río Banano Formation [8, Formation [32]. That age cannot         the Barú volcano (3,474m) is today (Figure 2 & 3). Also in the vi-
be assumed for the younger marine depositions in the Northern           cinity of the Barú Seaway is the Panama Fracture Zone, an active
Limón Basin, however, because it is based entirely on cross-sec-        right lateral-moving transform fault that forms part of the tecton-
tion data from the Southern Limón Basin [32] which experienced          ic boundary between the Cocos and Nazca Plates and the larger
a different geodynamic history and deformation than the Northern        southeast-moving triple junction between the Cocos, Nazca, and
Limón Basin and is much more poorly studied [28, 31]. For exam-         Caribbean Plates [37] (Figure 2). As the oceanic crust of the Cocos
ple, although the Northern Limón and San Carlos Basins cover a          Plate moved north eastward, it was partially subducted beneath the

J Mari Scie Res Ocean, 2023                                                                                          Volume 6 | Issue 2 | 28
volcanic arc system of Costa Rica and western Panama, causing Armuelles Formation to include very shallow-water deposits (
punctuated by small (generally

separating the low topographies north and south of the Culebra          biostratigraphic markers, geotectonic data provide additional clues
Cut. Such a high could have constituted a terrestrial barrier to a      regarding the age of the Quibdó Formation.
recent interoceanic marine communication through the low topog-
raphy of the Panama Canal area.                                         The importance of the Quibdó Formation for geologists is not
                                                                        mainly stratigraphical but tectonical, as it is considered to describe
The Atrato Seaway                                                       the emergence of the Serranía de Baudó area, known as the Baudó
The Late Pliocene (~3 Ma) reconstruction of Coates & Obando             Event [67, 70]. The age (usually referred to as “8–4 Ma ?”) and
[8] displays another transoceanic seaway through the Atrato and         the mechanisms responsible for the Baudó Event remain uncer-
Chucunaque Basins (Figure 1C), the Atrato Seaway, which was             tain, because the available data are insufficient to fully explain
originally proposed by Woodring [63]. Recent stratigraphical re-        the kinematics of the Baudó Range emplacement. In any case, the
search showed, however, that the seaway passing through the Chu-        Baudó Event is believed to have led to the formation of the west-
cunaque Basin was subaerially exposed by 5.6 Ma [29] (see also          ern margin and closure of the Atrato Basin [76] (Figure 2). Thus,
[64]) and therefore no longer in existence during the Late Pliocene     while the eastern margin of the Atrato Basin records the shallow-
(Figure 2 & 3) Based on stratigraphic data from a single well in        ing of the basin, large deformations toward the western margin in
the Atrato Basin (Opogado-1), Coates et al. [29] postulated that        the Baudó Range can be seen as a result of orogenic activity. A
the Atrato trough was also subaerially exposed by 4.8 Ma This age       noteworthy example of such a dynamic procedure is printed in the
corresponds to the minimum age of the marine deposits at the top        Río Murrí section, where the Eocene Salaquí Formation outcrops
of the Munguido Formation in the Opogado-1 well (for detailed           in fault contact with the Quibdó Formation [67, 70]. Late Miocene
biostratigraphy see Duque-Caro [65-66]). Coates & Obando [8]            to Pliocene orogeny in the Northern Andes was likely triggered by
and Coates et al. [29] considered the Mongoido Formation to be          the onset of a flat-slab subduction of the Nazca plate underneath
the last marine formation in the Atrato Basin, but that assessment      the northernmost Andes of Colombia [77]. Thus, a Pliocene age
now appears to be incorrect The Mongoido Formation is overlain          of the Quibdó Formation matches well with the latest Neogene
by the Quibdó Formation in wells both north and south of the            tectonic activity in the Northern Andes. It is also evident, however,
Opogado-1 well (see [67]: fig. 21), indicating that the stratigraph-    that orogeny and uplift in the area occurred since the Early Pleis-
ic scheme of the Opogado-1 well is not representative of the wider      tocene (1.8 Ma) until recently [78]. Therefore, the final configu-
Atrato Basin area and therefore cannot be used to infer general         ration of the Serranía de Baudó area and subaerial conditions in
palaeogeographical conclusions about the area.                          the Atrato Seaway could be the results of a more recent procedure
                                                                        that occurred in two steps. In this context, the presence of Quibdó
The Quibdó Formation consists of sandstones and occasional con-         Formation deposits in the Salaquí river area may suggest a past
glomerates including marine faunas, and it is overlain by gravels,      westward marine connection of the Atrato Seaway to the Pacific
sands, and sandstones corresponding to alluvial deposits of the At-     via the northern Baudó mountain range, which was severed during
rato River [68]. On the basis of a Late Pliocene age for the Quibdó     the Early Pleistocene orogeny.
Formation, O’Dea et al. [7] argued that the Atrato Seaway persist-
ed until 3.1 Ma and was overlain thereafter by terrestrial sediments.   Northwards, a likely connection between the Atrato Seaway and
The minimum age of the Quibdó Formation is therefore critical for       the Atlantic Ocean passes through the Urabá Basin, which is sep-
bracketing the age of the exposure of the Atrato Seaway. Although       arated from the Atrato Basin by the Mandé magmatic arc [79].
the age of the Quibdó Formation is uncertain, it has been estimated     Detailed surveys of the region showed that the sediments in the At-
to be Late Pliocene, but also Pliocene to “Quaternary (?)”, with a      rato Basin extend into the Urabá Basin [7, 79]. In the Urabá Basin,
question mark indicating the possibility that the upper boundary        based on the stratigraphic records of the onshore Apartadó-1 and
falls within the Quaternary (e.g. [68-69]. Other recent stratigraph-    Chigorodó-1 wells, as well as the interpretation of seismic lines,
ical schemes display the minimum age of the Quibdó Formation to         four seismostratigraphic sequences can be defined, ranging from
be ~1.8 Ma, albeit also accompanied by a question mark indicating       the Lower Miocene to the Pliocene (?) ([70]: fig. 22; the question
that it might be even younger (e.g. [67]: figure. 20; [70]: figure.     mark indicates that the data are purely biostratigraphic). Even the
17) Stratigraphical schemes in some technical reports show the          lithostratigraphic relations among the drilled units that outcrop on
Quibdó Formation to be Late Pliocene to Middle Pleistocene in           the west and east flanks of the basin are uncertain because of a lack
(e.g. [71-72]). The confusion over the age of the Quibdó Forma-         of detailed stratigraphic studies in these areas [69]. Nevertheless,
tion stems from the purely marine biostratigraphic markers that         the stratigraphic record of the Necoclí-1 well on the right bank of
have been recovered from it so far (see [70]: figure. 18). These are    the Urabá Gulf along with the related seismic line transect (see
the benthic foraminifera Cassidulinella pliocenica and Ammonia          [70]: figure. 27; [80]: figure. 9;) reveal the geometry of the Urabá
cf. beccarii and the planktonic foraminifera Orbulina cf. universa      Basin and allow a precise biochonostratigraphic estimation for
([70]: fig. 17). [70]. While the former is congruent with an age as     the facies of the whole foredeep basin According to this idealised
young as the Late Pliocene [73], the latter two are indicators of       stratigraphic scheme [80], the oldest recorded sedimentary rocks
an age spanning from the Miocene to recent (Paleobiology Data-          in the Urabá Basin are Lower Miocene deep-water facies, which
base 1; Paleobiology Database 2) [74-75]. In the absence of well        grade to Pliocene–Early Pleistocene shallow-water siliciclastic de-

J Mari Scie Res Ocean, 2023                                                                                           Volume 6 | Issue 2 | 31
posits and are overlain by more recent alluvial sediments ([80]:          led to vicariant speciation (see the graphical example in Supple-
figure. 5c). Therefore, an Early Pleistocene exposure of the Atrato       mentary Figure 1).
Seaway from the Urabá Basin to the Pacific via a marine trough in
the northern Baudó mountain range is congruent with the available         Squirrel monkeys (genus Saimiri) currently inhabit each of the ar-
data. Τhis seaway is not related to the findings of Montes et al. [6]     eas of vertebrate endemism in the Amazon (i.e. the Atlantic side
because it was located northwards, not southwards, of the Mandé           of South America), but one species, Saimiri oerstedii, exists only
                                                                          in a small coastal area on the Pacific side of Central America [82].
Batholith (see [6]: figure. 3).
                                                                          The restricted distribution of S. oerstedii is accredited to speciali-
                                                                          sation to a lowland coastal niche, which is thought to have been a
A likely second connection of the Atrato Seaway southwards to             characteristic of the last common ancestor of S. oerstedii and the
the Pacific passes from the adjacent San Juan Basin. There, the           other Saimiri species [84] The divergence between S. oerstedii and
Mayorquín Formation can be correlated with the Quibdó Forma-              Saimiri sciureus, which is found in the northern Amazon, is esti-
tion on the basis of similarity in (e.g. [70]). However, the Atrato       mated to have occurred ~0.95 Ma [84]. Sea birds are another ex-
River Valley to the north and the Pacific Plain to the south were         ample of coastal organisms for which inland areas present a barrier
separated by the uplift of the “San Juan Paleohigh,” resulting in the     [85]. The most recent common ancestor of regional populations of
southernmost extension of the “Istmina Deformation Zone.” This            masked boobies (Sula dactylatra) on either side of the Isthmus of
uplift was the product of dextral tectonics from the collision of the     Panama is estimated to have lived ~0.64 Myr ago [86].
Panama arch with the Colombia Pacific during the Late Neogene,
                                                                          Mangrove coastal vegetation is often considered to harbour the
but the precise age of the event is not well constrained [81].
                                                                          signatures of historical vicariance events [87]. It has been argued
                                                                          that because mangrove or coastal habitats were the last to disappear
Phylogeographic Data                                                      during the final closure of the CAS, the species that inhabited those
Although biogeographical information can be useful in palaeoge-           environments were probably the last to be separated by the closure
ography and has often been invoked in the (e.g. [82]), previous           event [88] (Supplementary Figure 1) Therefore, the divergence
efforts to determine the palaeogeography of the Isthmus of Panama         times of mangrove species should correspond accurately to the fi-
(e.g., [1]) did not manage to separate a clear and detailed biogeo-       nal completion of the isthmus [88]. The Pacific and Atlantic popu-
graphical signal In the rest of this section, I reconsider the existing   lations of the black mangrove (Avicennia germinans) are estimated
phylogeographical data, focusing on the scenario of a very recent         to have evolved independently since ~0.84 Ma [89]. Equivalent
formation of the Isthmus of Panama.                                       divergence dates have been reported for the mangrove-inhabiting
                                                                          fishes of the transisthmian genera Dormitator [90], Anisotremus,
Molecular divergence dates of transisthmian geminate species and          and Mulloidichthys [1] (Table 1).
populations have been widely used to infer conclusions regarding
the formation of the Isthmus of Panama (e.g. [1]). Such divergence
                                                                          With regards to marine biota vicariance, there are several shal-
dates can be considered reliable only if they are calibrated on in-
dependent calibration points rather than on a benchmark date for          low-water fishes, decapoda, arthropods, and bivalves dwelling on
the formation of the isthmus, because the a priori assumption of a        either side of the isthmus whose divergence times have been dated
benchmark date for the formation of the isthmus leads to circular-        close to, or since, 1 Ma using independently calibrated molecular
ity if the goal is to examine the timing of dispersal or vicariance       clocks (Table 1). Most of these species are inhabitants of man-
across the isthmus [1]. On the other hand, the characterisation of        grove environments, suggesting a shallow-water property in the
species or populations as “geminate” is itself subject to limita-         last transisthmian seaways. However, the existence of a deep-wa-
tions and uncertainties, which can influence the phylogeographic          ter species in Category A supports the view that at least one of the
conclusions [83]. A proper selection of geminate species should           seaways maintained a deep sill.
make clear how the invoked speciation is related to the forma-
tion of the isthmus, because different forms of life have different       In addition to the examples in Category A, there are many other
capabilities to overpass specific biogeographical barriers, so their
                                                                          potential geminate species with molecular divergence dates that
biogeographical significance in paleogeographic reconstructions
varies accordingly.                                                       are comparable with a
Table 1: Molecular divergence dates of transisthmian geminate and coastal, species and divergent populations, supporting a very
recent (gration, whereas the presence of related marine biota on both sides spanned both sides of the isthmus [101-102] (Figure 4A). Such a of an isthmus suggests the former presence of a seaway through recent resemblance in the molluscan assemblages on either side of the isthmus [94]. Evidence from terrestrial biota that might have the isthmus cannot easily be explained if the final emergence of the migrated through a subaerial exposure of the Isthmus of Panama isthmus occurred at 3 Ma. Likewise, the occurrence of the atlanti- 1–0.89 Ma ago can be found in the concept of the Great American phile tonnoidean gastropod species Linatella caudata in the early- Biotic nterchange [95] and, more specifically, within the third ter- to-mid Pleistocene Armuelles Formation [103] in Pacific Panama restrial migration event (GABI 3) Specifically, the third dispersal indicate the existence of shallow-water interoceanic exchange event of the Great American Biotic Interchange (GABI 3) between [96] between the Pacific and the Caribbean during the whole Early North and South America took place ~0.9 Ma [95], resulting in Pleistocene [94, 101]. Continued Early or Middle Pleistocene con- the presence of opossum (Didelphis) in North America ~0.9 Ma nections are also demonstrated by (now (0.8–1.0 Ma) [95] and that of the jaguarundi Herpailurus, the cer- Atlantic) in the Armuelles Formation of Pacific Panama [104]. vid Paraceros, the peccary Pecari, and the tayassuid Tayassu in imprecisely dated Bonaerian beds (Middle Pleistocene, ~0.7 Ma) Stratigraphic and Palaeoceanographic Data in South America [95-96]. Importantly, the dispersal of Equus into Oceanographic models support the hypothesis that the open CAS South America, which was previously thought to have occurred permitted relatively fresh and cool Pacific water to flow into the during the GABI 4 event in the Late Pleistocene (~0.125 Ma), was North Atlantic, affecting buoyancy by adding freshwater into the recently reported to have occurred between ~0.99 Ma and
0 Late
Carribean
Middle
Prov.
Columbian-Venezuelan-Trinidad- Subprovince
max. salinity
Pleistocene
0.77
max. NCW hiatus
1
Early
2
Quaternary
Gatunian Province
hiatus
2.59
3
C.
Late
Site U1389
B.
Pliocene
Lithologic
scheme
D.
Weaker Stronger
4
Pacific Site
Early
503A 0 20 40 60 80
Caribbean Site Strength of Northern Component
502A Water (NCW) (% )
Mya
A. 0 10 20 30
Relative abundance of G. ruber (%)
40 50
Figure 4: Paleobiogeographic and oceanographic data supporting a major step in the restriction of the transisthmia5n seaways of the
Isthmus of Panama, 0.89 Ma and ~0.7 Ma. A) Southern Caribbean Neogene biogeographical units [101]. B) Relative abundance of the
high-salinity-tolerant planktic foraminiferal species Globigerinoides ruber, as a proxy of surface-water salinity [9]. C) Estimation of
the variation in Northern Component Water (NCW) overflow [108]. D) Drill core data of IODP Expedition 339 sites, showing major
hiatuses caused by increased saline and warm water transport from the Mediterranean Outflow Water current (MOW) [109-110].
Enhanced Gulf Stream flow is accompanied by increased North accompanied by humidity transport, it has long been argued [113-
Atlantic Deep-Water formation (as part of the AMOC). Periods of 114], and was recently shown by coupled ocean–atmosphere gen-
increased AMOC strength have been linked to increased salinity eral circulation models [115-118], that closure of the CAS would
and warm water transport from the Mediterranean Outflow Water result in enhanced precipitation over Greenland. Strati graphical
current (MOW) [109-110] (but see the Discussion). The increased evidence from ODP Site 646 on the continental rise off south-
MOW strength is marked by depositional hiatuses on the route of ern Greenland (58°12.56N, 48°22.15 W) [118] shows that such
the MOW, indicating erosion by bottom currents due to increased an event took place in the eye of the glacial maximum of Marine
volumes circulating into the North Atlantic. Such hiatuses oc- Isotope Stage 22 (MIS22; Supplementary Figure 2). This event is
curred during three periods, the last of which was from 0.9 Ma to evidenced by increases in pteridophyte and spermatophyte spore
0.7 Ma [109-110] (Figure 4D). and pollen records (Supplementary Figure 2E), respectively, sug-
gesting that south (and probably east) Greenland experienced an
In contrast to the above indications for increased North Atlantic unprecedented local climatic optimum characterised by increased
Deep Water formation, neodymium (Nd) isotope data that have vegetation growth. This exceptional event has not been discussed
been used as a proxy of the ocean thermohaline circulation show previously and is highlighted here for first time. It was even ig-
an exceptional weakening of the thermohaline circulation at the nored by the authors who published the original data documenting
end of the MIS 23 interglacial, at ~900 thousand years ago [111]. it [119]. According to these data, the event lasted ~20,000 years,
In the Discussion, I show how this controversial evidence can be from 0.89 Ma to 0.87 Ma, and can be correlated with an episodic
explained under the concept of the recent formation of the Isthmus increase of ~4.5°C in SSTs across the track of the North Atlantic
of Panama. Current (Supplementary Figure 2). Two positive SST culminations
in the record of ODP Site 980 [120] are particularly well matched
Paleoclimatic data with two contemporaneous positive peaks in the spermatophyte
Climate models developed since the early 1990s have suggested pollen record of MIS22 from South Greenland (Figure 6 and Sup-
that closure of the CAS would strengthen the production of warm, plementary Figure 2H), suggesting that the intensification of the
high-salinity Gulf Stream water, enhancing heat transport to the North Atlantic Current was among the likely reasons for the un-
North Atlantic and the upper NADW formation in the Labrador precedented climatic optimum in South Greenland In the Discus-
and Nordic Seas [13; 112 and references therein]. Moreover, as sion, I provide an alternative oceanographical scenario, implying
the heat transport through the North Atlantic Current (Figure 5) is that all of the previously mentioned palaeoceanographic and pa-
J Mari Scie Res Ocean, 2023 Volume 6 | Issue 2 | 35laeoclimatic phenomena are results of effects of the recent Isthmus Current rather than on the intensity of the warm North Atlantic
of Panama formation on the intensity of the cold East Greenland Current.
Greenland Norwegian
Greenland Ice Atlantic Current
Labrador
Sheet
Sea
?
984
983
Subpolar 982
646
gyre 552
? Laurentide Ice Sheet NADW 1314 980/981
? 1308
MOW
?
607
1313
U1385
U1389
U1391
994C
1058 Subtropical gyre
Panama
Isthmus
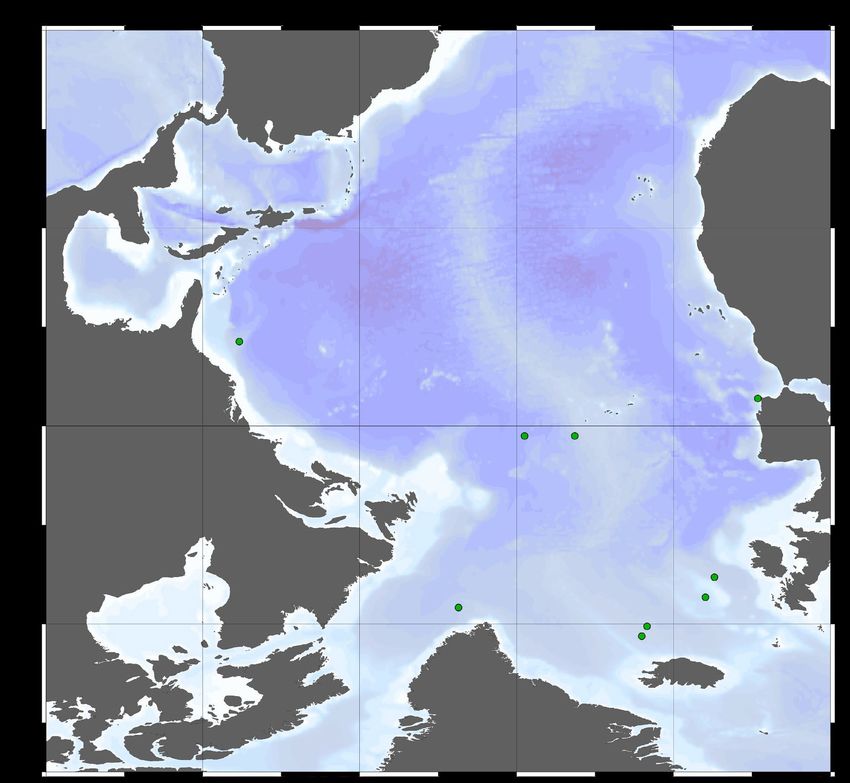
Figure 5: Potential configuration of North Atlantic surface currents during the unprecedented Greenland “greening” at the glacial max-
imum of MIS 22 due to a major episode in the restriction of the transisthmian seaways and the shutdown of the East Greenland Current
at 0.89 Ma. Green circles mark the positions of ODP and IODP sites mentioned in the text and graphs. Hypothesised reconstructions of
ice-sheet extent based on Batchelor et al. [141]. Map designed using Ocean Data View software [142].
J Mari Scie Res Ocean, 2023 Volume 6 | Issue 2 | 36850 860 870 880 890 900 910 920 930 940 950 960 970 Age (Kya)
Middle Pleistocene Early Pleistocene Epoch
ht37 ht38 ht39 ht40 Hyetal period
MIS21 MIS22 MIS23 MIS24 MIS25 MIS26 Marine Stage
Transisthmian seaways restricted B. 0
A.
Mean global sea level
400 900-Kya Event
(W m־²)
(meters)
380 Modern Bering Strait depth (-53m) -50
Likely Bering Strait depth at 1 Mya (-65m)
360
East Greenland Current
1000 Insolation low
C.
re-energized
-100
Grains/cm3
Unfavoured
Forestation waning
forestation Red Sea sea
due to reduced
regime in SE level
insolation
Greenland due to
low insolation
500
Intervals of
Temporary
East Greenland
forestation waxing
Current
due to increased
shutdown
insolation
East Greenland Current
0
Global composite benthic δ18O
re-energized
Heat transport
3.5 through the
Mediterranean
Winter MAT-SST (⁰C)
Outflow Water 10
(MOW)
‰ VBDB
4.0 ODP Site 980
LR04 North Atlantic 6
2
D.
4.5
E.
open closed open closed open Bering Strait Mode
10 9 8 7 6 5 4 3 2 1 Model Stages
Figure 6: A closer look at the paleoenvironmental parameters that are probably related to the climate perturbation of the 900-Ka event
across the MPT. A) Insolation oscillations at 65°N high latitude [143]. B) Mean global sea level fluctuation [144]. C) Pollen content
of spermatophytes as an independent proxy of vegetation and forested episodes in South Greenland [119]. D) Stack of 57 globally dis-
tributed benthic δ18O records (palaeotemperature proxy) [145]. E) Sea surface temperatures (SSTs) from ODP Site 980 [120]. Hyetal
spectrum according to Brikiatis [126].
Discussion the last one million years [40]. The Panama Triple Junction was
It has long been believed that the final formation of the Isthmus of located more north-westerly (in the vicinity of the Osa Peninsula)
Panama took place at ~3-3.5 Ma [7, 8, 121]. This view has been 2–3 Myr ago [40] than it is today (Figure 2), so that the onset of
taken with such certainty that hundreds, or perhaps thousands, of the Cocos Ridge collision (exposure of an Early Pleistocene shallow transoceanic seaway In addition to shallow-water species, the presence of a deep-sea
through the Panama Canal Basin is also questionable because bivalve (Abyssogena in Table 1) could suggest that at least one
of the complete absence of sediments that testify to its presence. exposed seaway maintained a deep sill until ~1.1 Ma. Because of
Therefore, although the current stratigraphical evidence supports the current biogeographical distribution of these geminate species
the exposures of only two of the four hypothesised seaways (i.e. in the Central Atlantic and the Central-East Pacific (close to and
the Nicaraguan and the Atrato), the existence of the other two sea- on either side of the Isthmus of Panama), an alternative dispersal
ways (i.e. the Barú and the Panama) is suggested by the absence of through high-latitude sea corridors is not the most parsimonious
stratigraphical evidence against their exposure and the relatively scenario.
young (Pleistocene) age of the topographical barriers developed
within them. Aside from the Category A geminate species, Supplementary Ta-
bles 1 and 2 contain bird and plant species (Category B) with mo-
The palaeogeographical scenario regarding the very recent forma- lecular divergence dates that suggest allopatric speciation due to
tion of the Isthmus of Panama is also in agreement with multiple the same vicariant event. Moreover, specific phylogeographic data
lines of indirect phylogeographic, biostratigraphic, oceanographic, point to the existence of biogeographical barriers to terrestrial dis-
and paleoclimatic data. For example, the relationship between the persals within the Isthmus of Panama that conclusively correspond
elevation of the Isthmus of Panama and oceanographic conditions to the proposed exposures of the four distinct seaways (see Supple-
in the Tropical Eastern Pacific suggests that although today the mentary Table 3 and Figure 3): the Nicaraguan Seaway, the Barú
isthmus is one of the most mountainous regions in Central Ameri- Seaway, the Canal Seaway, and the Atrato Seaway. In accordance
ca (with peaks rising over 3000 m), the modern topography of the with the phylogeographical and geotectonic data, marine and ter-
region is largely a consequence of rapid uplift during the last few restrial biostratigraphic data suggest that the final formation of the
hundred thousand years (since the mid-to-late Pleistocene) [48]. Isthmus of Panama was more recent than previously thought.
The available phylogeographic data presented here show the ex- When the various phylogeographic, biostratigraphic, oceano-
istence of a number of transisthmian geminate marine and coastal graphic, and paleoclimatic data are evaluated separately, experts
species (Category A species; see Table 1) with too recent molec- from each discipline may doubt whether the data provide strong
ular divergence dates (from 1 to 0.65 Ma) that are not consistent enough evidence to support the scenario of a very recent isthmus
with even the youngest estimations for the age of the isthmus (1.8 formation, as alternative explanations are also possible. In this re-
Ma [9-11]). Instead, the data suggest that the isthmus was not fi-
spect, researchers may be in a hurry to reject the proposed scenar-
nally and completely formed until 1–0.6 Ma. Most of the relevant
io and remain true to the current and widespread view of a latest
species are marine species for which, if a long-distance dispersal
Pliocene (~3 Ma) final exposure of the isthmus. That view was
and/or a “sweepstake” dispersal is excluded, there is no way of
established on geological evidence that can be challenged with
dispersal to either side of the isthmus other than an exposed trans-
more recent lines of evidence, however, and should therefore be
isthmian seaway. The above two biogeographical concepts are
carefully reconsidered. Indeed, if the data from the various sources
used frequently to support phylogeographical conclusions, adding
“noise” to the biogeographical signal; however, they might be the presented in this review are considered independently, they cannot
result of poorly understood palaeogeographic evolution and/or in- independently support the proposed scenario for the recent final
accurate dates for clade divergences due to incorrectly calibrated exposure of the isthmus. However, if all the data are considered
molecular clocks [94]. This is probably also the case in the bioge- together as the result of a single event, they show a pattern that
ography of the Isthmus of Panama, where molecular divergence supports a novel palaeogeographical scenario, which in turn sheds
dates earlier than the “benchmark” date of 3 Ma have been easi- light on some currently unexplained phenomena that took place
ly attributed to “sweepstake” dispersals. A classic example is the during the great paleoclimatic change known as the MPT [16]. I
case of the marine snails of the genus Cerithideopsis, which have discuss this prospect in the following section within the context
been proposed to have dispersed from the Pacific to the Atlantic of two different palaeoceonographical scenarios, both of which
750,000 years ago, but also in the opposite direction about 72,000 are based on the effects of the recent formation of the Isthmus of
years ago [122]. Accordingly, the first Cerithideopsis dispersal is Panama on the thermohaline circulation and the production of the
congruent with the scenario of the recent isthmus formation pro- NADW. The first scenario favours a northwards heat advection
posed here, but the latter dispersal is compatible with a “sweep- through a strong subtropical gyre and a North Atlantic Current
stake” dispersal. The original authors of the survey concluded that able to penetrate the subpolar gyre, whereas the second scenario
both were cases of “sweepstake” dispersals because they believed favours a northwards heat advection through a strong Mediterra-
that the final formation of the Isthmus of Panama occurred at 3 nean Outflow Water (MOW). The effect of the latter was probably
Ma. However, because that study, as well as many others, used the dominated by the intensity of the cold East Greenland Current,
“benchmark” date of 3 Ma as a calibration point (in the absence of which in turn is driven by the Bering Strait gateway modulated by
fossils), its chronological results are not suitable for making con- the open/close modes of the CAS.
clusions related to the final formation of the Isthmus of Panama (or
to dispersal scenarios), because they are biased.
J Mari Scie Res Ocean, 2023 Volume 6 | Issue 2 | 38Northwards heat advection through the North Atlantic Current 100-Kyr cycles as well as a significant change in glacial behaviour
Various oceanographic models predict that termination of inter- in general (e.g. [124-125]). However, because the time window
oceanic seawater exchange through the Panama seaways should for a possible closure of the Bering Strait was short, such a closure
result in perturbation of oceanic circulation and physical proper- cannot explain the long-term procedure of the MPT, which ranged
ties(e.g. [105]). Such physical and sedimentological changes have from 1.2 Ma to 0.6 Ma [16]. A longer procedure, such as the re-
been identified ~0.89 Ma and ~0.7 Ma, suggesting major restric- striction of transisthmian seaways due to tectonic uplift driven by
tions of the transisthmian seaways around these ages (see Figure Cocos Plate subduction, seems to fit better with the available data.
4). Furthermore, contemporaneous changes in heat transport to the
North Atlantic via the Gulf Stream (Figure 5) can be shown using Recent modelling experiments showed that the open/close modes
variation in the sea surface temperatures (SSTs) as a proxy. Indeed, of a ~2,000-m deep and ~100-km wide transisthmian seaway
North Atlantic SSTs during glacial stages were unusually high, in could have profound effects on the global ocean mean state and
contrast to the contemporaneous low global mean temperatures of deep-water mass properties and circulation [105]. In particular, the
deep waters, suggesting a remarkable intensification of the Gulf models showed North Atlantic Deep Water (NADW) penetration
Stream that is congruent with the restriction of the transisthmian into the Pacific below a depth of 1,469 m, with 12.8% of total
seaways (Supplementary Figure 2). The episodic climatic opti- net mass transport occurring below that depth [105]. Thus, the
mum suggested by the culminations of pollen and spore records deep sill property of a transisthmian seaway has implications for
from South Greenland during the glacial maximum of marine iso- global changes in deep-water circulation and could be a driver of
tope stage 22 (MIS 22) [119] (Supplementary Figure 2) further long-term changes in climate [105]. Furthermore, in contrast to
supports the hypothesis that there was a major restriction of the present-day and previous CAS simulations, the recent experiments
transisthmian seaway ~0.89 Ma The culminations required a heat showed that the open/close modes of a transisthmian seaway with
source capable of driving an increase in precipitation and plant the afore said dimensions would be able to essentially influence
growth. Deep-sea cores from around the course of the North Atlan- the transportation of heat and salt southward into the South Atlan-
tic Current, the ocean surface current that conveys the warm Gulf tic, strongly influencing the palaeoceanography of the Southern
Stream northwards, display episodic increases of ~4.5°C in SSTs Hemisphere.
during the MIS 22 interval, whereas cores within the subpolar gyre
do not (Supplementary Figure 2). Accordingly, the exceptional geochemical changes observed in
the Southern hemisphere (Figure 7G and 7H) during the MIS24
Indeed, at the time of its formation, the Isthmus of Panama main- (~920 Ka) could be attributed to the shoaling of the Barú Seaway.
tained a lowland profile and was therefore sensitive to relative sea Indeed, the geotectonic data presented here indicate that the only
level changes. The global mean sea level reached its lowest level likely transisthmian seaway (among the four proposed here) with
of the entire Cenozoic interval at 0.89 Ma [123]. There was also an such a deep sill property was the Barú Seaway (Figure 3). At the
exceptional climate deterioration around that time, known as the south end of that seaway, fine-grained turbidite deposits of the up-
“900-Ka event,” which can be added to the evidence supporting a per Burica Member contain faunas indicating a gradual shoaling
recent final formation of the Isthmus of Panama. The cause of the from an initial depth of 2,000 m to a final depth of 1,400 m in Late
900-Ka event is a great mystery [16, 124-125]; however it was Pliocene through Early Pleistocene times, and strata assigned to
recently demonstrated that the event was not orbitally forced but the lowermost Armuelles Formation (late Early Pleistocene time)
was instead due to a currently undefined feedback perturbation of contain faunas indicative of water depths between 1,200 m and
the Earth’s internal climate system [126] (Figure 7). There are 1,300 m [44]. By contrast, the shallow-water molluscs in strati-
examples of major and permanent changes in phenomenally unre- graphically higher exposures of the Armuelles Formation are in-
lated terrestrial and marine records around that time, such as the dicative of shelf deposits, indicating that within the deposition in-
permanent reduction in the loess grain-size rate (>63 μm particle terval of the Armuelles Formation, rapid shoaling took place at the
content) in the Otindag sandy desert in northeast China (Figure end of the Early Pleistocene On the basis of these data, Corrigan et
7C) and the change in the sedimentation rate of the Bering Sea al. [44] concluded that rapid uplift due to Cocos Plate subduction
area [128] (MIS24; Figure 7B). These changes are contempora- took place after the Early Pleistocene More recently, uplift rates of
neous with geochemical changes in the oceans (Figure 7), which 1–8 m Ka−1 were estimated for the Burica Peninsula over the Late
could only be explained by a major reorganisation of surface and Pleistocene [129]. With a mean uplift rate of 4 m Ka−1, it would
bottom currents Such a perturbation of the ocean currents could in take only 0.6 Ma for a 2400 m deep Barú Seaway to become sub-
turn only be achieved through a major palaeogeographical change. aerially exposed, meaning that such an exposure could have oc-
curred during the MPT phenomenon, which occurred from 1.2 Ma
Indeed, the closure of the Bering Strait due to the major sea level to 0.6 Ma [16]. Furthermore, with a combined uplift and volcanic
fall at 0.89 Ma was previously suggested [128] as a main reason accretion rate of 6 m Ka−1, the Barú volcano (3,474 m) could have
for the 900-Ka event and, more generally, the MPT, the age sug- emerged during the last 0.6 Myr. Accordingly, the Cocos Plate sub-
gested by paleoenvironmental data as the threshold for the transi- duction could correspond to a major step in the shallowing of the
tion of glacial/interglacial periodicity from 41-Kyr cycles to quasi- formally deep-water Barú Seaway, with important implications for
J Mari Scie Res Ocean, 2023 Volume 6 | Issue 2 | 39interoceanic deep-water interchange. This hypothesis is supported Ma) [45], which may represent facies of an upper-bathyal envi-
by the Atlantic/Pacific divergence of the deep-sea bivalve species ronment in the area at the north of the Barú Seaway Alternative-
Abyssogena from ~0.95 Ma (Table 1). Interestingly, apart from the ly, Cronin & Dowsett [11] suggested that the Bradleya may have
biostratigraphical data from the Armuelles Formation at the south reached shallow waters because of upwelling currents created by
end (Burica Peninsula) of the assumed Barú Seaway, Cronin & the closure of the CAS [11]. Given the age of the Cangrejos Creek
Dowsett [11] noted the presence of the deep-water planktonic for- section (1.5-0.9 Ma), this claim can also be used to support the
aminifer Bradleya among shallow-water taxa collected from the recent formation of the Isthmus of Panama.
Cangrejos Creek section, Moín Formation, Limon Basin (1.5-0.9
0 100 200 300 400 500 600 700 800 900 1000 1100 1200 Age (Kya)
Quaternary Period
Late Pleist. Middle Pleistocene Early Pleistocene Epoch
Hol
.
ht1 ht3 ht5 ht7 ht9 ht11 ht13 ht15 ht17 ht19 ht21 ht23 ht25 ht27 ht29 ht31 ht33 ht35 ht37 ht39 ht41 ht43 ht45 ht47 ht49 Hyetal
3 ht2 ht4 ht6 ht8 ht10 ht12 ht14 ht16 ht18 ht20 ht22 ht24 ht26 ht28 ht30 ht32 ht34 ht36 ht38 ht40 ht42 ht44 ht46 ht48 ht50 periods
MS31
MS25
MS1 MS5 MS9 MS11 MS21
MS13
MS7 MS15 MS17 MS19
MS29 MS35 warm
LR04
δ¹⁸O MS27 MS33
‰ VBDB
A.
deglaciation
MS23
4
MS3
MS28
MS4
MS8 MS14 MS24
cold
MS10 MS12
B.
MS18 MS20 MS22
5 MS2 MS6 MS16 Bering Sea
sedimentation fall lowest rate 40
before
(cm־² Ka־¹)
Bering Strait closing
lowest rate 20
C.
after
0
>63 μm (%) grain size
20
aridification
-13
40
Shoaling of the Barú Seaway
60
900-Kyr event
85
% NAW ODP 1267
D. -11
ODP 1267
ODP 1267
% NAW
80 80
75
εNd
70 70 ODP 1090
ODP 1088
ODP 1090
ODP 1088
65 -9
60 60
ODP 1090 E. -0.1
0
50 50 ODP 1088
55
‰ VBDB
0.1
0.2
40 40 δ¹³Ccarb 0.3
-7
100 F. 0.4
+ 80
% CaCO3
60 Site 607
-
G. -2 Stacked normalized
40
917 Kya
Magsus (z-score)
-1
20 0
1
2
100 H. SUSAS
3
Hyper-hyetal period
80
Hypo-hyetal period
Hemi-hyetal period
+
% CaCO3
Arid period
60
- 40 ODP 1090
20
I. -0.04
-0.02
Precession
0.00
0.02
0.04
hyper-hyetal period hemi-hyetal period hypo-hyetal period arid period
Figure 7: Strict sedimentological and geochemical changes across the MPT. A) Stack of 57 globally distributed benthic δ18O records
(palaeotemperature proxy) [145]. B) Sedimentation rate at the Bering Sea shelf (North Pacific) [128]. C) Loess grain-size rate (>63 μm
particle content) in the Otindag sandy desert, north eastern China [127]. D) Comparison of planktic foraminiferal Fe-Mn oxide coating
εNd from South Atlantic sites 1267, 1088, and 1090 and percent calculated North Atlantic Water (modified from Supplementary Figure
1 of Farmer et al. [146]). E) Stacked and smoothed carbonate carbon isotope (δ¹³Ccarb) from benthic foraminifera of the global ocean
[147]. F) DSDP Site 607 %CaCO3 [148]. G) SUSAS South Atlantic magnetic susceptibility stack [149]. H) South Atlantic DSDP Site
1090 %CaCO3 [150]. I) Precessional oscillations of the Earth’s rotational axis [143]. Hyetal spectrum according to Brikiatis [126]. The
grey arrows note that precession minima correspond to hypo-hyetal and/or arid periods only during periods of eccentricity minima [126].
The only exception to that rule occurs at ~880 kyr (marked by a yellow arrow and a yellow vertical bar) and coincides with the 900-Ka
event [126].
J Mari Scie Res Ocean, 2023 Volume 6 | Issue 2 | 40Figure 6 shows a detailed view of the interval preceding the 900- Northwards heat advection and Mediterranean Outflow Wa-
Ky event. A glacioeustatic sea level drop that started at ~950 Ka ter (MOW)
(stage 1) culminated at ~917 Ka (stage 2). This interval probably On the basis of new evidence attributing a more important role
signals the final shoaling of the Barú Seaway and the establish- to the MOW in the northwards heat advection in the North At-
ment of a shallow setting in all four remaining transisthmian sea- lantic [133-134], all of the previously mentioned phenomena can
ways (Figure 3). The culmination at 917 Ka signals the onset of the be better explained with a slightly different oceanographical sce-
failed MIS23 deglacial, which is characterised by increased dura- nario Specifically, given the property of the Bering Strait to oper-
tion of relatively high insolation and increased SSTs in the North ate as a valve regulating the salinity of the North Atlantic waters
Atlantic (stage 3). During stage 4, reduced insolation contributed through the transport of relatively fresh North Pacific water into
to the extremely cold MIS22 glacial, which led to a new low re- the North Atlantic Ocean (through the East Greenland Current),
cord in eustatic sea level. This low stand probably resulted in sub- the open/close modes of the strait are able to mute the meridional
aerial exposure of the Bering Strait and temporary interruption of overturning circulation, leading either to cooling and ice-sheet ad-
the East Greenland Current, which was previously forced by water vance in the Northern Hemisphere (at full open mode) [135] or to
flowing through the Bering Strait [130, 131]. The interruption of saltier North Atlantic surface waters and enhanced AMOC [136]
the East Greenland Current reduced the supply of fresh and cold and Global Ocean Circulation (at closed mode) [137]. The power
Arctic water into East and South Greenland (stage 5), which, com- of this Bering Strait property depends in turn on the open/close
bined with an interval of increased insolation and increased heat modes of the CAS: it is stronger during a closed CAS and weak-
transport from the North Atlantic Current due to restriction of the er during an open CAS [132, 138]. Specifically, an open CAS
transisthmian seaways, resulted in climate optimisation in South with the dimensions considered here (~2,000 m deep and ~100 km
Greenland. The restriction of the transisthmian seaways was in- wide), or even with lesser dimensions, could decrease mass trans-
tensified by the extreme glacioeustatic sea level fall at 0.89 Ma. A port into the Arctic Ocean via the Bering Strait, thereby reducing
glacioeustatic sea level rise (stage 6) then resulted in a temporary southward mass transport into the North Atlantic from the Arc-
opening of the Bering Strait, intensification of the East Greenland tic by ~36–55% [105]. Moreover, the closure of the CAS and the
Current, cooling of East and South Greenland, and, finally, tem- opening of the Bering Strait were found to induce strong effects
porary interruption of the climatic optimum in South Greenland. on the AMOC that may partly cancel each other out, as they both
A subsequent sea level fall (stage 7) brought back the favourable cause AMOC changes of around 2 Sv (strengthening and weaken-
conditions for another climatic optimum in South Greenland, ing, respectively) [138].
which lasted until the end of the high insolation period.
From this view, during the complete closing of the CAS at the
The above scenario is contradicted by two lines of evidence. The time of the recent formation of the Isthmus of Panama, the flow
first is that Nd isotope data used as a proxy of the ocean thermo- of cold and relatively fresh Pacific water into the North Atlantic
haline circulation show an exceptional weakening at the end of Ocean through an open Bering Strait and the East Greenland Cur-
the MIS 23 interglacial, ~900 thousand years ago [111]. This is rent should have been remarkably intensified, resulting in a reduc-
contrary to the assumption of an enhanced NADW due to a strong tion of the NADW and AMOC during the “900-Ka event” (Figure
North Atlantic Current. The second contradictory line of evidence 6 and Figure 7). On the other hand, the closed CAS should have
is that during the MIS22, although the subtropical gyre was inten- had the same reduction effect on the NADW and AMOC during
sified [107], its warm waters were not able to penetrate the subpo- all subsequent glacial periods. This is exactly what is suggested by
lar gyre and reach the subpolar Deep Sea Drilling Project Site 552 the palaeooceanographical results based on Nd isotope data [111].
[107]. This can be explained by recent modelling and drifter stud-
ies of North Atlantic inter-gyre exchange indicating that communi- The continuing sea level fall probably had closed the Bering Strait
cation between the gyres at the surface is limited by the southward at 0.9 Ma (Figure 6). Indeed, as seesaw-like climate change be-
Ekman velocities and a strong surface potential vorticity gradient tween the North Pacific and North Atlantic is a characteristic result
[132-133]. Indeed, the MOW was recently proposed to be an alter- of a closed Bering Strait [136, 139], the otherwise unexplained
native source of heat advection in the North Atlantic [133]. In the warming [128] of the North Pacific recorded in the Integrated
following section, I consider this prospect. Ocean Drilling Program (IODP) Site U1343 located on the north-
ern Bering Sea slope is probably evidence of that closure (Figure
8) Similarly, the oscillations of the sea level shown in Figure 6
during the “900-Ka event” would temporally open and close the
strait, resulting in the phenomena described in the previous section
and displayed in Figure 6.
J Mari Scie Res Ocean, 2023 Volume 6 | Issue 2 | 41You can also read