The outlook for oceans, seas and marine resources in Latin America and the Caribbean - Conservation, sustainable development and climate change ...
←
→
Page content transcription
If your browser does not render page correctly, please read the page content below
The outlook for
  oceans, seas and
marine resources in
 Latin America and
     the Caribbean
  Conservation, sustainable
  development and climate
         change mitigation

                 Marcia Tambutti
               José Javier Gómez
                           Editors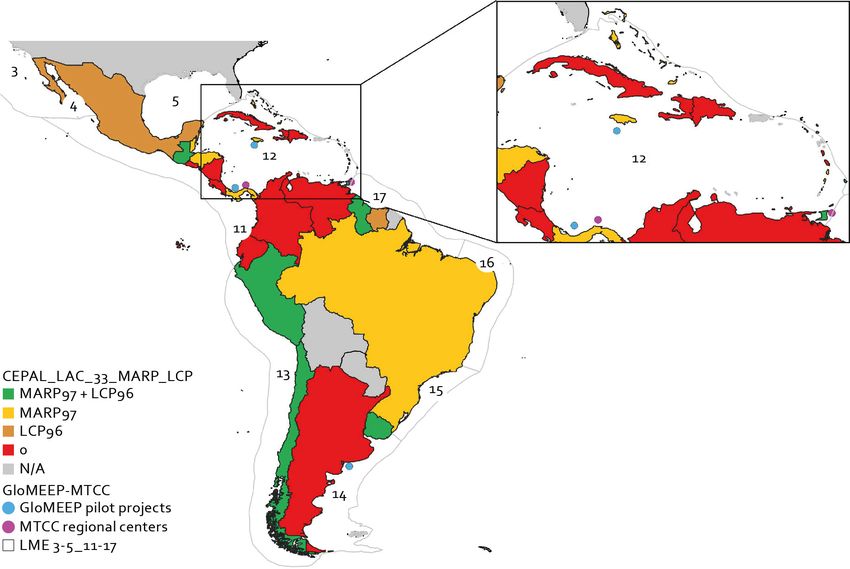
Thank you for your interest in
   this ECLAC publication

     ECLAC
     Publications

  Please register if you would like to receive information on our editorial
products and activities. When you register, you may specify your particular
areas of interest and you will gain access to our products in other formats.

                                         Register

                                        www.cepal.org/en/publications

                                        facebook.com/publicacionesdelacepal

                        Publicaciones
                                        www.cepal.org/apps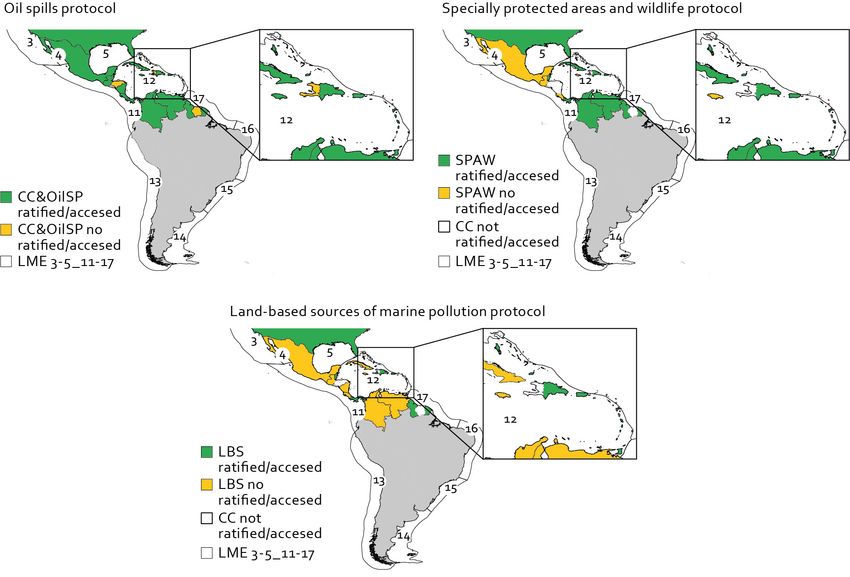
Project Documents

The outlook for oceans, seas and marine resources
       in Latin America and the Caribbean

      Conservation, sustainable development and
              climate change mitigation

                    Marcia Tambutti
                   José Javier Gómez
                         Editors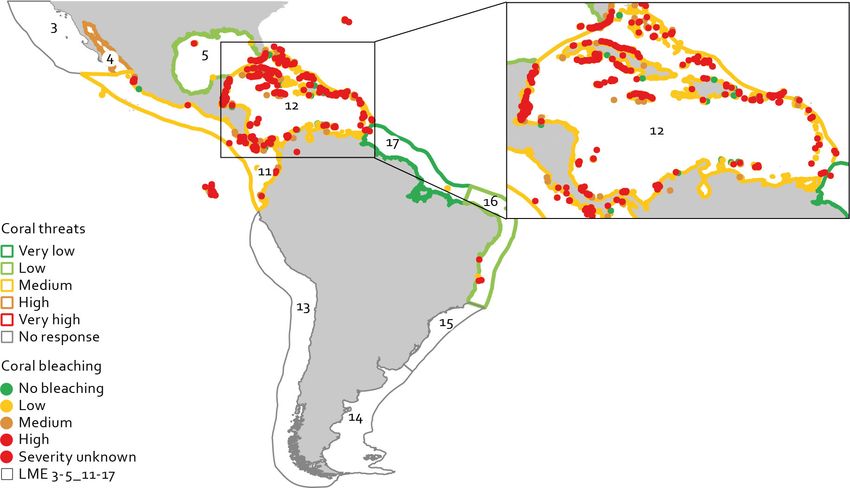
This document has been prepared by Porfirio Álvarez, Enrique Sanjurjo, Sergio Larios and Rosalinda Amezcua, under
the supervision of Marcia Tambutti, Agriculture and Biodiversity Unit, Division of Natural Resources of the Economic
Commission for Latin America and the Caribbean (ECLAC), and José Javier Gómez, Economics of Climate Change Unit,
Division of Sustainable Development and Human Settlements of ECLAC, under the ECLAC/Ministry of Foreign Affairs of
Norway project “Regional reports on the state of the oceans in the LAC region”.
Thanks are owed for contributions of information and valuable conceptual inputs to: Raffaella Anilio, Horacio Castellaro,
Margarita García Martínez, Carolina Quiróz Salazar, Jeannette Sánchez, Paul Wander and Zitlaly Zavala.
The views expressed in this document, which has been reproduced without formal editing, are those of the authors and
do not necessarily reflect the views of the Organization.
The boundaries and names shown on the maps included in this publication do not imply official endorsement or
acceptance by the United Nations.

United Nations publication
LC/TS.2020/167
Distribution: L
Copyright © United Nations, 2020
All rights reserved
Printed at United Nations, Santiago
S.20-00911

This publication should be cited as: M. Tambutti and J.J. Gómez (eds.), “The outlook for oceans, seas and marine resources
in Latin America and the Caribbean: conservation, sustainable development and climate change mitigation”, Project
Documents (LC/TS.2020/167), Santiago, Economic Commission for Latin America and the Caribbean (ECLAC), 2020.
Applications for authorization to reproduce this work in whole or in part should be sent to the Economic Commission
for Latin America and the Caribbean (ECLAC), Publications and Web Services Division, publicaciones.cepal@un.org.
Member States and their governmental institutions may reproduce this work without prior authorization, but are
requested to mention the source and to inform ECLAC of such reproduction.
ECLAC                                 The outlook for oceans, seas and marine resources in Latin America and the Caribbean...                        3

                                                             Contents

Foreword ............................................................................................................................... 7
Introduction........................................................................................................................... 9
I.       Geopolitical configuration used in this study.................................................................. 11
         A. FAO fishing areas in the LAC region......................................................................................... 12
         B. Large Marine Ecosystems........................................................................................................ 12
II.      Target 14.1.................................................................................................................. 13
         A.  Chemical and nutrient pollution................................................................................................13
         B.  Marine debris and plastics........................................................................................................ 15
         C.  Identified relevant actions in the region................................................................................... 16
III.     Target 14.2.................................................................................................................. 17
         A.  Protect and restore ecosystems to achieve healthy and productive oceans...............................17
IV.      Target 14.3.................................................................................................................. 21
V.       Target 14.4.................................................................................................................. 25
VI.      Target 14.5.................................................................................................................. 29
VII.     Target 14.6.................................................................................................................. 33
         A.  End of subsidies contributing to overfishing............................................................................. 33
         B.  Redirection of fishery subsidies................................................................................................ 34
         C.  End illegal, unreported, and unregulated fishing (IUU)............................................................. 35
VIII. Target 14.7.................................................................................................................. 37
      A. Small Island Developing States.................................................................................................37
      B. Importance of tourism............................................................................................................. 38
      C. Importance of fisheries............................................................................................................ 39
IX.      Target 14.A................................................................................................................. 41
X.       Target 14.B................................................................................................................. 45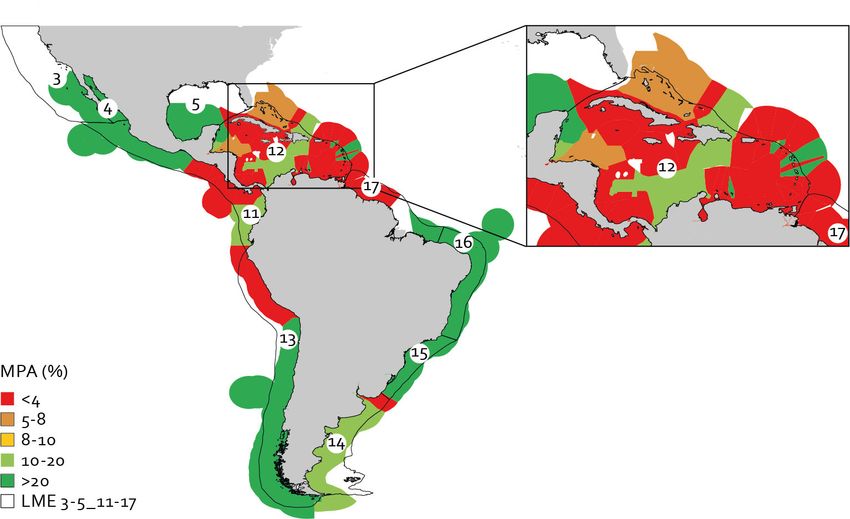
4   ECLAC                                 The outlook for oceans, seas and marine resources in Latin America and the Caribbean...

    XI.      Target 14.C................................................................................................................. 49
    XII.     Climate Change and Ocean Conservation....................................................................... 53
             A.  Ocean-based renewable energy............................................................................................... 54
             B.  Ocean-based transport............................................................................................................ 56
             C.  Coastal and marine ecosystems .............................................................................................. 57
             D.  Fisheries, aquaculture and dietary shifts.................................................................................. 58
             E.  Carbon storage in the seabed................................................................................................... 60
    XIII. Recommendations....................................................................................................... 61
          Reduce marine pollution.................................................................................................................. 61
          Minimize the impacts of climate change and ocean acidification..................................................... 61
          Accelerate the transition to more sustainable fishing...................................................................... 62
          Protect and restore ecosystems and conserve coastal and marine areas.......................................... 62
          Increase the economic benefits to Small Island Developing States (SIDS)........................................ 63
          Increase scientific knowledge about the ocean ............................................................................... 63
          Implementation of the Law of the Sea............................................................................................. 63
    Bibliography......................................................................................................................... 65
    Acronyms ............................................................................................................................ 72

    Tables
    Table V.1              Annual wild fisheries production by subregion.......................................................... 26
    Table VII.1            Main drivers associated with Illegal, Unreported and Unregulated Fishing
                           and possible solutions............................................................................................... 35
    Table VIII.1           Latin American and Caribbean SIDS by United Nations membership.........................37
    Table IX.1             Global Environment Facility (GEF) funded programmes established in six Large
                           Marine Ecosystems of the LAC region and their core contribution
                           to SDG 14 targets and indicators............................................................................... 43
    Table XII.1            Total technical potential for offshore wind generation by region.............................. 55
    Table XII.2            Potential in terms of restorable aboveground biomass and soil carbon..................... 58

    Figures
    Figure 1               Number of marine ecoregions present in each geographical region of the world...... 10
    Figure III.1           Global and Latin American and Caribbean Ocean Health Index scores (2019)............ 18
    Figure IV.1            Projections of coral reef risk for years 2030 and 2050 due to ocean acidification....... 22
    Figure V.1             Sustainability of fish stocks in Latin America and the Caribbean............................... 25
    Figure VI.1            Total surface of marine protected areas in Latin America and the Caribbean
                           (2000-2019).............................................................................................................. 30
    Figure VII.1           Subsidies in the world, the five major subsidizer countries and in Latin America
                           and the Caribbean.................................................................................................... 34
    Figure VIII.1          Income generated by tourism in proportion to GDP.................................................. 38
    Figure VIII.2          Fish protein as a proportion of total animal protein consumption............................. 39
    Figure VIII.3          Sustainable fisheries as a proportion of GDP in SIDS, least developed countries,
                           and all countries....................................................................................................... 40
    Figure X.1             Relative importance of small-scale fisheries versus total fisheries in the region......... 46
    Figure XII.1           Technical potential for offshore wind generation in Latin America
                           and the Caribbean.................................................................................................... 55
    Figure XII.2           Carbon emissions in food production........................................................................ 59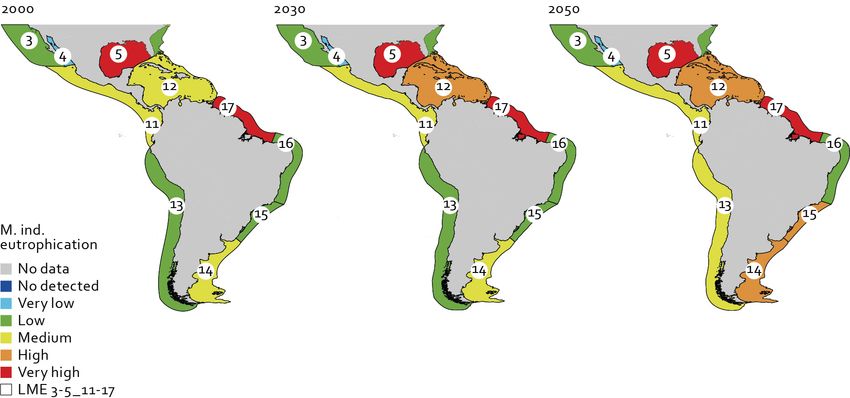
ECLAC                      The outlook for oceans, seas and marine resources in Latin America and the Caribbean...                        5

Maps
Map 1       Number of marine ecoregions present in each geographical region of the world...... 10
Map I.1     Latin American and Caribbean subregions, clustered fishing areas determined
            by the Food and Agriculture Organization and the associated 10 Large
            Marine Ecosystems (LMEs)........................................................................................11
Map II.1    Eutrophication and hypoxic zones in the LAC region................................................. 14
Map II.2    LAC region merged nutrient indicator for 10 LMEs modelled for years 2000,
            2030 and 2050........................................................................................................... 15
Map II.3    Distribution of micro weight density, macro count density and the total weight
            density of plastics in the LAC region......................................................................... 16
Map III.1   Ocean Health Index of Latin American and Caribbean Large Marine
            Ecosystems (2019).................................................................................................... 18
Map IV.1    Coral reef bleaching in Latin America and Caribbean region accordingly to NOAA
            categories (1963-2018) and local coral threats status according to UNEP (2016)....... 23
Map V.1     Voluntary schemes for transitioning towards sustainable fisheries
            in Latin America and the Caribbean.......................................................................... 27
Map VI.1    Coverage of marine protected areas in relation to marine areas, by country............. 30
Map VII.1   Adherence of LAC countries to the international framework for addressing IUU....... 36
Map IX.1    Marine research stations across the LAC region........................................................ 42
Map X.1     Activities identified by FAO to put small-scale fisheries guidelines in action.............. 47
Map XI.1    Governance architecture assessment related to existing agreements
            in the LAC region...................................................................................................... 50
Map XI.2    Cartagena Convention: signature and ratification status, 2020................................. 51
Map XII.1   Latin America and Caribbean: use of the different tools provided by IMO
            to reduce GHG from maritime transport....................................................................57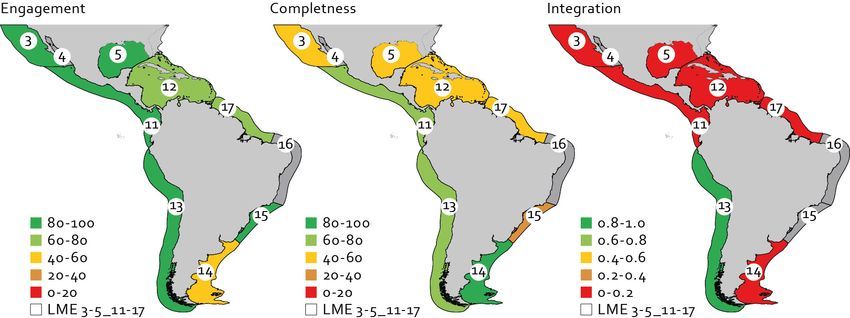
ECLAC                      The outlook for oceans, seas and marine resources in Latin America and the Caribbean...   7

                                            Foreword

The year 2020 was meant to be a turning point for oceans. The United Nations had convened the
second United Nations Conference to Support the Implementation of Sustainable Development Goal 14
(the Ocean Conference). Unfortunately, the Conference had to be postponed due to the coronavirus
disease (COVID-19) pandemic and oceans were thus included in agenda of the Conference of the Parties
to the United Nations Framework Convention on Climate Change. This was expected to be the year for
achieving several internationally agreed goals, such as four targets of Goal 14 of the 2030 Agenda and
the Aichi Biodiversity Targets, most of which have not been achieved. Expectations were also high that
2020 would be the year in which a global ocean treaty would be signed, creating a legal framework for
the conservation and sustainable use of marine biological diversity of areas beyond national jurisdiction.
Nevertheless, 2020 has seen great endeavours to disseminate the finest global knowledge on our oceans,
which make up two thirds of our planet.
       The Economic Commission for Latin America and the Caribbean (ECLAC) launched a regional outlook
on SDG 14 implementation in LAC. Specifically, it seeks to identify the main developments, advances,
changes in legal and institutional frameworks, including gaps and barriers. It follows the United Nations
General Assembly Resolution 73/292 call to support the implementation of the Sustainable Development
Goal 14: “Conserve and sustainably use the oceans, seas and marine resources for sustainable development,”
as well as the results of the High-Level Panel for the Sustainable Economy of the Oceans.
       The study has been made possible thanks to the support of the Government of Norway, whose
leadership in the sustainable and economic development of the oceans (promoted by Erna Solberg) has
assembled an outstanding initiative for ocean action. The High-Level Panel for the Sustainable Oceans
Economy has provided extensive up-to-date information, analysis and perspectives essential for change.
Norway is an ocean-based society that has shared their vision and knowledge of how oceans can play a
key role on present and future global security and human well-being.
       Latin America and the Caribbean is a region with great marine heritage. Twenty-three of the 33 LAC
nations have more marine than terrestrial territory. Of these, for 18 the maritime area of its economic
exclusive zone exceeds 75% of total territory. Recently, ECLAC showed that the region includes 47 of the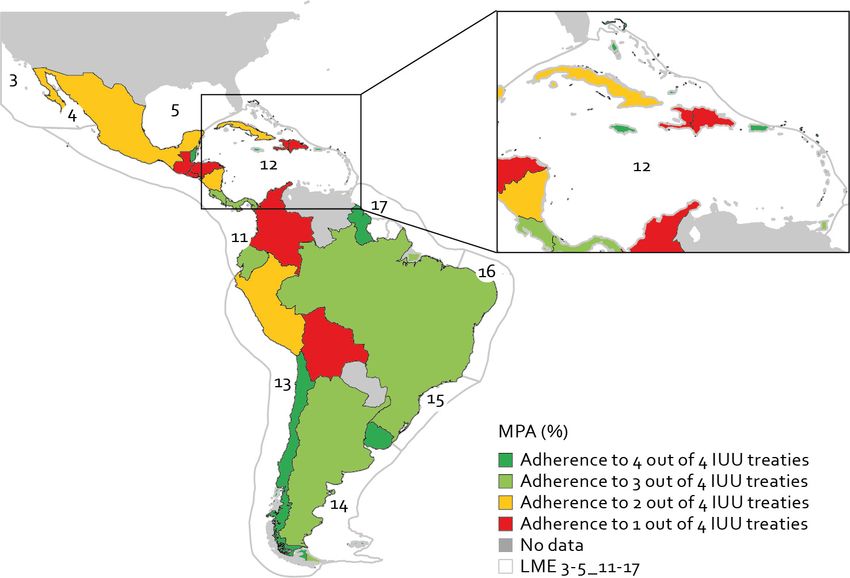
8   ECLAC                              The outlook for oceans, seas and marine resources in Latin America and the Caribbean...

    258 marine ecoregions1 around the world, more than any other region. Also, approximately 2.3 million
    people in LAC are directly or indirectly involved with fishing activities (Chuenpagdee et al., 2019; FAO 2014a).
    More than 27% of the population live in coastal areas.2 In the Caribbean the importance of tourism as a
    fraction of the gross domestic product (GDP) exceeds 60% in Antigua & Barbuda and reaches 20% or more
    in 10 small island developing States (SIDS). The importance of oceans to livelihoods and food security of
    Latin America and the Caribbean people must catalyse our action towards blue sustainable development
    with oceans playing a source of potential solutions and innovation.
           Our coasts, seas and oceans have generally been invisible in many critical areas. A significant data
    gap exists between land and ocean based natural processes and economic impacts. Without up-to-date
    and robust marine knowledge we enlarge existing barriers to achieving transformative changes vis-à-vis
    out interaction with the oceans.
            In preparation for the launch of the United Nations Decade of Oceans Science for Sustainable
    Development 2021-2030, ECLAC seeks to provide this study as a tool for regional mechanisms and
    coordination efforts and offers new ideas as alternative indicators for some targets. It is also aimed to
    strengthen cooperation in order to reduce gaps and to eliminate barriers to advance in the implementation
    of SDG 14 and, ultimately, SDG 13. In light of the transboundary nature of the marine environment and
    interdependencies between the Agenda’s targets and goals, the implementation of the ocean SDG
    will fall short of the transformative ambition of the 2030 Agenda without effective coordination at the
    regional level.
           The region cannot be left behind in meeting the goals of the oceans. Practically all the goals that
    should have been met by 2020 have not already been achieved and the majority requires greater efforts
    to be achieved, except DSG 14.5 having at least 10% of marine areas under protection. There are regional
    aspects that, due to their socio-ecological importance, must be prioritized with urgent policies and
    adequate monitoring follow-up, such as sustainable fishing with special attention to small scale fisheries,
    pollution and priority ecosystems as mangroves.
           ECLAC will work in coordination with other United Nations agencies and other platforms to assist
    countries to reorient activities towards sustainable tourism and fishing (especially in artisanal fishing and
    indigenous peoples and local communities) to reorient economic incentives, diversify markets, avoid
    and reduce pollution of the seas, strengthen marine protected areas, recover and support technology
    and low GHG blue bioeconomy, as well as the transfer of knowledge between countries, and of course,
    strengthen the follow-up of regional multilateral agreements and arrangements that ensure healthy
    marine ecosystems offshore and within exclusive economic zones, strengthen the capacity of ecosystems
    to mitigate and adapt to climate change.

    1   According to Spalding et al. 2007. “Marine Ecoregions of the World: A Bioregionalization of Coastal and Shelf Areas.” BioScience
        (7)57: 573-583.
    2   Includes only urban coastal areas (100k) https://scielo.conicyt.cl/scielo.php?script=sci_art
        text&pid=S0718-34022016000200009.
ECLAC The outlook for oceans, seas and marine resources in Latin America and the Caribbean... 9
Introduction
The 2030 Agenda set SDG 14 to conserve and to use oceans, seas, and marine resources sustainably. Over
3 billion people worldwide depend on coastal and marine ecosystems for making a living, recognizing
that oceans are home of more than one million known species and acknowledging that oceans are our
planet’s life support and regulate the global climate system.
For this goal, 10 targets with defined indicators were stablished. After five years, it is important
to evaluate their compliance. This document evaluates each of the targets and indicators defined for
the SDG 14 in Latin America and the Caribbean (LAC), complementing the analysis with additional data
available and innovative ideas for the regional follow-up. A last section describing the linkages between
the Climate Change Agenda included in SDG 13 and SDG 14 is explored, making emphasis in the prospects
for climate change mitigation that the oceans provide, and its opportunities in the region.
The LAC region is considered one of the most important productive areas of the world, with a
unique marine biodiversity, home of the second largest barrier reef of the world. LAC has a uniquely
productive marine area and represents a significant portion of global marine biodiversity. As a proxy for a
quantitative measure of biodiversity, it has the presence of 47 of the 258 global marine ecoregions —more
than any other region (ECLAC 2020 based on Spalding et al., 2007) (map 1 and figure 1). Furthermore, has
unique environments such as the Galapagos, underwater trenches of more than 8000m depth practically
unexplored, cold water reefs, inter alia.
Coastal dwellers and population in coastal areas depend on tourism, commercial, and artisanal
fishing, among others. There is potential to sustainably use its resources, with low carbon use and taking
advantage of its coastal and marine ecosystems that has not been fully addressed and represented in its
institutional development and governance system. Except for the case of coverage of protected areas in
relation to marine areas, at which the region has exceeded the target defined by the United Nations, in the
rest of the cases the analysis detected a need to accelerate the pace in order to achieve the targets; and
even in the case of coverage of protected areas, the need of making effective management is considered
to achieve the goal.10 ECLAC The outlook for oceans, seas and marine resources in Latin America and the Caribbean...
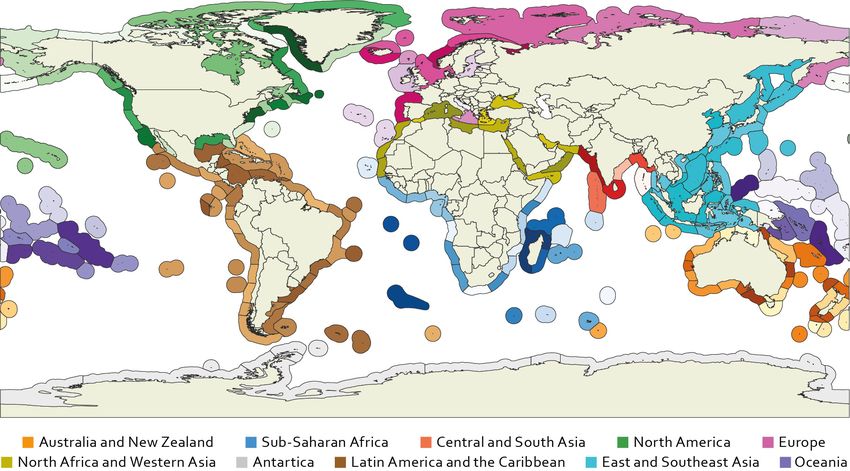
Map 1
Number of marine ecoregions present in each geographical region of the world
Source: Prepared by ECLAC based on ecoregions proposed by Spalding et al. (2007), “Marine Ecoregions of the World: A Bioregionalization
of Coastal and Shelf Areas.” BioScience (7)57: 573-583, [online] https://www.worldwildlife.org/biomes; and [online] https://unstats.un.org/
unsd/methodology/m49/overview/.
Figure 1
Number of marine ecoregions present in each geographical region of the world
50
40
30
47
20
32 32 31 30 29
25
10
14
10 8
0
Latin America
and the Caribbean
Sub-Saharan
Africa
Australia and
New Zealand
North America
East and
Southeast Asia
Europe
Oceania
North Africa and
Western Asia
Antartica
Central and
South Asia
Source: Prepared by the authors based on ecoregions proposed by Spalding et al. (2007), “Marine Ecoregions of the World: A Bioregionalization
of Coastal and Shelf Areas.” BioScience (7)57: 573-583, [online] https://www.worldwildlife.org/biomes; and [online] https://unstats.un.org/
unsd/methodology/m49/overview/.ECLAC The outlook for oceans, seas and marine resources in Latin America and the Caribbean... 11
I. Geopolitical configuration used in this study
The LAC region has three major sub-regions, Mesoamerica, Caribbean and South America, with a maritime
territory of 16 million square kilometres and more than 70,000 kilometres of coastline, for 22 countries in
the region, the sea represents 60% or more of their sovereign territory (World Bank, 2015; UNEP, 2016;
ECLAC, 2019).
The region has four major fishing areas defined by the Food and Agriculture Organization (FAO),
(FAO-CWP, 2020). Additionally, the LAC region contains 10 of the 66 Large Marine Ecosystems (LMEs) of
the world (Large Marine Ecosystems of the World, 2020). Both, fishing areas and large marine ecosystems
of the LAC region are shown in Map I.1.
Map I.1
Latin American and Caribbean subregions, clustered fishing areas determined by the Food and Agriculture
Organization and the associated 10 Large Marine Ecosystems (LMEs)
Source: Prepared by the authors based on Large Marine Ecosystems of the World (2020) http://www.fao.org/cwp-on-fishery-statistics/
background/en/[online] http://lme.edc.uri.edu/index.php/lme-introduction[accessed in April 2020].12 ECLAC The outlook for oceans, seas and marine resources in Latin America and the Caribbean...
A. FAO fishing areas in the LAC region
Fishing areas proposed by FAO enable the analysis for specific SDG 14 targets and indicators related
to fisheries sector. Such regionalization analysis is combined with the ten Large Marine Ecosystem
(UNEP, 2016; Large Marine Ecosystems of the World, 2020). The proposed regionalization approach
incorporates two of the largest semi-enclosed seas and is influenced by the discharge of some of the
largest rivers (Amazon, Orinoco, Mississippi). It also includes the Exclusive Economic Zones (EEZs) of
28 nation states and 16 territories belonging to the Netherlands, the United Kingdom of Great Britain
and Northern Ireland, France and the United States of America, from these 29 are considered small island
developing States (SIDS).
B. Large Marine Ecosystems
LMEs have important features related to ecosystem goods and services, their physical extent and
boundaries are based on four linked ecological, rather than political or economic, criteria: (i) bathymetry,
(ii) hydrography, (iii) productivity, and (iv) trophic relationships (GEF LME:LEARN, 2017). LMEs in the region
are transboundary in nature and interconnected by the marine currents and movement and migration
of marine resources. With unique oceanographic features, topography, marine currents, productivity,
and interactions. Relatively large areas of ocean space of about 200,000 km2 or more, adjacent to the
continents and extending out to the break in a continental shelf or the seaward extent of a current system
(Sherman, 2014). LAC LMEs harbour biodiversity and provide important ecosystem services and tangible
benefits, including livelihoods, food security, carbon sequestration and storage, marine transport, and
recreational opportunities.
The LMEs approach supports the merger between natural and social sciences in the application
of a five module assessment and management strategy to assess and monitor changing conditions in
ecosystem: (i) productivity, (ii) fish and fisheries, (iii) pollution and ecosystem health, (iv) socioeconomics
and (v) governance (Sherman, 2014; Duda and Sherman, 2002), providing a rallying point for countries
to cooperate in dealing with problems relating to the utilization of transboundary marine resources,
(Sherman, 2014; Sherman et al., 2017).ECLAC The outlook for oceans, seas and marine resources in Latin America and the Caribbean... 13
II. Target 14.1
By 2025, prevent and significantly reduce marine pollution of all kinds, in particular from
land-based activities, including marine debris and nutrient pollution.
Indicator: Index of coastal eutrophication and floating plastic debris density. This indicator
has been prioritized by the Statistical Coordination Group for the 2030 Agenda in LAC et al.
(https://agenda2030lac.org/estadisticas/indicadores-priorizados-seguimiento-ods.htm).
Marine pollution is a combination of trash and chemicals, most of which comes from land sources and is
washed or blown into the ocean. This type of pollution ends damaging coastal and marine species and
ecosystems and eventually affecting the way of life of coastal communities and the ocean economy. An
adequate way to analyse and tackle the problem of marine pollution is to divide between nutrient pollution,
and marine debris.
A. Chemical and nutrient pollution
This type of pollution occurs when human activities, notably the use of fertilizer on farms, lead to
the runoff of chemicals into waterways that ultimately flow into the ocean. The overload of nutrients
such as of nitrogen, phosphorus, and organic matter into marine waters, promote eutrophication. These
excess of nutrients, often leads to harmful algal blooms which can lead to oxygen depletion. This oxygen
depletion process is called hypoxia, which ends on fish kills and dead zones. The levels of hypoxia and
eutrophication provide us with the best indicators to analyse the effects of chemical and nutrient pollution.
Forty-four hypoxic areas of the world were identified in 1995, by 2007 there were 169 hypoxic areas
(Diaz and Rosenberg, 2008). Current global conditions report, at least there are 479 sites identified as
experiencing hypoxia. Map II.1 shows there are 19 hypoxic zones and 31 eutrophic areas identified in the
LAC region (World Resource Institute, 2020).14 ECLAC The outlook for oceans, seas and marine resources in Latin America and the Caribbean...
As shown in Map II.1, the Gulf of Mexico exhibits the largest hypoxic areas of the region (and actually,
of the world), the Northern Gulf of Mexico hypoxic zone was 9 500 km2 of area in the early 1990s, by 2008
it had grown to 22 000 km2. The latest forecast of the size of the hypoxic zone in the northern Gulf of
Mexico for late July 2020 is that it will cover 20,121 km2 of the bottom of the continental shelf off Louisiana
and Texas (Turner, E. and Rabalais, N., 2020). Many rivers drain into the Gulf, notably the Mississippi in
the northern Gulf accounts for about 90% of the freshwater inflow to the Gulf (Padrón López, 2015).
Human inputs of nutrients around the Gulf can lead to eutrophication (Rabalais et al., 2010). As a result,
problems of environmental degradation such as hypoxia affect the LME across jurisdictional boundaries
and cannot effectively be redressed without multinational collaboration (Carlisle, 2014).
Map II.1
Eutrophication and hypoxic zones in the LAC region
Source: Prepared by the authors on the basis of data from World Resource Institute (2020) Eutrophication & Hypoxia Map Data Set
[online database] https://www.wri.org/resource/interactive-map-eutrophication-hypoxia [accessed in July 2020].
The Merged Nutrient Indicator is derived from two basic sub-indicators: Nitrogen Load and
Nutrient Ratio (ratio of dissolved Silica to Nitrogen or Phosphorus) these conform the Index of Coastal
Eutrophication Potential (ILEC, UNEP-DHI, UNESCO-IHP, UNESCO-IOC and UNEP, 2016). The regional
future scenario exhibits large amounts of nutrients (nitrogen load) entering coastal waters that that are
worrisome in four LMEs (map II.2), leading to high and very high hypoxic or anoxic conditions, increased
turbidity and changes in community composition, among other effects.ECLAC The outlook for oceans, seas and marine resources in Latin America and the Caribbean... 15
Map II.2
LAC region merged nutrient indicator for 10 LMEs modelled for years 2000, 2030 and 2050
Source: Adapted from ILEC, UNEP-DHI, UNESCO-IHP, UNESCO-IOC and UNEP (2016) “Water System Information Sheets: Northern America”
Transboundary Waters: A Global Compendium, Talaue-McManus, L. (ed)., Volume 6-Annex A, B and C, United Nations Environment
Programme (UNEP), Nairobi.
B. Marine debris and plastics
The LAC region has been steadily invaded by plastics from the Atlantic and Pacific oceanic basins. A
fraction of that pollution, micro-plastics, has been reported in places as remote as Patagonia in South
America (Perez-Venegas et al., 2018), and have reached every marine environment including the deep
ocean, deep sea trenches, Artic sea-ice, and the Antarctic Circumpolar Current (Van Cauwenberghe
et al., 2013; Obbard et al., 2014; Ivar do Sul et al., 2011). Food chains have also been invaded at different
levels (Wright, et al. 2013).
Plastics are the most important pollutant in LAC marine waters. Four main factors contributing
to the increasing levels of marine debris have been identified: i) population growth, urban development
and tourism growth; ii) high demand of plastic products and production; iii) climate change; and iv) poor
governance, lack of regulation and enforcement for land use planning; poor waste management; and
marine industries poor management. The LAC region is heavily affected by microplastics since river
basins, estuaries and beaches drain to the western tropical and sub-tropical Atlantic (Browne et al., 2011;
Becheruccia et al., 2017) and beaches of the Caribbean Sea are also affected (de Scisciolo et al., 2016).
Map II.3 shows the wider Caribbean region being impacted by the highest levels of plastics.
Overall risk scenarios condition for the LAC LME region is shown in map II.3. Models estimate a
floating plastic abundance of micro, macro-plastic and total plastic distribution in the 10 LMEs of the
LAC region (map II.3), differences in the loads are based on three proxy sources of litter: shipping density,
coastal population density and the level of urbanization within major watersheds, with enhanced overflow.
For the Atlantic region the abundance of floating plastic is 100 times higher than other LMEs in the LAC
region, the Patagonian Shelf LME it has been estimated 400 times lower than LMEs with the highest
value (ILEC, UNEP-DHI, UNESCO-IHP, UNESCO-IOC and UNEP, 2016).16 ECLAC The outlook for oceans, seas and marine resources in Latin America and the Caribbean...
Map II.3
Distribution of micro weight density, macro count density and the total weight density of plastics
in the LAC region
Source: Adapted from ILEC, UNEP-DHI, UNESCO-IHP, UNESCO-IOC and UNEP (2016) “Water System Information Sheets: Northern America”
Transboundary Waters: A Global Compendium, Talaue-McManus, L. (ed)., Volume 6-Annex A, B and C, United Nations Environment
Programme (UNEP), Nairobi.
C. Identified relevant actions in the region
In support of the Cartagena Convention, the Caribbean Environmental Programme (CEP) developed a
Regional Action Plan on Marine Litter Management (RAPMaLi) for the wider Caribbean region (WCR)
(2014), for which the Global Environment Facility has funded two related programmes for the Caribbean and
Gulf of Mexico (under implementation). (GEF,2016; GEF, 2018). The 2014 RAPMaLi in the wider Caribbean
region was designed to serve as a comprehensive toolkit to assist SIDS in incorporating mechanisms of
proper waste management across all sectors (UNEP-CAR, 2014; UN Environment, 2018).
The primary source of data for the occurrence of man-made litter in the near shore and coastal waters
of the wider Caribbean region is catalogued annually as part of the International Coastal Clean-up (ICC)
Day. During the 7-year period of 2006-2012, marine litter data was documented during the annual ICC in
13 participating countries of the wider Caribbean region. A total of 3,990,120 debris items were removed
from the coastal and underwater sites with a total weight of 1,913,166 pounds, covering 2,317 miles by
142,957 volunteers.ECLAC The outlook for oceans, seas and marine resources in Latin America and the Caribbean... 17
III. Target 14.2
By 2020, sustainably manage and protect marine and coastal ecosystems to avoid
significant adverse impacts, including by strengthening their resilience, and take action for
their restoration in order to achieve healthy and productive oceans.
Indicator: Proportion of national exclusive economic zones managed using
ecosystem-based approaches.
The LAC region has prioritized indicator C-14.2 mangrove area.
A. Protect and restore ecosystems to achieve healthy
and productive oceans
Assessment of actions to achieve healthy and productive oceans in the LAC region include progress on
the implementation of actions aim to restore ecosystems, projects to strengthen resilience or proportion
of zones managed using ecosystem-based approaches, the former will be described on detail as part
of the target 14.5. This report focuses on the ultimate reason of the target, evaluating the health and
productivity of the oceans through the Ocean Health Index (OHI) indicator.
The OHI combines biological, physical, economic, and social indicators that are fundamental for
healthy oceans. The scores, which range on a scale from 0 to a 100, assess how sustainably people are
using marine ecosystem in a region (Ocean Health Index, 2015), being 100 a healthy and productive
ecosystem. Figure III.1 shows OHI global and LAC values.
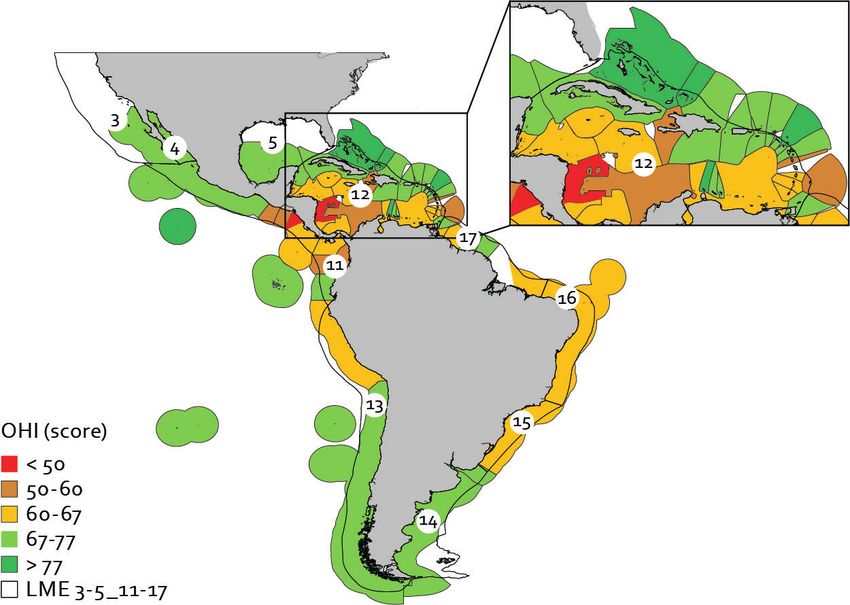
In 2019, LAC region scored generally slightly lower than the global average, except in one element
of the index (Sense of Place) which is bigger in LAC. Scores are particularly low in absolute terms, and
compared to global averages, in food provision, natural products and tourism and recreation. OHI scores
for LAC region have not changed significantly between 2012 and 2015, the first two have the major
differences with the global average (UNEP-WCMC, 2016). However, some of the underlying datasets
have not been updated since 2012, which may be masking regional changes (Halpern et al., 2015).18 ECLAC The outlook for oceans, seas and marine resources in Latin America and the Caribbean...
Figure III.1
Global and Latin American and Caribbean Ocean Health Index scores (2019)
100
90
80
70
60
50
40
30
20
10
0
Sense of place
Tourism and
recreation
Index score
Artisanal fishing
Carbon storage
Biodiversity
Coastal protection
Clean waters
Livelihoods
and economics
Food provision
Natural products
Global 2019 Latin America and the Caribbean 2019
Source: Ocean Health Index (2019) “Global scores” [online database] http://ohi-science.nceas.ucsb.edu/plos_change_in_global_ocean_
health/ [accessed in November 2020].
Map III.1 shows OHI scores for LAC region. The Pacific region scores are relatively high, above 67-77,
except for the area in front of Peru, Guatemala, El Salvador, Honduras, Nicaragua, Costa Rica, and Panama
with scores of 50-60 andECLAC The outlook for oceans, seas and marine resources in Latin America and the Caribbean... 19
For the specific case of LAC, the sustainable management and protection of mangroves was
considered as a priority to measure the advance of the target in the region. Mangrove cover in the region
has experienced several changes, based on data from FAO (FAO, 2018a) indicate that the LAC region
mangroves have declined 20.22 % for the 2001-2018 period3. The Atlantic and Pacific coasts of Central
America are particular areas of concern, with as many as 40% of the mangrove species present listed on
the IUCN Red List as ‘threatened with extinction’ (Polidoro et al., 2010; Wilson, R. 2017).
The Gulf of Mexico LME is covered by mangroves in 0.36%; the Caribbean LME with 0.35%; the
North Brazil Shelf LME has the highest mangrove coverage of any LME, at 10,429 km2, 0.98% the total
area; the East Brazil Shelf LME covered by 0.14% mangroves; and the South Brazil has 0.12% area covered
by mangroves. In the Pacific region the Gulf of California LME has 0.52% of mangroves, followed by
the Pacific Central America Coastal LME with 0.39%, and the Humboldt Current LME accounts for only
0.0001% are covered by mangroves (ILEC, UNEP-DHI, UNESCO-IHP, UNESCO-IOC and UNEP, 2016). As
seen in table IX.1 there are several GEF funded programmes aim to restore mangrove areas in the Gulf
of Mexico and Caribbean LMEs, these actions may be replicated across the entire LAC region.
3 FAO FRA 2020 presented the recent mangrove stats with an overall 4% recovery for the LAC region. With some remarkable cases
like Cuba with (21%), Colombia (71%), Martinique (3%), Mexico (1%) French Guyana (19%).ECLAC The outlook for oceans, seas and marine resources in Latin America and the Caribbean... 21
IV. Target 14.3
By 2030 Minimize and address the impacts of ocean acidification, including through
enhanced scientific cooperation at all levels.
Indicator: average marine acidity (pH) measured at agreed suite of representative
sampling stations.
Increasing atmospheric CO2 concentration is causing increased absorption of CO2 by the world’s oceans,
in turn driving a decline in seawater pH and changes in ocean carbonate chemistry that are collectively
referred to as ocean acidification. Evidence is accumulating to suggest ocean acidification may directly
or indirectly affect many marine organisms and ecosystems. The LAC region has a series of important
signs of ocean acidification, particularly in coral reefs.
Data suggest that about one-quarter of the world’s reefs are at medium or high threat from
acidification during the current decade. By the 2030s, between 65% and 80% of reefs will be threatened
by acidification. By the 2050s, the overall percentage of reefs threatened by acidification will have
risen to over 80%, with a large percentage of coral reefs at high threat (figure IV.1). Projections from an
ensemble of climate models reveal the LAC region is rapidly reaching aragonite limitation, which is a
mineral needed for coral reef development.
The LAC region has the second largest barrier reef of the world, the Mesoamerican Barrier Reef
(MABR) net eroding due to acidification is 37%, with only 26% accreting with low net calcification rates
(Perry et al., 2013; McField, 2017). Other effects, such as reshaping of ecosystems and disruption of
natural food webs (specially with introduction of exotic invasive species) and coral diseases may also
prove important. Ocean acidification could cause tropical coralline algae to stop growing by 2040 and
subsequently to start to dissolve (Doney et al., 2009). Even healthy Caribbean reefs have minimal net
growth, due to the relatively slow growth rates of most corals and the constant forces of chemical and
biophysical erosion.22 ECLAC The outlook for oceans, seas and marine resources in Latin America and the Caribbean...
Figure IV.1
Projections of coral reef risk for years 2030 and 2050 due to ocean acidification
(Percentages)
Pacific Central America
Coastal LME
Caribbean LME
East Brazil Shelf LME
Gulf of Mexico LME
0 10 20 30 40 50
2050 2030
Source: Adapted from ILEC, UNEP-DHI, UNESCO-IHP, UNESCO-IOC and UNEP (2016) “Water System Information Sheets: Northern America”
Transboundary Waters: A Global Compendium, Talaue-McManus, L. (ed)., Volume 6-Annex A, B and C, United Nations Environment
Programme (UNEP), Nairobi.
Today, the lowest surface pH values in the world are found in the Eastern Tropical Pacific that
covers the Pacific Ocean side of Mexico, Central America up to the coastal areas of Ecuador (Fiedler
and Lavin, 2017). Ocean acidification in the Northeast Tropical Pacific LMEs also represent a reason for
concern, as projections reveal this is one of the regions more rapidly reaching aragonite limitation for
coral reef development under future scenarios. Another major threat is projected to occur in the Pacific
Central America Coastal region, as the reefs are already at the environmental limits for development.
The potential detrimental consequences of ocean acidification in the LAC region for marine life and
dependent human communities are more acute in the Caribbean SIDS due to the impacts on coral reefs
(Melendez and Salisbury, 2017).
The IPCC report on regional climate change (IGBP, IOC and SCOR, 2013; Gledhill et al., 2008);
found that the Caribbean region had experienced a sustained decrease in aragonite saturation state
from 1996 to 2006, additionally about 60% of coral reefs are surrounded by waters that have less than
adequate aragonite saturation states, if carbon dioxide concentrations increase to 450 ppm, more than
90% of coral reefs will be surrounded by such waters (Oceana, n.d.). Other models indicate that surface
ocean pH expected change is reflected in a decrease of pH of the order of 0.1 for the 2006-2055 period
versus the previous five decades. The variance of the pH in the modelled future appears to decrease by
as much as 50% in this period (Melendez and Salisbury, 2017).
Coral reefs within LMEs have been assessed (ILEC, UNEP-DHI, UNESCO-IHP, UNESCO-IOC and
UNEP, 2016) using the Global Distribution of Coral Reefs 2010 and the Reefs at Risk Revisited data sets,
using an integrated threat score that incorporates local and a global threats including warming sea
temperatures and ocean acidification projected to 2030 and 2050. As shown in map IV.1 several LAC LMEs
were found to have reefs facing high levels of integrated local threats (ILEC, UNEP-DHI, UNESCO-IHP,
UNESCO-IOC and UNEP, 2016). The percentage coral cover estimated as facing ‘high’ or ‘highest’ risk
from integrated threats increases substantially if past thermal stress is included.ECLAC The outlook for oceans, seas and marine resources in Latin America and the Caribbean... 23
Remote monitoring of coral reefs is critical for early detection, on-the-ground response, communication,
and future resilience planning to better protect these ecosystems from further degradation and loss.
Map IV.1 shows a map of coral bleaching categories in the LAC region, based on NOAA Coral Reef Watch
programme data for years 1963-2018. This can be used to develop models, observe, predict, and report
to users on the coral reef environment physical environmental changes.
Map IV.1
Coral reef bleaching in Latin America and Caribbean region accordingly to NOAA categories (1963-2018)
and local coral threats status according to UNEP (2016)
Source: Prepared by the authors based on NOAA (2020) “NOAA Coral Reef Watch (CRW) Products List” [online database]
https://coralreefwatch.noaa.gov/satellite/product_overview.php [accessed in November 2020]; IOC-UNESCO and UNEP (2016) Large
Marine Ecosystems: Status and Trends, Summary for Policy Makers, United Nations Environment Programme (UNEP), Nairobi.ECLAC The outlook for oceans, seas and marine resources in Latin America and the Caribbean... 25
V. Target 14.4
By 2020, effectively regulate harvesting and end overfishing, illegal, unreported and
unregulated fishing and destructive fishing practices and implement science-based
management plans, in order to restore fish stocks in the shortest time feasible, at
least to levels that can produce maximum sustainable yield as determined by their
biological characteristic.
Indicator: Proportion of fish stocks within biologically sustainable levels, also prioritized
by the regional approach.
According to United Nations the sustainability of global fishery resources continues to decline. Globally,
in 1974, 90% of the fish stocks were within biologically sustainable levels and by 2017 only 65.8% remained
at sustainable levels (United Nations, 2020). In the case of LAC the situation is similar. For 2017, the Atlantic
Southwest and Pacific Southeast reported less than 50% of the evaluated stocks on sustainable levels,
while the Atlantic Western Central and Pacific Eastern Central presented around 80% of the stocks at
sustainable levels as seen in figure V.1.
Figure V.1
Sustainability of fish stocks in Latin America and the Caribbean
Pacific Southeast
Atlantic Southwest
Atlantic Western Central
Pacific Eastern Central
0 20 40 60 80 100
Biologically sustainable Biologically unsustainable
Source: Prepared by the authors based on FAO (2020a) The State of World Fisheries and Aquaculture 2020, Sustainability in action, Rome,
FAO [online] https://doi.org/10.4060/ca9229en [accessed in November 2020].26 ECLAC The outlook for oceans, seas and marine resources in Latin America and the Caribbean...
Taking from 20 to 50% of the fish stocks to unsustainable levels had not represented an increase
of production in the region. Comparing the production of the 1980s with the current production, catches
had reduced in 23% (table V.1).
Table V.1
Annual wild fisheries production by subregion
Average annual production
Variation
Subregion (million tons)
1980s 1990s 2000s 2010s 1980s-2010s
Atlantic Western Central 2.01 1.83 1.55 1.47 -26.87
Atlantic Southwest 1.78 2.25 2.15 1.91 7.30
Pacific Eastern Central 1.62 1.44 1.81 1.7 4.94
Pacific Southeast 10.23 14.9 13.1 7.87 -23.07
Total 15.64 20.42 18.61 12.95 -17.20
Source: Prepared by the authors based on FAO (2020a) The State of World Fisheries and Aquaculture 2020, Sustainability in action, Rome,
FAO [online] https://doi.org/10.4060/ca9229en [accessed in November, 2020].
Losing stocks without increasing the total catches sounds counterintuitive; and poor fisheries
management could explain this situation. According to the World Bank, every year the world loses about
83 billion dollars compared with the optimal global maximum economic yield equilibrium (World Bank and
FAO, 2009; World Bank, 2017). Of this global loss, driven by inefficiencies, Latin America accounts for 7%.
In addition, climate change will have additional negative impacts on global marine fisheries, which will
require more urgency for taking actions to restore fisheries and improve management and governance.
Adequate fisheries management requires a science-based management plan to effectively
regulate harvesting. In 1995, FAO members adopted the Code of Conduct for Responsible Fisheries. For
the LAC region, the number of management plans per year has remained constant, an expression of the
lack of perceived urgency to address this issue by countries in the region (FAO, 2020a). Only Europe and
Southwest Pacific showed an increase in management plans in this period 2011-2018.
However, having official management plans is not the only way to transition to well-managed
fisheries. In the LAC region there are good examples of fisheries that are certified by the Marine
Stewardship Council (MSC), which establishes global voluntary standards to evaluate fisheries based on
indicators organized into three groups: stock status of the target fishery, impacts on ecosystems and
species and management. In addition, the region also provides good examples of fisheries transitioning
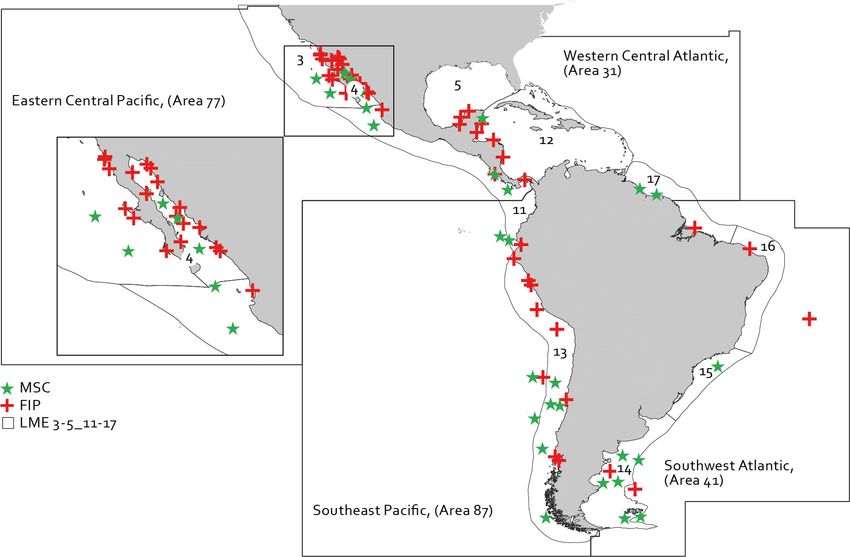
to sustainability under the voluntary Fishery Improvement Projects (FIP) scheme. Map V.1 shows nearly
80 MSC certified fisheries or FIPs evaluated according to fishery progress.
This means 80 communities or industries had decided, sometimes motivated by market incentives,
to voluntarily go beyond regulations and move towards sustainability. It is worth mentioning the case of
the Gulf of California, with almost one-third of all cases in a relatively small fraction of the region. These
cases show that even at the country level there seems to be weak progress in the region, at industry and
community level there are stories that provide some hope for the region.ECLAC The outlook for oceans, seas and marine resources in Latin America and the Caribbean... 27
Map V.1
Voluntary schemes for transitioning towards sustainable fisheries in Latin America and the Caribbean
Sources: Prepared by the authors based on: (a) Marine Stewardship Council - Track a Fishery (2020) [online database] https://fisheries.
msc.org/en/fisheries/ [accessed in October 2020] and (b) Fishery Improvement Project, Progress Tracking Database and Tool (2020)
[online database] https://fisheryprogress.org/directory [accessed in October 2020].ECLAC The outlook for oceans, seas and marine resources in Latin America and the Caribbean... 29
VI. Target 14.5
By 2020, conserve at least 10 per cent of coastal and marine areas, consistent with national
and international law and based on the best available scientific information.
Indicator: Coverage of protected areas in relation to marine zones, also prioritized regionally.
The LAC region has additionally prioritized indicator C-14.5 Proportion of MPAs compared
to total marine area.
According to Protected Planet database (UNEP-WCMC and IUCN, 2020 accessed on December 15, 2020),
there are 17,495 MPA in the world, which represent 7.66% of the total surface of the world’s oceans. The
LAC region has a total marine area of 18,723,205 square kilometers, with over 3.8 million square kilometres
of MPAs (including MPAs beyond the EEZ) representing 20% of the marine surface of the region, well
above the SDG 14.5 target, but not evenly, as shown in Map VI.1.
The target in LAC region has been fulfilled, however, there are over 20 countries that are still far
away to achieve it, while others like Martinique, Bonaire, Guadeloupe, and Saint Martin are dedicating
over 95% of their Economic Exclusive Zone (EEZ) as MPA. Large oceanic MPAs in Mexico, Ecuador, Chile,
and Brazil contribute significantly to the regional scale indicator. However, there is a clear need to provide
sufficient financial funds to properly carry out their management plans, surveillance, and field work.
Figure VI.1 shows the regional evolution on declaration on MPAs in the region during the last
10 years. Considering the 31 countries of the LAC region there are a total of 9,962 MPAs, 1,282 under
management effectiveness evaluations (UNEP-WCMC, 2020). MPA coverage in LAC is heterogeneous,
taking territorial seas and Economic Exclusion Zones together, the region has protected 17.51% of the
total area. Although MPA coverage represent a huge advance in the designation of new areas under
official decree, above the 10% established in this SDG 14.5 target and the Aichi target 11, such gain is
at risk, because only 1.79% of them have management plans (www.protectedplanet.net, [accessed in
December 15, 2020]). The lack of sufficient funds and the recent financial cuts documented put at risk the
gain in coverage. In addition, good governance, sound planning and design and effective management
that need to be addressed to ensure their functionality and its contribution to human well-being as IUCN
has propose in the Green List Standards for Protected and Conserved Areas (IUCN, n.d.).30 ECLAC The outlook for oceans, seas and marine resources in Latin America and the Caribbean...
Map VI.1
Coverage of marine protected areas in relation to marine areas, by country
(Percentages)
Source: Prepared by the authors based on UNEP-WCMC and IUCN (2020) “Marine Protected Areas” The World Database on Protected
Areas (WDPA)/The Global Database on Protected Areas Management Effectiveness (GD-PAME) [online database] www.protectedplanet.
net [accessed in November 2020].
Figure VI.1
Total surface of marine protected areas in Latin America and the Caribbean (2000-2019)
(Square kilometres)
6 000 000
5 000 000
4 000 000
3 000 000
10% target
2 000 000
1 000 000
0
2000
2001
2002
2003
2004
2005
2006
2007
2008
2014
2009
2010
2011
2012
2013
2015
2016
2017
2018
2019
Source: Prepared by the authors based on United Nations Global SDG Database, UNEP-WCMC and IUCN (2020) “Marine Protected
Areas” The World Database on Protected Areas (WDPA) [online database] www.protectedplanet.net December 2018, and country
data from ECLAC (2020) “CEPALSTAT” [online database] https://cepalstat-prod.cepal.org/cepalstat/tabulador/ConsultaIntegrada.
asp?idIndicador=3961&idioma=e [accessed in November 2020].ECLAC The outlook for oceans, seas and marine resources in Latin America and the Caribbean... 31
Since 2012 the area covered by MPAs has grown steadily complying with the 14.5 target in 2016.
However, MPAs do not cover all types of marine ecosystems, so the effort to protect a representative part
of them must be sustained. MPAs with strong protection under 30-40% of their key marine habitats will
conserve and enhance biodiversity, increasing abundance of marine life, improving resilience of marine
ecosystems. This well enforced MPAs extend its benefits to the fisheries sector, coastal protection by
improving their resilience against climate change processes. It is worth to mention that adding 10% of
protection in the coming years would help to overcome the current slow progress. Protection targets for
biodiversity should aim to represent a full range of marine ecosystems and species to ensure the reduction
of marine ecosystem impacts (Rogers, Aburto-Oropeza et al. 2020).
An iconic example of MPA success in LAC region is the absolute increase in fish biomass at
Cabo Pulmo National Park in the Gulf of California (CPNP), a well- documented recovery of this MPA
that attracts thousands of divers and generates millions of dollars for the surrounding community each
year. Marine-protected areas and marine conservation provide a clear pathway to integrate biodiversity
conservation and fisheries management with the potential for strong support by fishers and other
stakeholders (Erisman et al., 2017).You can also read