Investigating the Relationship Between World Development Indicators
←
→
Page content transcription
If your browser does not render page correctly, please read the page content below
Investigating the Relationship Between World Development Indicators and the
                                                   Occurence of Disease Outbreaks in the 21th Century: A Case Study

                                                                     Aboli Marathe1∗ , Harsh Sakhrani1∗ and Saloni Parekh1∗
                                                                      1
                                                                        Pune Institute of Computer Technology, Maharashtra, India
                                                                 {aboli.rajan.marathe, harshsakhrani26, saloniparekh1609}@gmail.com,
arXiv:2109.09314v2 [cs.LG] 27 Oct 2021

                                                                      Abstract                             previous disease outbreaks, and propose a method of accu-
                                                                                                           rately identifying these vulnerable sectors, including critical
                                                 The timely identification of socio-economic sectors       sectors like economy, healthcare and safety. We came across
                                                 vulnerable to a disease outbreak presents an impor-       the World Development Indicators (WDI), established by the
                                                 tant challenge to the civic authorities and health-       World Bank that are a set of indicators, collected over time for
                                                 care workers interested in outbreak mitigation mea-       every country through their individual governments. The in-
                                                 sures. This problem was traditionally solved by           dicators cover most sectors of development, including trade
                                                 studying the aberrances in small-scale healthcare         and safety markers and we thought of using these indica-
                                                 data. In this paper, we leverage data driven models       tors to estimate the vulnerability of different sectors. Some
                                                 to determine the relationship between the trends of       world development indicators get more affected than others
                                                 World Development Indicators and occurrence of            and their identification is a challenging problem for disease
                                                 disease outbreaks using worldwide historical data         outbreak preparedness and planning.
                                                 from 2000-2019, and treat it as a classic supervised
                                                 classification problem. CART based feature selec-
                                                 tion was employed in an unorthodox fashion to de-            Over the years, researchers have analysed the disease out-
                                                 termine the covariates getting affected by the dis-       breaks to determine the risk factors [Anno et al., 2019] and
                                                 ease outbreak, thus giving the most vulnerable sec-       aid the disease outbreak surveillance [Allard, 1998]. But
                                                 tors. The result involves a comprehensive analy-          the relationship between trends in socio-economic indicators
                                                 sis of different classification algorithms and is in-     and the occurrence of previous disease outbreaks still re-
                                                 dicative of the relationship between the disease out-     mains a mystery. While researchers tend to analyse socio-
                                                 break occurrence and the magnitudes of various de-        economic systems in the context of disease outbreaks, we
                                                 velopment indicators.                                     tried understanding the relationship between socio-economic
                                                                                                           systems and disease outbreaks. Whether metadata could be
                                                                                                           used to analyze the anomalies and their cause or impacts on
                                         1       Introduction                                              a country-per-country basis was our primary research ques-
                                         Coronavirus (COVID-19) has become an unprecedented                tion. We tried to answer this question using a different
                                         health crisis and has spread to over 150 countries, severely      methodology. In this paper, we propose an approach that
                                         impacting the world economy and causing social disruption.        uses data-driven models for disease outbreak identification
                                         In a recent study from 2020, it was observed that the COVID-      rather than disease outbreak forecasting and the treatment of
                                         19 outbreak had a significant impact on the Italian economy,      this identification as a classification problem is a novel ap-
                                         eventually tipping it into recession. The impact of this re-      proach that we would like to introduce to this field. We com-
                                         cession fell on the financially weak population, elderly and      bine the World Development Indicators data [Bank, 2010;
                                         the working population. [Sanfelici, 2020] Learning from           Bank, ] provided by the World Bank and the disease out-
                                         our experiences, we wish to move forward and create robust        breaks data by the World Health Organization [Organization,
                                         emergency preparedness measures. Providing the authorities        ] to create a dataset. As there was a small degree of uncer-
                                         with the most vulnerable sectors which will succumb to dis-       tainty in the dataset due to missing values, we also make
                                         ease outbreaks first will be an invaluable resource for plan-     use of statistical data imputation and predictive modelling
                                         ning and policy-making. But finding these vulnerable sec-         for data treatment. Lastly, we apply benchmarked classifica-
                                         tors presents a challenge as it requires big data analysis of     tion techniques for disease outbreak identification and CART
                                         imperfect data over multiple years of history for a particu-      based feature importance to find the crucial indicators. Af-
                                         lar region. Furthermore, the vulnerable sectors cannot be         ter finding these indicators, we compare the results with for-
                                         directly quantified, thus their vulnerability needs to be esti-   mer studies and surveys to validate the performance of this
                                         mated through indirect measures. We studied such cases of         methodology. The verified indicators can be passed on to the
                                                                                                           authorities for emergency preparedness and planning assis-
                                             ∗
                                                 Equal Contributors                                        tance.
2 Background Work the quantile range and is insensitive to outliers. A number
Due to the recent rise of disease outbreaks, the research com- of other scaling techniques like Min-Max scaler, Standard
munity is laying special emphasis on studying epidemiology. scaler and our in-house Logarithmic Deviation scaler were
Researchers have found correlation of time-series data trends also tried, but gave substandard results.
with the presence of disease outbreaks [Richardson et al., The severely skewed class distribution observed in our
2016; Li et al., 2012] and have also found causal relationships dataset posed a challenge for the classification algorithms.
between socio-cultural systems [Davis et al., 2019]. [Far- Both undersampling and oversampling have known disadvan-
rington and Beale, 1998] worked extensively to model these tages. Undersampling can throw away potentially useful data,
outbreaks and predict them. The case-study of Salmonella and oversampling can increase the likelihood of overfitting.
agona in their paper highlighted both the potential and the Hence, a combination of both Undersampling and Oversam-
shortcomings of automated detection procedures, emphasis- pling was used. SMOTE is an oversampling technique that
ing both their time optimization and less perceptible results. synthesizes new plausible examples of the minority class by
[Heisterkamp et al., 2006] tried another approach, using hi- interpolating between several minority class examples that lie
erarchical time series analysis model to detect outbreaks and together. Tomek Links refers to an undersampling technique
found the proposed model to be a reliable tool for Rubella that identifies cross-class nearest neighbors and removes the
notifications and Salmonella infections. [Streftaris and Gib- majority class occurrence. [Batista et al., 2003]
son, 2004] considered continuous-time stochastic compart-
mental models that can be applied in veterinary epidemiol- 4 Methodology
ogy to model the within-herd dynamics of infectious diseases. 4.1 Data Imputation
[Stroup et al., 1993] introduced a statistical method for detec-
We employed a number of statistical and inferential data im-
tion of specific types of aberrations in public health surveil-
putation techniques ranging from simple statistic substitution
lance.
to complex deep learning based imputation techniques. The
[Rohwerder, 2020] summarised the work of multiple au-
techniques that gave us noteworthy results are explained be-
thors in an attempt to identify the secondary impacts of these low.
disease outbreaks in certain countries. They analyse the eco-
nomic, political, social and secondary impacts of the out- KNN imputation
breaks, unlike the traditional healthcare impacts and found The K-Nearest Neighbors algorithm is used to map a point
some common features among the countries struck by out- with its k closest neighbors in a multi-dimensional space. The
breaks. We were inspired by these results and wondered if intuition behind using KNN for data imputation is that a miss-
one methodology, applied on single or multiple datasets could ing input variable value can be approximated by the value of
reproduce these findings in sufficiently timely fashion to al- the points that are closest to it, and this ‘closeness’ can be
low interventions to take place. While most studies are trying determined on the basis of other non-missing variables. In
to identify the impact of disease outbreaks using statistical our dataset, the missing World Development Indicator val-
modelling, few try to analyse this problem in a reverse man- ues are imputed using this ’closeness’, which is usually seen
ner, i.e. socio-economic indicators that could be associated in groups of countries having similar indicator values, or the
with the occurrence of a disease outbreak. The directional- countries that have had similar development curves in differ-
ity of this indicator-outbreak network has been considered ent time frames. After experimenting with a number of pa-
a problem too vast for any single study, something that we rameters, the best results were obtained when a combination
agree with but look forward to solving. In 2011 however, of 5 neighbors and euclidean distance (1) was used.
[Unkel et al., 2012] discussed a wide variety of techniques, v
their possible limitations and advantages from regression to u n
uX 2
ARIMA models to Markov models for the identification of d (p, q) = t (qi − pi ) (1)
unusual patterns in data which may result from infectious dis- i=1
ease outbreaks. This study provided a base for our methodol-
ogy. Stochastic Multiple Regression Imputation
The intuition behind the MSREG algorithm is to leverage
the correlation between the input variables by regressing the
3 Data Description and Creation missing variable on all the other input variables. We employ
World Development Indicators (WDI) is the primary World the Linear Regression Model to estimate the missing values.
Bank collection of 143 development indicators for more than For example, in our dataset there is a strong positive corre-
200 economies and 40 country groups. The part of the lation between the “Number of Community Health Workers”
database that we considered spans from the year 2000 - 2019. and the “Current health expenditure” columns. The MSREG
[Bank, ] The disease outbreak data from WHO was extracted algorithm is capable of utilizing such correlations in order to
separately for individual countries. [Organization, ] The impute the missing variable values.
years that had a disease outbreak occurrence/absence were To counter the decrease in the inherent variability of the
labelled as 1/0 respectively. imputed variable, normally distributed noise with a mean of
The basic preprocessing involved encoding categorical fea- zero and variance equal to the standard error of regression
tures, scaling, normalization and resampling. Robust Scaler estimates was introduced. The MSREG method assigns val-
was utilized for scaling, since it scales the data according to ues to each missing element x according to (2), where k isFigure 1: Feature importance top covariates
the number of manifest variables used in a model, N is the where p(t) is the proportion Nt /N of samples reaching t
number of missing values in x, and Srandn() is a function and v(st ) is the variable used in split st . When using the
that returns a different element of a standardized normally Gini index as an impurity function, this measure is known as
distributed random column vector each time it is invoked. the Gini importance or Mean Decrease Gini. [Louppe et al.,
[Kock, 2014] 2013]
k
X q 5 Results
ẋir = β̂xi xj + ( (1 − β̂xi xj Σ̂xi xj )Srandn() (2)
The identification of important features from the imputed
j=1
dataset was accomplished through the use of benchmarked
where j = 1...k, j 6= i, r = 1...N classification techniques to predict the target variable y,
which in our case is the disease outbreak occurrence in a
Random (Additive Noise) Imputation particular year. We applied these techniques to our dataset
This method allows imputation of the missing data by picking with a 0.2 train-test-split, and compared 3 different methods
random observed values of a particular variable. This method of imputation: KNN, Random Imputation and MSREG. Af-
was applied on all features with missing data, by selecting ter analysing the F1-score and the accuracy, hyperparameter
random variables with the probability of an imputation being optimization was performed to boost our results. This was
1/n where n is the number of present values. followed by the usage of the CART based feature selection
technique to determine the important features.
4.2 Feature Importance
Classification: A wide range of state-of-the-art classifica-
Conventionally Feature Selection has always been used to
tion techniques were employed including Bayesian, Tree-
identify the relevant set of features for which there is a sig-
based, Ensemble and Deep Learning Algorithms [1].
nificant increase in the performance of the algorithm. But we
attempt to utilize it in an unorthodox fashion. The promising Feature selection: We applied feature selection for filter-
classification scores [1] do show that there is a strong correla- ing out the input variables strongly correlated with disease
tion between the World Development Indicators and Disease outbreak occurrence. By plotting the relative importance of
Outbreaks. But the crucial question would be to discover the these covariates, we can increase the interpretability of this
set of unapparent Indicators which get affected by Disease pipeline, and thus deliver the vulnerable indicators as our fi-
Outbreaks and understand them better, for which we use Fea- nal result [1].
ture Selection.
RandomForestClassifier’s implicit feature selection was 6 Synopsis
used to determine the subset of relevant features. For ran-
domized trees’ ensembles, the variable importance Xm for The results were very promising on the imperfect data clas-
predicting Y is calculated by adding up the weighted impu- sification as we achieved 94.2% top accuracy and a F1-Score
rity decreases p(t)∆i(st, t) for all nodes t where Xm is used, of 0.94 on the dataset using the Random Forest algorithm,
averaged over all NT trees in the forest (3). MSREG imputation and SMOTE Sampling after hyperpa-
rameter tuning. The ensemble techniques performed better
than both the regression and the deep learning models. We
1 X X
Imp(Xm ) = p(t)∆i(st , t) (3) were able to extract the most important features that the algo-
NT rithm predicted [1].
T tT ;v(st )=XmTable 1: Results of classification algorithms on the three imputed datasets
Algorithms KNN Random MSREG
F1 Accuracy F1 Accuracy F1 Accuracy
LGBM Classifier 0.934 0.934 0.918 0.918 0.935 0.935
RandomForest 0.930 0.930 0.940 0.940 0.942 0.942
BaggingClassifier 0.906 0.906 0.906 0.906 0.913 0.914
DecisionTreeClassifier 0.832 0.832 0.808 0.808 0.816 0.817
ANN 1 Relu , 1 Sigmoid layer 0.810 0.743 0.780 0.808 0.780 0.799
AdaboostClassifiier 0.799 0.799 0.835 0.835 0.812 0.812
VotingClassifier 0.789 0.790 0.780 0.780 0.786 0.786
ANN 3 Relu , 1 Sigmoid layer 0.780 0.824 0.780 0.800 0.770 0.808
Autoencoder + Logistic Reg. 0.760 0.832 0.780 0.811 0.760 0.829
Autoencoder + Logistic Reg. 0.760 0.834 0.790 0.817 0.760 0.831
GaussianNB 0.644 0.652 0.654 0.662 0.575 0.609
SVC 0.580 0.570 0.570 0.523 0.490 0.540
SGDClassifier 0.546 0.608 0.586 0.617 0.786 0.851
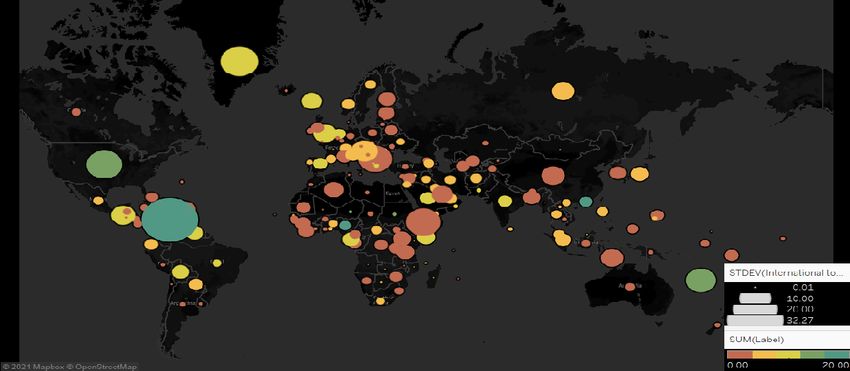
To interpret our results better, we visualised the frequency and Takeo Tadono. Spatiotemporal dengue fever hotspots
of disease outbreaks per country with one of the more impor- associated with climatic factors in taiwan including out-
tant predicted features- Number of International tourism, ex- break predictions based on machine-learning. Geospatial
penditures (current US$), and observed that the two variables Health, 14(2), 2019.
were indeed correlated [2]. It is interesting to note how our [Bank, ] World Bank. World development indicators. Ac-
observations match the results put forward by [Rohwerder, cessed Feb. 14, 2021.
2020], where they found the above features to be strongly af-
fected by disease outbreaks in low and middle income coun- [Bank, 2010] World Bank. World development indicators
tries through a different methodology and dataset. 2010. The World Bank, 2010.
[Batista et al., 2003] Gustavo EAPA Batista, Ana LC Baz-
7 Conclusion and Future Work zan, Maria Carolina Monard, et al. Balancing training data
The dire impact of disease outbreaks are unequivocally faced for automated annotation of keywords: a case study. In
by the most vulnerable populations, the healthcare workers WOB, pages 10–18, 2003.
and the financially disadvantaged, and our insights could help [Dauda, 2019] Rasaki Stephen Dauda. Hiv/aids and eco-
the authorities increase the accessibility of social services. nomic growth: Evidence from west africa. The In-
Our proposed method leverages data-driven models and fea- ternational journal of health planning and management,
ture selection for the quick identification of the affected in- 34(1):324–337, 2019.
dicators, giving the vulnerable sectors. The results on the [Davis et al., 2019] Paul K Davis, Angela O’Mahony, and
imputed datasets, while indicative of potential relationships, Jonathan Pfautz. Social-Behavioral Modeling for Complex
cannot tell the whole story on their own. Many critical vari- Systems. John Wiley & Sons, 2019.
ables (e.g. competing political priorities, cultural narratives
etc.) cannot be completely captured in a large scale analysis, [Farrington and Beale, 1998] CP Farrington and AD Beale.
and can be found by comparing public opinion and conflict- The detection of outbreaks of infectious disease. In Ge-
related casualties. In the future work, these insights can con- omed’97, pages 97–117. Springer, 1998.
tribute to forming prior knowledge for a knowledge-driven [Farrington et al., 1996] CP Farrington, Nick J Andrews,
model, providing concrete parameters to help assess and vali- AD Beale, and MA Catchpole. A statistical algorithm for
date the theoretical framework. Our team has also conducted the early detection of outbreaks of infectious disease. Jour-
a study parallel to this work that builds on the dataset and nal of the Royal Statistical Society: Series A (Statistics in
analyzes causal relationships between the features [Marathe Society), 159(3):547–563, 1996.
et al., 2021].This research will be useful in the emergency [Heisterkamp et al., 2006] Simon H Heisterkamp,
preparedness planning for the developing world.
Arnold LM Dekkers, and Janneke CM Heijne. Au-
tomated detection of infectious disease outbreaks:
References hierarchical time series models. Statistics in Medicine,
[Allard, 1998] Rbc Allard. Use of time-series analysis in in- 25(24):4179–4196, 2006.
fectious disease surveillance. Bulletin of the World Health [Kalibala et al., 2012] Samuel Kalibala, Katie D Schenk,
Organization, 76(4):327, 1998. Deborah C Weiss, and Lynne Elson. Examining dimen-
[Anno et al., 2019] Sumiko Anno, Takeshi Hara, Hiroki Kai, sions of vulnerability among children in uganda. Psychol-
Ming-An Lee, Yi Chang, Kei Oyoshi, Yousei Mizukami, ogy, health & medicine, 17(3):295–310, 2012.Figure 2: Standard deviation of normalised number of International tourism, expenditures (current US$) with the frequency of disease
outbreaks per country
[Kock, 2014] Ned Kock. Single missing data imputation in [Novakovic and Veljovic, 2011] J Novakovic and
pls-sem. Lar. Tex. Scr. Syst, 2014. A Veljovic. C-support vector classification: Selec-
tion of kernel and parameters in medical diagnosis. In
[Kuang et al., 2012] Jie Kuang, Wei Zhong Yang, Ding Lun
2011 IEEE 9th international symposium on intelligent
Zhou, Zhong Jie Li, and Ya Jia Lan. Epidemic features af-
systems and informatics, pages 465–470. IEEE, 2011.
fecting the performance of outbreak detection algorithms.
BMC Public Health, 12(1):1–9, 2012. [Organization, ] World Health Organization. Disease out-
breaks by countries, territories and areas. Accessed Feb.
[Li et al., 2012] Zhongjie Li, Shengjie Lai, David L Buck- 14, 2021.
eridge, Honglong Zhang, Yajia Lan, and Weizhong Yang.
Adjusting outbreak detection algorithms for surveillance [Richardson et al., 2016] Eugene T Richardson, Mo-
during epidemic and non-epidemic periods. Journal of the hamed Bailor Barrie, J Daniel Kelly, Yusupha Dibba,
American Medical Informatics Association, 19(e1):e51– Songor Koedoyoma, and Paul E Farmer. Biosocial
e53, 2012. approaches to the 2013-2016 ebola pandemic. Health and
human rights, 18(1):115, 2016.
[Li, 2018] Marie Li. Missing value estimation algorithms on
[Rohwerder, 2020] Brigitte Rohwerder. Secondary impacts
cluster and representativeness preservation of gene expres-
sion microarray data. arXiv preprint arXiv:1809.05969, of major disease outbreaks in low-and middle income
2018. countries. 2020.
[Sahri et al., 2014] Zahriah Binti Sahri, Univer-
[Lieberman, 2007] Evan S Lieberman. Ethnic politics, risk,
siti Tekonologi Malaysia, et al. Support vector
and policy-making: A cross-national statistical analysis of machine-based fault diagnosis of power transformer
government responses to hiv/aids. Comparative political using k nearest-neighbor imputed dga dataset. Journal of
studies, 40(12):1407–1432, 2007. Computer and Communications, 2(09):22, 2014.
[Louppe et al., 2013] Gilles Louppe, Louis Wehenkel, An- [Saiya and Scime, 2019] Nilay Saiya and Anthony Scime.
tonio Sutera, and Pierre Geurts. Understanding variable Comparing classification trees to discern patterns of terror-
importances in forests of randomized trees. Advances in ism. Social Science Quarterly, 100(4):1420–1444, 2019.
neural information processing systems 26, 2013.
[Sanfelici, 2020] Mara Sanfelici. The italian response to the
[Lu et al., 2009] Hsin-Min Lu, Daniel Zeng, and Hsinchun covid-19 crisis: Lessons learned and future direction in
Chen. Prospective infectious disease outbreak detection social development. The International Journal of Commu-
using markov switching models. IEEE Transactions on nity and Social Development, 2(2):191–210, 2020.
Knowledge and Data Engineering, 22(4):565–577, 2009.
[Sawers et al., 2008] Larry Sawers, Eileen Stillwaggon, and
[Marathe et al., 2021] Aboli Marathe, Saloni Parekh, and Tom Hertz. Cofactor infections and hiv epidemics in de-
Harsh Sakhrani. Modelling major disease outbreaks in the veloping countries: implications for treatment. AIDS care,
21st century: A causal approach. 2021. 20(4):488–494, 2008.[Streftaris and Gibson, 2004] George Streftaris and Gavin J Gibson. Bayesian inference for stochastic epidemics in closed populations. Statistical Modelling, 4(1):63–75, 2004. [Stroup et al., 1993] Donna F Stroup, Melinda Wharton, Karen Kafadar, and Andrew G Dean. Evaluation of a method for detecting aberrations in public health surveillance data. American journal of epidemiology, 137(3):373–380, 1993. [Ukpolo, 2004] Victor Ukpolo. Aids epidemic and economic growth: testing for causality. Journal of Asian and African Studies, 39(3):169–178, 2004. [Unkel et al., 2012] Steffen Unkel, C Paddy Farrington, Paul H Garthwaite, Chris Robertson, and Nick Andrews. Statistical methods for the prospective detection of infec- tious disease outbreaks: a review. Journal of the Royal Sta- tistical Society: Series A (Statistics in Society), 175(1):49– 82, 2012. [Vogli et al., 2014] Roberto De Vogli, Anne Kouvonen, Marko Elovainio, and Michael Marmot. Economic global- ization, inequality and body mass index: a cross-national analysis of 127 countries. Critical Public Health, 24(1):7– 21, 2014.
You can also read