Introduction to Augmented Emission Maps - 19 May 2021 Norbert Ligterink, Jessica de Ruiter - Project ucare
←
→
Page content transcription
If your browser does not render page correctly, please read the page content below

Introduction to Augmented Emission Maps
                    19 May 2021
         Norbert Ligterink, Jessica de Ruiter
Agenda

• Introduction to AEMs
• Break
• Insights and augmentations
• Discussion on your applications of AEMs

19-05-2021                      GA 815002   2

Workshop Goals

• You can make your own emission estimates based on measurement
  data
• You can use and compare data from different vehicles
• You can investigate specific questions regarding the relationship
  between driving behaviour, vehicle use, and emissions
• You know where to find the large amount of data already available
• You can be part of, and contribute to, the uCARe community

19-05-2021                      GA 815002                             3

Augmented Emission Maps are a standard to publish
and share detailed emission measurement data
The vision of uCARe: sharing emission measurement data at a detailed level is important for scientific insight
and individualised advice for consumers

              Measure                                AEMs                                   Analyse

                                                                                            Predictions

             Vehicle
                                                                                                    Insights
                    Driver
                  behaviour
                                                                                               Advice

19-05-2021                                          GA 815002                                                    4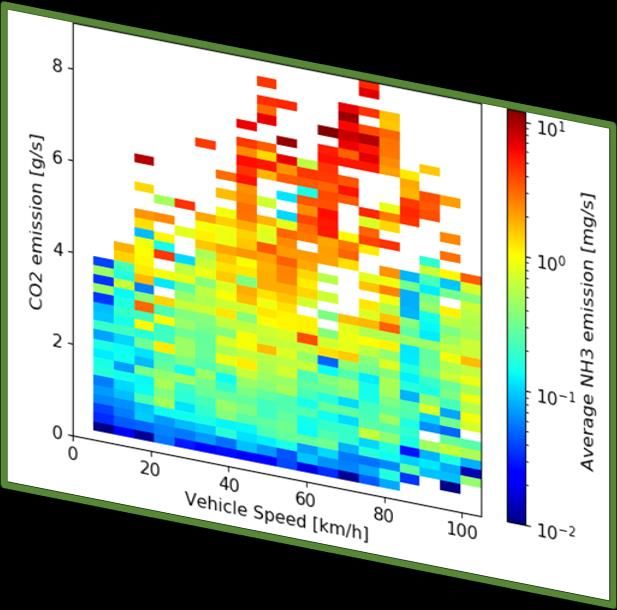
AEMs are much more detailed than generalised
emission factors

Diesel Euro 6 emission factors              AEMs
Per road type averaged over all use and     Detail the relationship between vehicle,
vehicles                                    driver behaviour and emissions

    Urban      Rural    Motorway

    0.428      0.344      0.410
  g/km NOx   g/km NOx   g/km NOx

19-05-2021                            GA 815002                                        5
More detailed emission data leads to more detailed
insights
Current motorway emission factors would       Using detailed emission data (and vehicle
assign the same emissions to this stretch     behaviour) shows localised variations in
of road                                       emissions

19-05-2021                              GA 815002                                         6
The vehicle taxonomy: a common language to
characterise passenger cars
A method of categorising vehicles, dependent on the main (technical) properties.

Allows for cross-organisation and cross-project comparison and communication
   • CARES, MILE21, GVI
Consists of
   • A vehicle code, and
   • An engine code
Especially useful in cases where a base vehicle and engine are used by different manufacturers
   • E.g. Peugeot 107, Citroen C1, and Toyota Aygo

19-05-2021                                           GA 815002                                   7
The right AEM can be found using the vehicle
   taxonomy
   First three levels of Vehicle Code                                    Engine Code
   • Vehicle code also includes AWD capability and                            Fuel    Euro standard   Engine size   Engine power   Alliance code

     battery capacity                 Manual
                                      Niro
                                                 DCT
                            Kia
                                                Manual                                 Euro 5         898 cc         66 kW           RNM
                                    Sportage                                                          898 cc         66 kW          RNM3
                                               Automatic
                                                                   ICE      Petrol                                                   HYUN
                                      Leaf      1 speed                                               998 cc         74 kw
                           Nissan                                                                                                    FORD
            All vehicles                        Manual
                                     Micra
                                                                                       Euro 6                        45 kW          RNM3
                                               Automatic                                              999 cc
                                                                                                                     52 kW          RNM3
                                                Manual
                                    Fortwo                                                                           92 kW            VAG
                                                 DCT                                                  1395 cc
                           Smart
                                                                                                                    110 kW            VAG
                                                Manual
                                    Forfour
                                                 DCT                                 Alliance codes distinguish collaborations or
DCT=dual clutch transmission                                                         engines with the same specs, but different
   19-05-2021                                              GA 815002                 manufacturers                        8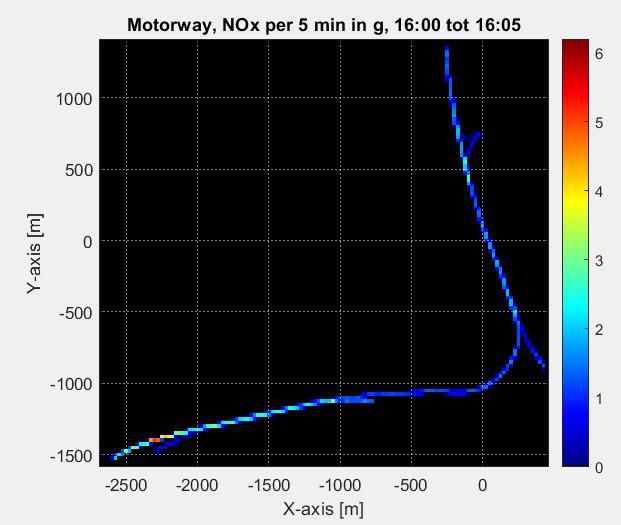
AEMs can be vehicle-specific or on a more general
level

Vehicle specific codes                     Fallback codes (more generalised)
• P_5_898_66_RNM,                          • D_4_ALL_ALL_ALL
• D_6dT_1969_140_VOLV                      • D_6dT_ALL_ALL_ALL
• E--P_6b_1798_73_TOYO                     • P_6_ALL_ALL_ALL
• C--P_6_1395_81_VAG                       • P_6_898-999_ALL_RNM3

• 2 994 identified in uCARe data           Allows for ranges as well as generalisations

• 27 210 identified in Dutch fleet        Taxonomy code generator updated as new
                                          vehicles come to market
19-05-2021                           GA 815002                                            9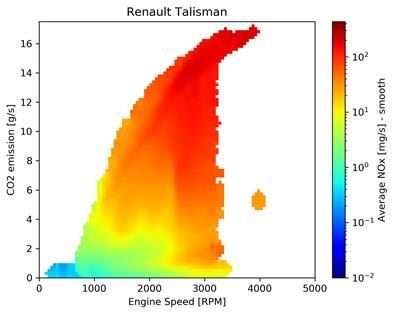
Using the different layers within an AEM, analysis
can be tailored to a specific vehicle and behaviour.

19-05-2021                  GA 815002                  10
Base maps

Base maps document hot
tailpipe emissions based on
CO2 and either RPM or vehicle
speed

                          ~power
                                      +/-20kW

                                                ~speed or selected gear
19-05-2021                         GA 815002                              11
Base maps
Base maps document hot
tailpipe emissions based on
CO2 and either RPM or vehicle
speed
CO2 is a proxy for power
• Accounts for variations in use ~power
e.g. head wind, going uphill +/-20kW
~speed or selected gear
19-05-2021 GA 815002 12CO2 is used as an input signal for AEMs
• CO2 input incorporates vehicle • CO2 signal availability
use aspects • 5 – 10 % accuracy is easy to obtain
• Rolling resistance • Different CO2 signals can be used
• Weight • On-board fuel meter
• Ambient temperature • Using power relation (velocity and
• Slope acceleration)
• Eco/sportive driving • Modelling from first principles
• Measurements
• Fuel flow or exhaust flow
19-05-2021 GA 815002 13Base maps Base maps document hot tailpipe emissions based on CO2 and either RPM or vehicle speed NOx (for example) can then be estimated throughout a trip 19-05-2021 GA 815002 14
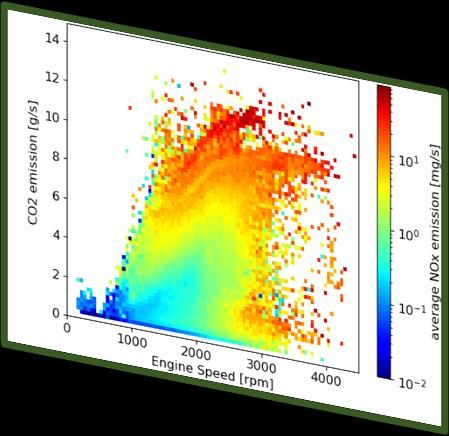
Base maps can have different resolutions
depending on the amount of data available
       P_6dT_998_74_FORD – 18.4 hours                       P_6b_999_70_VAG – 4.6 hours

• Flexible bin sizes dependent on data availability
• Pollutant map dependent on either RPM or vehicle speed, and CO2
• Python script available, to make your own maps from data
19-05-2021                                      GA 815002                                 15
Comparison: the same engine pre/post diesel gate
MY 2018 MY 2015
19-05-2021 GA 815002 16Why do base maps have this form? • Dependent variables are typically well-known and can be measured • Emissions show a strong correlation with these dependent variables • Large variations in emissions remain unexplained • This reinforces the importance of collecting sufficient real-world data to cover a larger area of the AEM 19-05-2021 GA 815002 17
Base maps are representative of the data that is
used to make them
How accurate are base maps?
• Strict separation of data and interpretation
• Metadata and indications of data spread are included to give an
  indication of statistical significance
      • Notes, number of vehicles, amount of data, average mileages
      • Per bin/data point: count/observations, standard deviation, 25th and 75th
        quantile

There are a broad range of uncertainties
      • Emissions can be highly unpredictable

19-05-2021                               GA 815002                                  18
After the break • Insights from AEMs • Non-regulated pollutants • Augmentation layers • Available tools 19-05-2021 GA 815002 19
Insights from AEMs I: Low-CO2 driving is not
necessarily equivalent to low-NOx driving
Euro 5 diesel vehicles have
high NOx emissions.

CO2 eco-driving instruction:
                                                2nd gear
high gear driving at low engine                3rd gear
speeds (~1500 RPM).                            4th gear

                                               5th gear
Low NOx instruction is to
retain a slightly lower gear, in
particular when accelerating.
                                               Low CO2     Low NOx

19-05-2021                         GA 815002                         20
Insights from AEMs II: Certain driving conditions
have much lower relative emissions
AEMs can be used to show
optimisations and weak spots in
the emission control strategy
For this Euro 6 diesel vehicle,
driving at speeds above 100 km/h
leads to higher NOx
Low NOx
19-05-2021 GA 815002 21Base maps are also available (where measured) for other and non-regulated pollutants. Carbon monoxide Ammonia 19-05-2021 GA 815002 22
Augmentation layers can be used to further specify
emissions
Currently two augmentations are
available
• Cold start
      • Cold start extra emissions due to
        driving with a cold engine
• Deterioration
      • Scaling emissions due to the effect
        of aging on a vehicle

19-05-2021                                  GA 815002   23
Augmentation: Cold start
• Unlike the emission base map, cold start
Cold start extra emissions are time-dependent
• Augmentation in the form of a formula
• Time-dependent
• Formula requires a number of vehicle-
formula
dependent parameters
• Vehicle-dependent
• Fallback parameters have been generated and
and fallback are available in AEM form
parameters
• Can estimate the extra emissions for trip
sequences, or driver behaviour at the start
19-05-2021 GA 815002 24Insights from AEMs III: Re-ordering trips can lead to
lower emissions
• Cold start extra emissions can be estimated depending on trip
characteristics
• The order of the segments in a segmented trip can significantly
influence total cold start extra emissions
• Decrease of over 20% if the long segment is driven first
19-05-2021 GA 815002 25Augmentation: Deterioration
• Investigated formula vs. scaling factor
Deterioration approach
• CONOX/HBEFA deterioration factors used
• Dependent on
scaling factors • Deterioration factors used to scale entire
• CONOX/HBEFA base map
50 000 → 300 000
× 3.00
19-05-2021 GA 815002 26AEMs are shared via a text file format that is
human-readable
• File format allows for
concatenation of multiple
maps/augmentations
• A formal explanation of
the map.txt file is
documented in Backus-
Naur form
19-05-2021 GA 815002 27Three tools are available to assist in map selection
• Base maps available for a many common engines
• Many different engine types (taxonomy codes) in the European fleet; order
of magnitude: 22,000 (based on Dutch fleet)
• Three tools developed to help tool-builders:
• Fallback maps.
• One map based on joint data of all vehicles of a certain fuel/Euro standard.
• Selection tool.
• Sophisticated tool that analyses and characterises available maps, and proposes the best
suitable map for any given engine. Differences in emission behaviour related to engine size,
power, and make/alliance are accounted for.
• Combining tool.
• Combines base maps with matching taxonomy code from different sources (e.g. same engine
measured on dyno and with PEMS).
19-05-2021 GA 815002 28Discussion/questions • How can the additional detail in AEMs help you? • How/where will you implement AEMs? • What kind of other applications can you imagine for AEMs? • … 19-05-2021 GA 815002 29
Why use AEMs?

                    Fact-based     • AEMs contain only measurement data-backed values

                                   • Data is freely available via the OpenAire platform Zenodo to which new data can and will
               Freely-available
                                     continually be added as new measurements become available.

                                   • AEMs can be vehicle-specific or generalised, depending on data availability and
 Vehicle-specific or generalised
                                     application

                                   • Via AEMs and their surrounding framework, we facilitate easy data sharing of emission
              Easy data sharing
                                     measurements.

                                   • The accuracy and applicability of AEMs is ensured via the significant amount of data that
     Significant amount of data      is used to generate each map, which is noted in kilometres and hours in the metadata of
                                     each map.

                                   • The ready availability of vehicle-specific and generalised AEMs, as well as the supporting
              Readily available
                                     tools, make this a solution that is ready for tool-builders and researchers to implement.

                                   • Emission data can be shared in the form of maps dependent on any two variables, or in
                        Flexible     the form of a function. This allows for easy integration of new pollutants and
                                     relationships as they become available.

19-05-2021                                            GA 815002                                                              30
Useful links
• uCARe deliverables
• Taxonomy code generator v1.5
• D1.2 “Augmented emission maps are an essential new tool to share and
investigate detailed emission data”
• Zenodo uCARe community
• GitHub
• Intro to AEMs on YouTube
19-05-2021 GA 815002 31Consortium partners:
You can also read