Influence of Selected Ophthalmic Fluids on the Wettability and Hydration of Hydrogel and Silicone Hydrogel Contact Lenses-In Vitro Study - MDPI
←
→
Page content transcription
If your browser does not render page correctly, please read the page content below

materials
Article
Influence of Selected Ophthalmic Fluids on the Wettability and
Hydration of Hydrogel and Silicone Hydrogel Contact
Lenses—In Vitro Study
Gabriela Chwalik-Pilszyk *                 and Anna Wiśniewska *

                                          Department of Applied Mechanics and Biomechanics, Faculty of Mechanical Engineering,
                                          Tadeusz Kosciuszko Cracow University of Technology, 37 Jana Pawla II Av., 31-864 Cracow, Poland
                                          * Correspondence: gabriela.chwalik@pk.edu.pl (G.C.-P.); anna.wisniewska1@pk.edu.pl (A.W.)

                                          Abstract: This study attempts to evaluate the effect of incubation in selected ophthalmic fluids on
                                          contact lenses (Etafilcon A, Omafilcon A, Narafilcon A, Senofilcon A). Four research groups differing
                                          in the incubation environment were created: (1) initial state, (2) contact lens solution (CLS), (3) contact
                                          lens solution and eye drops (ED) and (4) eye drops. Dehydration by gravimetric method and the
                                          contact angle (CA) by the sessile drop method were tested. The surface free energy (SFE) was also
                                          calculated with the use of several methods: Owens–Wendt, Wu, Neumann, and Neumann–Kwok.
                                          The greatest changes in the dehydration profile were observed for contact lenses incubated in ED.
                                          The most noticeable changes in CA values were observed for contact lenses incubated in ED, in which
                                          it was not possible to settle water drop after incubation. On the basis of SFE analysis, higher values
                                          were found for hydrogel contact lenses, e.g., according to the Owens–Wendt method, they ranged
                                          from 54.45 ± 6.56 mJ/m2 to 58.09 ± 4.86 mJ/m2 , while in the case of silicone-hydrogel contact lenses,

                                   they ranged from 32.86 ± 3.47 mJ/m2 to 35.33 ± 6.56 mJ/m2 . Incubation in all tested environments
Citation: Chwalik-Pilszyk, G.;            decreased the SFE values, but the differences were in most cases statistically insignificant. Calculating
Wiśniewska, A. Influence of Selected     the SFE may be a useful method as it can be used to estimate the possibility of bacteria adhering to
Ophthalmic Fluids on the Wettability      contact lens surfaces.
and Hydration of Hydrogel and
Silicone Hydrogel Contact                 Keywords: surface free energy (SFE); contact angle (CA); contact lenses; wettability; dehydration
Lenses—In Vitro Study. Materials
2022, 15, 930. https://doi.org/
10.3390/ma15030930

Academic Editors: Eleonora Russo          1. Introduction
and Xiaozhong Qu                                Many contact lens wearers complain of discomfort caused by the occurrence of dry
Received: 24 November 2021                eyes. Discomfort may also be related to factors such as protein adsorption or friction during
Accepted: 20 January 2022                 blinking, especially between the front side of the lens and the inner eyelid [1–3]. Dry eye
Published: 25 January 2022                symptoms are reported by approximately 50% of contact lens wearers, and 25% of patients
                                          drop out of contact lenses because of dry eye complications [1,2,4–9]. Currently, the main
Publisher’s Note: MDPI stays neutral
                                          factors influencing the development of materials used in the production of contact lenses
with regard to jurisdictional claims in
                                          are the need to increase the comfort [10].
published maps and institutional affil-
                                                Some studies show that dry eye symptoms can be better characterized as neuropathic
iations.
                                          eye pain [11,12]. According to McMonnies [12], some cases of contact lens intolerance
                                          may be due to eyelid wiper neuropathy. A stagnant post-lens tear pool with the possible
                                          increased concentrations of metabolic by-products, cellular debris, and bacterial exotoxins
Copyright: © 2022 by the authors.         can disrupt the corneal epithelial and sub-basal nerves. The study of Situ et al. [13] shows
Licensee MDPI, Basel, Switzerland.        that one effect of wearing contact lenses was to alter the functioning of the sensory nerves
This article is an open access article    of the ocular surface, which is reflected in response to stimulation of the cornea and
distributed under the terms and           conjunctiva. According to Murphy et al. [14], there is a significant reduction in corneal
conditions of the Creative Commons        sensitivity between contact lens wearers and non-lens wearers, with the degree of loss of
Attribution (CC BY) license (https://     sensitivity not related to the duration of contact lens wear and appearing to stabilize after
creativecommons.org/licenses/by/          the first few months of wearing.
4.0/).

Materials 2022, 15, 930. https://doi.org/10.3390/ma15030930                                                https://www.mdpi.com/journal/materials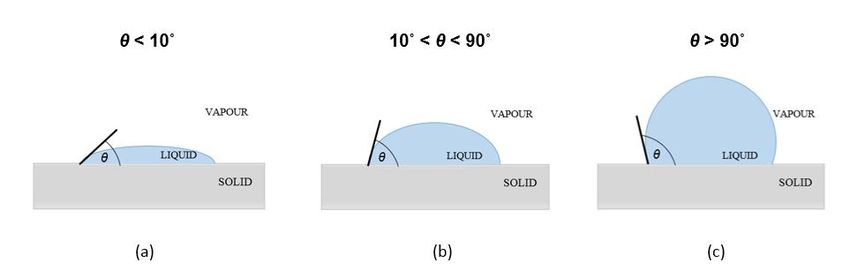
Materials 2022, 15, 930                                                                                            2 of 18

                                During wearing contact lenses, alternating air drying (open eye) and rehydration
                          (closing the eye when blinking) cause the lens dehydration [15]. The interaction between
                          the contact lens and the cornea significantly affects the biocompatibility of the lens [16].
                          Dehydration of the contact lens can cause discomfort because the water molecules attached
                          to the lens surface reduce friction, preventing eye irritation [10]. Additionally, it can alter
                          some important properties such as radius of curvature, thickness, oxygen permeability [17],
                          and surface wettability [2,9,18,19]. Many factors affect the rate of dehydration, including the
                          environment [20–23], water content [21,24], water binding properties [25,26], thickness [27],
                          surfactant use [28], and contact lens time of wear [29].
                                According to Jones et al. [8], environmental conditions have a significant influence on
                          the dehydration of the contact lenses. In vitro studies have shown that higher airflow has
                          a greater influence on the dehydration rate (DR) than its humidity [8]. Note that in vitro
                          dehydration differs significantly from in vivo dehydration via other mechanisms [29] and
                          due to external factors such as temperature, osmolarity, pH, etc. [30].
                                The DR varies depending on the contact lens material and affects wearer comfort [28,31].
                          The interaction between the polymer chains and water influences the physical properties
                          of the hydrated lens system [32]. The hydrated state of a hydrogel contact lens is created
                          by the interaction of polymer chains with water molecules. The structure and physical
                          properties of these materials are thus a result of the existence of water binding sites in the
                          polymer and the geometric constraints [33]. González-Méijome et al. [30] observed that
                          HEMA-based contact lenses dehydrate to a greater extent and faster than silicone hydrogel
                          materials. This is consistent with the research of Martín-Montañez et al. [34], in which it
                          was found that silicone hydrogel contact lenses (Balafilcon A, Lotrafilcon B, Senofilcon A)
                          have a longer stabilization time, which indicates that these materials might have higher
                          ability to avoid dehydration.
                                Krysztofiak [32] distinguishes three phases of contact lens dehydration, differing in
                          terms of the DR: The dehydration rate in phase I is the most intense; phase II usually lasts
                          the same time regardless of the type of contact lens. The duration of phase III depends on
                          whether in vitro or in vivo tests are being conducted [32].
                                To reduce dryness and irritation, eye drops (ED) are recommended. It is the first-line
                          treatment for dry eye symptoms [9,35]. Approximately 20% of contact lens wearers use
                          ED to relieve discomfort [36]. Most eye drops contain sodium hyaluronate as the main
                          lubricant and soothing agent [6,9]. Hyaluronic acid (HA) is a linear biopolysaccharide
                          with exceptional hygroscopic, lubricating, and viscoelastic properties [6,37]. In the eye,
                          HA protects the corneal epithelium, accelerates cell migration and wound healing [38],
                          and also has a unique ability to attract and retain water [37,39]. Studies have shown that
                          HA-containing drops have a positive effect on the treatment of dry eye symptoms [39–41].
                          However, contact lens wear discomfort and dryness are still unsolved issues for a large
                          number of wearers as these wetting agents only have a temporary effect on lubricity [7].
                                Surface wettability is essential for the physiological compatibility between the contact
                          lens and the eye as normal corneal hydration is disrupted by the insertion of the contact
                          lens [28]. Wettability can be assessed by contact angle (CA) measurements (Figure 1).
                          Analysis of CA can be used to calculate the surface free energy (SFE), affording information
                          about the character of a surface [42,43]. The surface is considered hydrophilic when the
                          value of water contact angle is less than 90◦ [44].
                                The overall trend suggests that a decrease in CA correlates with a decrease in the
                          friction coefficient [7]. Obtaining the hydrophilic surface in the contact lens is essential in
                          terms of comfort and security, which is related to lens dehydration and the accumulation of
                          the deposits [45,46]. Results obtained by Giraldez et al. [47] suggest that more hydrophobic
                          contact lenses are more prone to S. epidermidis adhesion. According to Yu et al. [7], the use
                          of hydrophilic polymers enhances the wearing comfort of the contact lens due to better
                          wettability. This modification can improve lubricity [48]. Low surface tension reduces
                          protein adsorption from body fluids, which prevents inflammation [32].
Materials 2022, 15, 930                                                                                                               3 of 18

                                  Figure 1. Different cases of liquid contact angle on surfaces specifying wettability: (a) high wettability,
                                  (b) medium wettability, and (c) low wettability.

                                       This study aimed to evaluate the effect of contact lens solution (CLS) and hyaluronan
                                  eye drops on the dehydration process and the surface properties of hydrogel and silicone
                                  hydrogel contact lenses available on the market. The gravimetric method was used to
                                  assess the dehydration process. The equilibrium water content (EWC) and dehydration
                                  rate were calculated. Based on the contact angle measurements, the surface free energy was
                                  calculated which allowed to determine the character of the material’s surface.

                                  2. Materials and Methods
                                  2.1. Contact Lenses
                                       Four commercial contact lenses materials were tested: hydrogel (Etafilcon A, Omafil-
                                  con A) and silicone hydrogel (Narafilcon A, Senofilcon A) which were characterized in
                                  Table 1. To avoid the influence of the differences in contact lens thickness on the dehydration
                                  result, all the lenses used were −2.50 D back vertex power.

                                  Table 1. Parameters and chemical composition of studied contact lenses [32,49,50].

 Material          EWC [%]   Oxygen Permeability [Dk/t]   FDA Group      Chemical Composition
 Etafilcon A       58        23.8–28                      IV             HEMA, MAA, EGDMA, TMPTMA, PVP
 Omafilcon A       60        37                           II             HEMA, PC
 Narafilcon A      46        118                          V              HEMA, mPDMS, DMA, TEGDMA, PVP, siloxane monomer
 Senofilcon A      38        103-147                      I              mPDMS, DMA, HEMA, siloxane macromere, PVP, TEGDMA
                                  HEMA—poly-2-hydroxyethyl methacrylate; MAA—methacrylic acid; EGDMA—ethylene glycol dimethacrylate;
                                  TMPTMA-trimethylolpropane trimethacrylate; PVP—polyvinylpyrrolidone; PC—phosphorylcholine; mPDMS—
                                  monofunctional polydimethylsiloxane; DMA—N,N-dimethylacrylamide; TEGDMA—tetraethyleneglycol
                                  dimethacrylate.

                                  2.2. Sample Preparation
                                       For all tests, the contact lenses were prepared using the same protocol to ensure
                                  consistent starting conditions. The contact lens was removed from the storage solution
                                  with tweezers, touching only the edges of the lens and taking care not to deposit any
                                  contamination on the material. The sample was then rinsed in saline and tested immediately
                                  or placed in the solution in which the contact lenses were incubated.
                                       Four study groups, each with 10 contact lenses, were formed. The first set was a
                                  reference group consisting of contact lenses taken directly from the package. The second
                                  group included samples incubated in the CLS with the following composition: 0.03%
                                  hydroxyalkylphosphonate, boric acid, sodium edetate, 1% poloxamine, sodium borate,
                                  sodium chloride, and 0.0001% polyaminopropyl biguanide. The third group consisted of
                                  samples incubated in the CLS, to which 50 µL ED containing trehalose (3 mg/mL) and
                                  hyaluronan (1.5 mg/mL) were added every 1 h. The fourth samples set was incubated in ED.
                                  Incubation was conducted at 37 ◦ C for 8h in the Advantage-Lab E2 oven (Advantage-Lab,
                                  Schilde, Belgium).
Materials 2022, 15, 930 4 of 18
2.3. Dehydration
The gravimetric method was used to perform a qualitative and quantitative description
of the dehydration process. The contact lenses were removed from the incubation solution
(the reference group was taken directly from the package) and then put on a convex plastic
holder. Its curvature was close to the radius of the contact lens to recreate the conditions on
the eye (only the front surface exposed to air). Gravimetric measurement was started after
placing the sample on an analytical balance (RADWAG AS 160/C/2, RADWAG, Radom,
Poland) with an accuracy of 10−4 g and the contact lens mass was recorded every minute.
Measurements were made at 23 ◦ C and 55% relative humidity. The moment when the
mass of the sample did not change for at least 5 min was assumed as the equilibrium state.
The obtained results allowed calculating the equilibrium water content (EWC) of the tested
samples using Equation (1) [51]:
( m0 − m f )
EWC = · 100% (1)
m0
where m0 is the initial sample mass and m f is the sample mass after complete dehydration.
Then dehydration rate (DR) of the material was determined according to [52]
( m t − m t −1 )
DR = (2)
mt
where mt is the sample mass at time t and mt−1 is the sample mass at time t − 1.
2.4. Wettability and Surface Free Energy (SFE)
Based on the CA tests, the wettability was assessed and the values of SFE were
determined. The measurements were carried out with a sessile drop method using an
optical goniometer (Advex Instrument, Brno-Komin, Czech Republic) connected to a
computer equipped with SeeSystem v.6.3 software (Advex Instrument, Brno-Komin, Czech
Republic). The contact lenses were placed on a rounded profile with a curvature close to
the radius of the corneal curvature and then a 0.4 µL drop of the measuring liquid was
applied using a micropipette (VITRUM/VWR, Stribrna Skalice, Czech Republic) with a
measuring range of 0.1 ÷ 0.5 µL. Disposable tips with an internal diameter of 0.5 mm were
used. To test the CA, diiodomethane (Merck, Warsaw, Poland) and distilled water (Poch,
Gliwice, Poland) were used. The values of SFE, as well as polar and dispersive components
for these liquids, are presented in Table 2.
Table 2. SFE and its components for the liquids used in contact angle experiment (mJ/m2 ) [53].
Measuring Liquid γL γL d γL p
Distilled water 72.8 21.8 51.0
Diiodomethane 50.8 50.8 0.0
The angle between a solid and a liquid droplet can be determined from the drop shape
using Young’s Equation (3):
γLV · cosθ = γSV − γSL (3)
where γLV is the SFE between liquid and vapor, θ is the measured contact angle of liquid,
γSV is the SFE between solid and vapor, and γSL is the SFE between solid and liquid
(Figure 2).
The optical goniometer captured the drop image and SeeSystem software calculated
the value of CA from it based on the width and height of the drop. There were 10 samples
in each test group. For every tested contact lens, 10 measurements were made. This gave
100 measurements for each analyzed case, on the basis of which the mean value used for
further analysis was calculated.Materials 2022, 15, 930 5 of 18
There are several methods for calculating surface free energy [53]. In this study,
selected four theories (Owens–Wendt, Wu, Neumann, and Neumann–Kwok) were used.
Figure 2. The mechanical equilibrium of the drop on a plane solid surface: γSL : SFE between solid
and liquid, γ LV : SFE between liquid and vapor, γSV : SFE between solid and vapor.
2.4.1. Owens–Wendt Method
According to the Owens–Wendt method [54], the SFE is the sum of two components:
p
the dispersive γSd and the polar γS (4),
p
γS = γSd + γS (4)
where γS —SFE of tested material, γSd —dispersive component of SFE of tested material, and
p
γS —polar component of SFE of tested material.
To calculate SFE components (dispersive and polar), it is necessary to know the values
of the contact angles measured with two liquids. Distilled water is most often used as a
polar liquid and diiodomethane as a non-polar liquid [53,55,56]. Calculating the values of
both SFE components is possible thanks to the geometric mean method (5):
1
q q
p p
(1 + cosθ )γL = γSd γdL + γS γ L (5)
2
where θ—measured contact angle, γL —SFE of measurement liquid, γSd —dispersive com-
p
ponent of SFE of tested material, γdL —dispersive component of SFE of a liquid, γS —polar
p
component of SFE of tested material, and γL —polar component of SFE of a liquid.
Due to the use of two measuring liquids, a system of two linear equations is obtained:
one equation contains the data for a polar liquid and the other one the data for a non-
polar liquid.
2.4.2. Wu Method
The Wu approach [57], similarly to the Owens–Wendt method, requires the use of two
measuring liquids. Using this method, it is also possible to calculate the value of the SFE
and its components (dispersive and polar). The Wu method is also called the harmonic
mean method because of the equation used (6):
p p
γdL γSd γ L γS
(1 + cosθ )γL = 4( + p p) (6)
γdL + γSd γ L + γS
where θ—measured contact angle, γL —SFE of measurement liquid, γdL —dispersive com-
p
ponent of SFE of a liquid, γSd —dispersive component of SFE of tested material, γL —polar
p
component of SFE of a liquid, and γS —polar component of SFE of tested material.
The presented equation is most often solved numerically. You can also find an analyti-
cal solution, presented, e.g., by Hejda et al. [58].
2.4.3. Neumann Method
Neumann and co-workers have considered the surface tension of solids from a ther-
modynamic point of view. To determine the value of the SFE, measurements of the contactMaterials 2022, 15, 930 6 of 18
angle with only one measuring liquid are used [59]. The Neumann method cannot be
applied to determine the independent polar and dispersive SFE components. Most often,
measurements are conducted using distilled water. Equation (7), that emerged from the
modification of the Berthelot hypothesis, is expressed [60] as
γS 0.5 − β1 (γL −γS )2
( ) e = 0.5(1 + cosθ ) (7)
γL
where γS —SFE of tested material, γL —SFE of measurement liquid, coefficient β 1 = 0.0001247
(determined experimentally), and θ—measured contact angle.
2.4.4. Neumann–Kwok Method
Another modification of the Berthelot hypothesis resulted in the formulation (8) of a
new equation by Neumann, this time with Kwok [61]:
γS 0.5
( ) [1 − β 2 (γL − γS )2 ] = 0.5(1 + cosθ ) (8)
γL
where γS —SFE of tested material, γL —SFE of measurement liquid, coefficient β 2 = 0.0001057
(determined experimentally), and θ—measured contact angle.
For this variant of the Neumann method, it is also not possible to determine individual
components of the SFE, and one measuring liquid is enough to perform the analysis.
The result can be calculated using, e.g., Newton’s iterative method [58].
Statistical analysis was conducted using the Student’s t-test for two-group cases and
the one-way analysis of variance (ANOVA) for differences among at least three-group cases.
3. Results
3.1. Dehydration
Figures 3–6 show the percentage change in hydration of the tested contact lenses as a
function of time. The presented results are the arithmetic mean of all measurements made
for a given research group. Three dehydration phases could be observed. The phase I
was characterized by the highest DR. In the phase II, a decrease in the DR was observed
(stabilization of samples). In the phase III, the hydration of the samples remained constant.
Hydrogel contact lenses were characterized by greater hydration. In the initial state,
hydration of Etafilcon A was 54.6% and for Omafilcon A was 60.6%, while hydration of
Narafilcon A and Senofilcon A was 44.4% and 36.3%, respectively.
Figure 3. Distribution of equilibrium water content values as a function of time for Etafilcon A.
The obtained EWC values were similar to the values declared by the manufacturers.
The dehydration process was fastest in lenses made of Omafilcon A and lasted 69 min.
The longest dehydration process was observed for Senofilcon A (94 min). There was no
unequivocal trend regarding the effect of incubation in CLS on dehydration time. However,Materials 2022, 15, 930 7 of 18
the addition of HA resulted in the extension of the dehydration time. The addition of ED
increased the time needed to dehydrate the contact lenses compared to the reference trial.
Additionally, a decrease in the EWC value was observed. In all cases of incubation in CLS,
an increase in EWC values was noticed. The difference was significant for Omafilcon A
and Senofilcon A (p < 0.05).
Figure 4. Distribution of equilibrium water content values as a function of time for Omafilcon A.
Less impact of incubation in ED on the dehydration time was observed for silicone
hydrogel lenses (for Senofilcon A an increase by 5%, for Narafilcon A by 8%) compared
to hydrogel lenses (for Omafilcon A an increase by 20%, for Etafilcon A by 30%). The de-
hydration time has increased and the EWC values have decreased. In the case of silicone
hydrogel contact lenses, the longest dehydration time was observed for samples incubated
in CLS & ED, and for hydrogel lenses, it was for the samples stored in ED.
Figure 5. Distribution of equilibrium water content values as a function of time for Narafilcon A.
Figure 6. Distribution of equilibrium water content values as a function of time for Senofilcon A.Materials 2022, 15, 930 8 of 18
Figures 7–10 show the distribution of DR values as a function of time. The obtained
charts have a characteristic shape. The highest values of DR corresponded to the first
30–40 min. The exception is the graph obtained for Senofilcon A incubated in ED. In this
material, the highest dehydration rate was observed in the time interval of 40–60 min.
Water loss was most rapid in Senofilcon A in the initial state (highest DR values in
the phase I), whereas the slowest loss of water was in Etafilcon A incubated in CLS & ED
(the lowest DR values in the phase I). In the initial state, dehydration was more stable for
hydrogel contact lenses (more homogeneous DR profile) than for silicone hydrogel lenses.
In addition, in the initial state, Narafilcon A and Senofilcon A yielded similar DR profiles,
showing comparable dehydration peaks during the whole tested time. Omafilcon A in
initial state presented one characteristic peak at 10–11 min, whereas Etafilcon A showed a
double peak. One of them was observed in the phase I and the other at 40 min of the study.
There was no observed significant effect of incubation in ophthalmic fluids on DR values
(p > 0.05) but it was noticed that storage influences dehydration time.
(a) (b)
(c) (d)
Figure 7. Distribution of DR values as a function of time for Etafilcon A: (a) initial state, (b) incubated
in CLS, (c) incubated in CLS & ED, and (d) incubated in ED.Materials 2022, 15, 930 9 of 18
(a) (b)
(c) (d)
Figure 8. Distribution of DR values as a function of time for Omafilcon A: (a) initial state, (b) incubated
in CLS, (c) incubated in CLS & ED, and (d) incubated in ED.
(a) (b)
(c) (d)
Figure 9. Distribution of DR values as a function of time for Narafilcon A: (a) initial state, (b) incubated
in CLS, (c) incubated in CLS & ED, and (d) incubated in ED.Materials 2022, 15, 930 10 of 18
(a) (b)
(c) (d)
Figure 10. Distribution of DR values as a function of time for Senofilcon A: (a) initial state, (b) incu-
bated in CLS, (c) incubated in CLS & ED, and (d) incubated in ED.
3.2. Wettability and Surface Free Energy (SFE)
The measurement results of the water CA are shown in Table 3. Presented results are
the arithmetic mean of all measurements made for a given research group. Statistically
significant differences in CA values between the hydrogel and silicone hydrogel contact
lenses were observed (p < 0.001). In the initial state, the values of CA for hydrogel contact
lenses were smaller than for silicone hydrogel lenses. For Etafilcon A was it 40.3 ± 6.9◦ and
for Omafilcon A 43.7 ± 7.0◦ , whereas for Narafilcon A was 72.2 ± 9.7◦ and for Senofilcon A
76.3 ± 8.1◦ . An example of the CA measurement is shown in Figure 11.
The surfaces of all tested contact lenses were hydrophilic. The incubation environment
notably influences the CA values but the character of a surface did not change (stayed
hydrophilic-the value of CA remained less than 90◦ ). The most significant difference in the
value of the water CA was observed for the contact lenses incubated in the ED (p < 0.001).
In this case, it was not possible to deposit the water drops on the surface because the CA
decreased significantly (the surface became more hydrophilic).
Figure 11. Water contact angle measurement for Narafilcon A.
When the contact lenses were incubated in the CLS, the CA increased slightly, with a
greater difference being seen with the hydrogel lenses. For the contact lenses stored in
CLS & ED, an increase in the value of the CA was observed for Omafilcon A, Narafilcon
A, and Senofilcon A. The value of the CA for Etafilcon A has not changed in a statistically
significant way after this incubation (p = 0.33).Materials 2022, 15, 930 11 of 18
Table 3. Values of the water contact angle for tested materials.
Contact Angle (◦ )
Material After Incubation
Initial State
in CLS in CLS & ED in ED
Etafilcon A 40.3 ± 6.9 44.8 ± 5.6 40.6 ± 3.2 -
Omafilcon A 43.7 ± 7.0 46.7 ± 9.3 45.3 ± 6.9 -
Narafilcon A 72.2 ± 9.7 73.8 ± 5.9 75.9 ± 5.3 -
Senofilcon A 76.3 ± 8.1 78.6 ± 5.6 81.6 ± 8.9 -
CLS: contact lens solution; ED: eye drops.
The measurement of the CA was used for further analysis to calculate the SFE.
Tables 4 and 5 present a summary of the values of the SFE calculated using the follow-
ing methods: Owens–Wendt, Wu, Neumann, and Neumann–Kwok. The obtained SFE
values, calculated using various methods, were similar for each material; however, in the
Wu method, the results were higher than those obtained using the other models.
Table 4. Comparison of the SFE and its components (mJ/m2 ) calculated using Owens–Wendt method.
Owens-Wendt
Material Environment p
γSd γS γS
Initial state 26.35 ± 4.73 31.74 ± 5.42 58.09 ± 4.86
CLS 25.13 ± 4.09 29.68 ± 4.48 54.81 ± 4.12
Etafilcon A
CLS & ED 26.63 ± 3.37 31.35 ± 3.26 57.98 ± 2.22
ED 21.20 ± 3.11 - -
Initial state 28.03 ± 5.21 28.29 ± 5.36 56.32 ± 4.86
CLS 26.77 ± 5.28 27.68 ± 7.35 54.45 ± 6.56
Omafilcon A
CLS & ED 28.93 ± 4.89 27.02 ± 5.85 55.95 ± 4.79
ED 22.59 ± 3.89 - -
Initial state 21.37 ± 5.43 13.96 ± 5.85 35.33 ± 6.56
CLS 22.59 ± 3.57 12.03 ± 3.81 34.62 ± 3.55
Narafilcon A
CLS & ED 21.72 ± 3.65 11.14 ± 3.59 32.86 ± 3.47
ED 19.77 ± 4.42 - -
Initial state 23.55 ± 5.67 10.49 ± 5.08 34.04 ± 5.65
CLS 25.69 ± 3.70 8.07 ± 2.95 33.75 ± 3.78
Senofilcon A
CLS & ED 26.58 ± 4.76 6.81 ± 4.27 33.39 ± 5.13
ED 21.41 ± 4.26 - -
CLS: contact lens solution, ED: eye drops.
Differences in the value of SFE between the hydrogel and silicone hydrogel con-
tact lenses were observed. Higher SFE values were found for hydrogel contact lenses,
e.g., according to the Owens–Wendt method; they ranged from 54.45 ± 6.56 mJ/m2 to
58.09 ± 4.86 mJ/m2 , while the SFE values for the silicone hydrogel contact lenses were from
32.86 ± 3.47 mJ/m2 to 35.33 ± 6.56 mJ/m2 . Incubation in all tested environments caused a
decrease in the value of SFE but these differences were in most cases statistically insignifi-
cant. A general tendency was observed that for silicone hydrogel materials the value of the
dispersive component of SFE was greater than the value of the polar component, whereas
for hydrogel materials, in most of the analyzed cases, higher values were assumed by the
polar component; however, for Omafilcon A this relationship is unclear.Materials 2022, 15, 930 12 of 18
In the case of samples incubated in ED, it was only possible to calculate the dispersive
component of the SFE. However, it was not feasible to calculate the polar component and
thus the SFE. This was because it was not possible to deposit the water drops on the surface
of the material. For the dispersive component, a decrease of the value after incubation in
ED for all types of contact lenses was observed.
Table 5. Comparison of the SFE and its components (mJ/m2 ) calculated using Wu, Neumann,
and Neumann–Kwok methods.
Wu Neumann Neumann–Kwok
Material Environment p
γSd γS γS γS γS
Initial state 28.61 ± 4.03 32.22 ± 4.16 60.83 ± 4.50 59.10 ± 3.74 58.80 ± 3.85
CLS 27.57 ± 3.48 30.26 ± 3.41 57.83 ± 3.80 56.69 ± 3.15 56.33 ± 3.24
Etafilcon A
CLS & ED 28.84 ± 2.87 31.91 ± 2.31 60.75 ± 2.19 59.00 ± 1.73 58.71 ± 1.78
ED 24.24 ± 2.64 - - - -
Initial state 30.05 ± 4.47 29.59 ± 4.07 59.64 ± 4.60 57.11 ± 3.80 56.76 ± 3.91
CLS 28.98 ± 4.51 28.87 ± 5.79 57.85 ± 5.81 55.78 ± 5.45 55.40 ± 5.60
Omafilcon A
CLS & ED 30.82 ± 4.21 28.67 ± 4.47 59.49 ± 4.38 56.49 ± 4.08 56.12 ± 4.19
ED 25.41 ± 3.30 - - - -
Initial state 24.37 ± 4.62 16.57 ± 4.99 40.94 ± 6.03 40.32 ± 5.98 39.72 ± 5.94
CLS 25.41 ± 3.04 15.13 ± 3.24 40.54 ± 3.29 39.37 ± 3.66 38.74 ± 3.62
Narafilcon A
CLS & ED 24.67 ± 3.11 14.28 ± 3.00 38.95 ± 3.20 38.01 ± 3.31 37.38 ± 3.28
ED 23.02 ± 3.76 - - - -
Initial state 26.22 ± 4.82 13.78 ± 4.32 40.00 ± 5.27 37.80 ± 5.01 37.20 ± 4.97
CLS 28.04 ± 3.14 11.86 ± 2.73 39.90 ± 3.61 36.33 ± 3.50 35.73 ± 3.45
Senofilcon A
CLS & ED 28.81 ± 4.06 10.44 ± 4.22 39.25 ± 5.01 34.47 ± 5.55 33.92 ± 5.44
ED 24.41 ± 3.61 - - - -
CLS: contact lens solution, ED: eye drops.
4. Discussion
Four types of contact lenses were tested. All tested contact lenses had the same
back vertex power. Because of this, any differences observed in the dehydration process
result directly from the type of contact lens material or the influence of the incubation
environment. According to Willcox et al. [16], there is inconsistent evidence that ED or CLS
can significantly affect or maintain the wettability of contact lenses during wear. Therefore,
the study attempts to evaluate the influence of the incubation environment on the surface
properties of contact lenses.
This study showed that hydrogel and silicone hydrogel contact lenses yielded dissimi-
lar dehydration profiles. Hydrogel materials presented a more homogenous distribution of
DR values than silicone hydrogel contact lenses. The DR curves showed similar dehydra-
tion profiles for Narafilcon A and Senofilcon A in the initial state. This could have been due
to the analogous chemical composition of these silicone hydrogel materials. Additionally,
Senofilcon A in the initial state seems to be the least resistant to the dehydration process
(the most rapid changes of DR values). This statement confirms the results of a study by
Lira et al. [62] that analyzes the influence of different lens care systems in surface roughness
and refractive index (RI) of contact lenses. According Lira’s research, Senofilcon A always
increases the refractive index, which may be interpreted as a decrease in water content.
Note that the dehydration profile over time of the tested contact lenses showed a different
dehydration curve depending on the stored conditions. Martín-Montañez et al. [34] in theirMaterials 2022, 15, 930 13 of 18
in vitro studies found a significant influence of air humidity and the type of contact lens
material on the DR value and the interpretation of the DR profile. In our research, uniform
air humidity conditions were maintained to eliminate the influence of this factor on the
obtained results.
The most significant changes were observed for contact lenses incubated in ED. In all
tested cases (except Senofilcon A incubated in ED), the quickest water loss was during
the first minutes of the study. A similar feature was already described by González-
Méijome et al. [30] and Martín-Montañez et al. [34]. González-Méijome et al. [30] reported
that high EWC materials presented a significantly longer phase I (44.50 ± 10.97 min) com-
pared to medium EWC (22.75 ± 7.32 min) and low EWC (12.00 ± 3.91 min). Based on our
research, it is not possible to clearly confirm this relationship, and phase I lasted about
40 min in all tested cases. According to Krysztofiak et al. [63], the time needed for Senofil-
con A dehydration is approximately 72 min, while this study has shown that it is about
69 min. In other work, Krysztofiak et al. [52] reported that Narafilcon A has a shorter phase
I than conventional hydrogels. According to Morgan et al. [64], the EWC value for Etafilcon
A is 58.1% ± 0.6%, which is similar to our result 52.7% ± 2.1%. The results obtained by
Efron et al. [18] suggest that with Etafilcon A the loss of oxygen performance is proportional
to the amount of water lost through the contact lens.
According to Sekine et al. [65], three phases of dehydration reflect water structure in
the material, which additionally influences its other properties [66]. Krysztofiak et al. [52]
assumed that in phase I bulk water molecules evaporate. As they do not interact with the
material, dehydration follows rapidly. This statement cannot be directly concluded from
the results obtained in the presented study. Dehydration of loosely bound water occurs
in phase II. In phase III, the material is balanced with the environment and dehydration
is complete. This is because the tightly bound water molecules produce strong bindings.
According to Fornasiero et al. [67], a thin glassy layer may be present on the surface of
the contact lens when exposed to air, which limits further evaporation. Accumulated
deposits can be found on dehydrated areas of the contact lenses, which in turn may reduce
wettability and cause discomfort [68].
The stabilization time (phase III of dehydration) shows when the contact lens has
almost lost all the water content. Omafilcon A reached its stabilization time the fastest and
Senofilcon A the slowest. The results presented in this work indicated that the stabilization
time was longer for contact lenses after incubation in ophthalmic fluids (except Etafilcon
A in CLS & ED and Senofilcon A in ED). Marx et al. [28] in their studies found that CLS-
containing surfactant wetting agents delay the surface dehydration of silicone hydrogel
contact lenses, which is consistent with our study because incubation of the lenses in the
ED caused prolongation of the dehydration time.
Alves et al. [69] investigated the interaction between contact lenses and the CLS.
In their work, they suggest that the optical variables of CLS and contact lenses themselves
changed after storage. For example, after storage in the different CLS, the transmittance
of each material (i.a., Senofilcon A, Omafilcon A) exhibited significant changes. It was
probably related to the biophysical and biochemical interactions between the ingredients
and the release of some polymeric compounds. Alves concluded that HA enhances water
retention and does not influence the contact lenses optical properties. This is partly in
line with our research because the dehydration process was longer for the contact lenses
incubated in the ED containing HA. The conducted research confirmed that the dynamic of
dehydration depends both on the chemical composition and the type of water environment
but the chemical composition of the contact lenses has a greater influence. The initial EWC
value is also important and affects the DR value. Taking into account the relatively long
dehydration time, the DR distribution and the lowest value of water CA, Etafilcon A could
be considered the most advantageous in clinical use.
Values of CA and SFE were used to indicate differences in surface properties of
materials. Large research group (100 measurements of CA for each case) contributed to the
statistical significance of the results described. It was observed that the water CA achievedMaterials 2022, 15, 930 14 of 18
lower values for hydrogel contact lenses. Higher values of this parameter for silicone
hydrogel contact lenses may be related to the bulk content of the Si-rich hydrophobic phase
reaching over 30% [70]. Similar studies were carried out by Iwashita et al. [71], who made
the opposite conclusion that CA values associated with the silicone hydrogel contact lenses
were significantly lower than those associated with the hydrogel contact lenses. In addition,
storing the contact lenses in HA increased CA values.
Our studies showed an increase of hydrophobicity for contact lenses stored in CLS and
CLS & ED (except Etafilcon A in CLS & ED) but surfaces remained hydrophilic nonetheless,
whereas hydrophilicity increased for contact lenses incubated in ED because there was
no possibility to sessile a water drop. In addition, Lira et al. [72] found that there were
interactions between the contact lens material and the CLS, which can significantly influence
on the surface wettability of contact lenses.
The obtained values of CA for Senofilcon A were in good agreement with the results
obtained by Lira et al. [45]. The differences were observed in the values of the CA for
Etafilcon A, but it was within the measurement error. Lira et al. obtained values of CA
in the initial state for Etafilcon A 49.6 ± 3.0◦ and for Senofilcon A 78.9 ± 2.5◦ . They also
found interactions between contact lens material and CLS that may have an important
role in the hydrophobicity of the contact lens surface. Bruinsma et al. [73] analyzed
Etafilcon A for which the value of CA was 45◦ . Tonge’s et al. [74] study showed that the
Etafilcon A lenses did not show significant changes in wettability during the initial 4h wear
period. Yamasaki et al. [75] investigated the effects of hyaluronic acid and low molecular
weight hyaluronic acid on contact lenses. According to these results, HA increases the
hydrophilicity of the lens surface. This effect was more durable when using solutions
containing low molecular weight hyaluronic acid. Our research also showed an increase in
the hydrophilicity of the surface of contact lenses incubated in ED.
Eftimov et al. [15,76] studied the influence of air exposure time on the water CA of
silicone hydrogel contact lenses and reported that in the initial state the values of CA
for Narafilcon A and Senofilcon A were 66.7◦ and 68.6◦ , respectively. It slightly differed
from our results (72.2 ± 9.7◦ for Narafilcon A and 76.3 ± 8.1◦ for Senofilcon A), but their
results were within our error limit. Menzies [77] reported that in the initial state water
CA for Omafilcon A was 93◦ , for Narafilcon A was 102◦ , and for Etafilcon A was 50◦ .
The inconsistency of the results with other tests may ensue from many circumstances, such
as the use of a different measurement method or the influence of the environment [78].
Studies have shown that a greater water CA value was found in silicone hydrogel
contact lenses (more hydrophobic). The main problem with silicone-based contact lenses is
the inherent hydrophobicity of the siloxane groups, which greatly inhibits the development
of silicone hydrogel contact lenses. The hydrophobicity leads to problems such as decreased
surface wettability and increased lipid interaction. However, the main advantage of silicone
hydrogel materials over hydrogels is their greater oxygen permeability, which results in a
reduction of corneal hypoxia [79]. According to Wolffsohn et al. [80] the lens surface wetting
is not only related to lens properties, but also the interaction between an individual’s ocular
surface including their tear film, and interaction with the lens. Therefore, further in vivo
studies are required for the clinical evaluation of our results.
Studies describing the connection between bacterial adhesion and surface wettability
exhibit inconsistent results. Some studies show that bacterial adhesion is higher for hy-
drophobic substrates, and other works deliver information about increased biofilm growth
on highly hydrophilic surfaces [47,81]. Values of water CA in the range from 40◦ to 70◦
are recognized as most opportunely for cell adhesion on polymer materials [78]. Based on
this information and our results one would assume that hydrogel contact lenses are more
convenient for cell adhesion than silicone hydrogel lenses. However, it cannot be clearly
stated on the basis of the presented research. Additional bacterial tests should be performed
to verify this statement. Conversely, many studies showed that the hydrophobic character
of the surface may increase bacterial adhesion which suggests that silicone hydrogel contact
lenses had a higher extent of bacterial adhesion [47,81–83].Materials 2022, 15, 930 15 of 18
According to Campbell et al. [84], the SFE of material shows how CA analysis is
capable of providing supplementary surface characterization. Therefore, in this study,
the SFE was calculated from the CA. Taking into account all four approaches used for
calculating the SFE values, it should be noted that despite various assumptions each
gave comparable results. The research of Lin et al. [85] reported that the SFE values for
Etafilcon A, Omafilcon A, and Senofilcon A were 44.43 mJ/m2 , 57.33 mJ/m2 , 49.13 mJ/m2 ,
respectively. Only for Omafilcon A are the results presented in our study similar. In the
case of Etafilcon A, the obtained value of SFE was higher than given by Lin. However,
for Senofilcon A value of this parameter was lower.
5. Conclusions
The presented results provide information about the influence of selected ophthalmic
fluids on the in vitro wettability, dehydration, and surface properties of contact lenses.
Dissimilarity found in the contact lenses’ dehydration profiles can be clarified by differences
in the chemical composition of the miscellaneous materials studied. Our work investigated
the effect of only one selected contact lens solution and one type of eye drops on the
properties of the lenses.
Taking into account the research of other biomaterials and the few works dealing
with the calculation of SFE for contact lenses, an attempt was made to adapt this method
to the description of contact lenses. These studies were combined with frequently used
dehydration studies to make a broad characterization of the material. Calculation of SFE
is very useful because it can be used to estimate the possibility of bacterial adhesion on
contact lenses surfaces. It is clinically important to maintain the wettability of the contact
lenses over a longer period of time to maintain eye health and wearer comfort. Further,
in vivo studies would be needed to understand better the clinical impact of ophthalmic
fluids on surface properties, wettability, and dehydration of contact lenses. In order to
complete the analysis, the presented research should be extended to oxygen permeability,
bacterial adhesion, and dehydration at different humidity or airflow conditions.
Author Contributions: Conceptualization, G.C.-P. and A.W.; methodology, G.C.-P. and A.W.; valida-
tion, G.C.-P. and A.W.; formal analysis, G.C.-P. and A.W.; investigation, G.C.-P. and A.W.; resources,
G.C.-P. and A.W.; data curation, G.C.-P. and A.W.; writing—original draft preparation, G.C.-P. and
A.W.; writing—review and editing, G.C.-P. and A.W.; visualization, G.C.-P. and A.W. All authors
have read and agreed to the published version of the manuscript.
Funding: This research received no external funding.
Institutional Review Board Statement: Not applicable.
Informed Consent Statement: Not applicable.
Data Availability Statement: Date sharing is not applicable.
Conflicts of Interest: The authors declare no conflicts of interest.
References
1. Vidal-Rohr, M.; Wolffsohn, J.S.; Davies, L.N.; Cerviño, A. Effect of contact lens surface properties on comfort, tear stability and
ocular physiology. Contact Lens Anterior Eye 2018, 41, 117–121. [CrossRef] [PubMed]
2. Tranoudis, I.; Efron, N. In-eye performance of soft contact lenses made from different materials. Contact Lens Anterior Eye 2004, 27,
133–148. [CrossRef] [PubMed]
3. Roba, M.; Duncan, E.G.; Hill, G.A.; Spencer, N.D.; Tosatti, S.G.P. Friction Measurements on Contact Lenses in Their Operating
Environment. Tribol. Lett. 2011, 44, 387–397. [CrossRef]
4. Guillon, M.; Patel, T.; Patel, K.; Gupta, R.; Maissa, C.A. Quantification of contact lens wettability after prolonged visual device use
under low humidity conditions. Contact Lens Anterior Eye 2019, 42, 386–391. [CrossRef] [PubMed]
5. Brygoła, R.; S˛ek, S.; Sokołowski, M.; Kowalczyk-Hernández, M.; Pniewski, J. Limits in measurements of contact lens surface
profile using atomic force microscopy. Colloids Surf. B Biointerfaces 2018, 165, 229–234. [CrossRef] [PubMed]
6. Samsom, M.; Iwabuchi, Y.; Sheardown, H.; Schmidt, T.A. Proteoglycan 4 and hyaluronan as boundary lubricants for model
contact lens hydrogels. J. Biomed. Mater. Res. B Appl. Biomater. 2018, 106, 1329–1338. [CrossRef] [PubMed]Materials 2022, 15, 930 16 of 18
7. Yu, Y.; Macoon, R.; Chauhan, A. Improving wettability and lubricity of commercial contact lenses by polymerizing a thin film of
dimethylacryamide. Colloids Surf. A Physicochem. Eng. Asp. 2019, 583, 123974. [CrossRef]
8. Jones, L.; May, C.; Nazar, L.; Simpson, T. In vitro evaluation of the dehydration characteristics of silicone hydrogel and
conventional hydrogel contact lens materials. Contact Lens Anterior Eye 2002, 25, 147–156. [CrossRef]
9. Rajchel, D.; Krysztofiak, K.; Szyczewski, A. Influence of sodium hyaluronate on dehydration and water distribution in soft contact
lenses. Opt. Appl. 2016, 46, 483–496.
10. Filipecki, J.; Sitarz, M.; Kocela, A.; Kotynia, K.; Jeleń, P.; Filipecka, K.; Gaw˛eda, M. Studying functional properties of hydrogel and
silicone–hydrogel contact lenses with PALS, MIR and Raman spectroscopy. Spectrochim. Acta A Mol. Biomol. Spectrosc. 2014, 131,
686–690. [CrossRef]
11. Levitt, A.E.; Galor, A.; Chowdhury, A.R.; Felix, E.R.; Sarantopoulos, C.D.; Zhuang, G.Y.; Patin, D.; Maixner, W.; Smith, S.B.; Martin,
E.R.; et al. Evidence that Dry Eye Represents a Chronic Overlapping Pain Condition. Mol. Pain 2017, 13, 1–9. [CrossRef]
12. McMonnies, C.W. Could contact lens dryness discomfort symptoms sometimes have a neuropathic basis? Eye Vis. 2021, 8, 12.
[CrossRef]
13. Situ, P.; Simpson, T.L.; Jones, L.W.; Fonn, D. Effects of Silicone Hydrogel Contact Lens Wear on Ocular Surface Sensitivity to
Tactile, Pneumatic Mechanical, and Chemical Stimulation. Investig. Ophthalmol. Vis. Sci. 2010, 51, 6111–6117. [CrossRef]
14. Murphy, P.J.; Patel, S.; Marshall, J. The Effect of Long-term, Daily Contact Lens Wear on Corneal Sensitivity Cornea 2001, 20,
264–269. [CrossRef]
15. Eftimov, P.; Yokoi, N.; Peev, N.; Georgiev, G.A. Impact of Air Exposure Time on the Water Contact Angles of Daily Disposable
Silicone Hydrogels. Int. J. Mol. Sci. 2019, 20, 1313. [CrossRef]
16. Willcox, M.; Keir, N.; Maseedupally, V.; Masoudi, S.; McDermott, A.; Mobeen, R.; Purslow, C.; Santodomingo-Rubido, J.;
Tavazzi, S.; Zeri, F.; et al. BCLA CLEAR—Contact lens wettability, cleaning, disinfection and interactions with tear. Contact Lens
Anterior Eye 2021, 44, 157–191. [CrossRef]
17. Lin, C.; Cho, H.; Yeh, Y.; Yang, M. Improvement of the surface wettability of silicone hydrogel contact lenses via layer-by-layer
self-assembly technique. Colloids Surf. B Biointerfaces 2015, 136, 735–743. [CrossRef]
18. Efron, N.; Morgan, P.B. Hydrogel contact lens dehydration and oxygen transmissibility. Clao J. 1999, 25, 148–151.
19. Pritchard, N.; Fonn, D. Dehydration, lens movement and dryness ratings of hydrogel contact lenses. Ophthalmic Physiol. Opt.
1995, 15, 281–286. [CrossRef]
20. Andrasko, G.; Schoessler, J. The effect of humidity on the dehydration of soft contact lenses on the eye. Int. Contact Lens Clin.
1980, 7, 30–33.
21. Brennan, N.; Efron, N.; Bruce, A.; Duldig, D.; Russo, N. Dehydration of hydrogel lenses: Environmental influences during normal
wear. Am. J. Optom. Physiol. Opt. 1988, 65, 277–281. [CrossRef] [PubMed]
22. Efron, N.; Brennan, N. The clinical relevance of hydrogel lens water content. Contact Lens Anterior Eye 1987, 4, 9–14.
23. Caló, E.; Khutoryanskiy, V.V. Biomedical applications of hydrogels: A review of patents and commercial products. Eur. Polym. J.
2015, 65, 252–267. [CrossRef]
24. Brennan, N.; Efron, N. Hydrogel lens dehydration: A material dependent phenomenon? Contact Lens Forum 1987, 12, 28–29.
25. Larsen, D.; Huff, J.; Holden B. Proton NMR relaxation in hydrogel contact lenses: Correlation with in vivo lens dehydration data.
Curr. Eye Res. 1990, 9, 697–706. [CrossRef]
26. Benz, P.; Ors, J. New materials demand more accurate measurements of performance. Spectrum 1997, 12, 40–46.
27. Andrasko, G. Hydrogel dehydration in various environments. Int. Contact Lens Clin. 1983, 10, 22–28.
28. Marx, S.; Sickenberger, W. A novel In-Vitro method for assessing contact lens surface dewetting: Noninvasive keratograph dry-up
time (NIK-DUT). Contact Lens Anterior Eye 2017, 40, 382–388. [CrossRef]
29. Wechsler, S.; Johnson, M.; Businger, U. In Vivo hydration of hydrogel lenses—The first hour. Int. Contact Lens Clin. 1983, 10,
349–352.
30. González-Méijome, J.M.; López-Alemany, A.; Almeida, J.B.; Parafita, M.A.; Refojo, M.F. Qualitative and quantitative characteri-
zation of the in vitro dehydration process of hydrogel contact lenses. Biomed. Mater. Res. B Appl. Biomater. 2007, 83, 512–526.
[CrossRef]
31. Insua Pereira, E.; Lira, M. Comfort, Ocular Dryness, and Equilibrium Water Content Changes of Daily Disposable Contact Lenses.
Eye Contact Lens 2018, 44, S233–S240. [CrossRef]
32. Krysztofiak, K. Badanie procesu dehydratacji w hydrożelowych i silikonowo-hydrożelowych soczewkach kontaktowych. Ph.D.
Thesis, UAM Poznań, Poland, 2015.
33. Kyritsis, A.; Pissis, P.; Gómez Ribelles, J.L.; Monleón Pradas, M. Polymer-water interactions in poly(hydroxyethyl acrylate)
hydrogels studied by dielectric, calorimetric and sorption isotherm measurements. Polym. Gels Netw. 1995, 3, 445–469. [CrossRef]
34. Martín-Montañez, V.; López-Miguel, A.; Arroyo, C.; Mateo, M.E.; González-Méijome, J.M.; Calonge, M.; González-García, M.J.
Influence of environmental factors in the in vitro dehydration of hydrogel and silicone hydrogel contact lenses. J. Biomed. Mater.
Res. B Appl. Biomater. 2014, 102, 764–771. [CrossRef]
35. Calonge, M. The treatment of dry eye. Surv. Ophthalmol. 2001, 45, 227–239. [CrossRef]
36. Stahl, U.; Willcox, M.; Stapleton, F. Role of hypo-osmotic saline drops in ocular comfort during contact lens wear. Contact Lens
Anterior Eye 2010, 33, 68–75. [CrossRef]Materials 2022, 15, 930 17 of 18
37. Lapčík, L.; De Smedt, S.; Demeester, J.; Chabreček, P. Hyaluronan: Preparation, structure, properties, and applications. Chem. Rev.
1998, 98, 2663–2684. [CrossRef]
38. Nashida, T.; Nakamura, M.; Mishima, H.; Otori, T. Hyaluronan stimulates corneal epithelial migration. Exp. Eye Res. 1991, 53,
753–758. [CrossRef]
39. Rah, M.J. A review of hyaluronan and its ophthalmic applications. Optometry 2011, 82, 38–43. [CrossRef]
40. Aragona, P.; Di Stefano, G.; Ferreri, F.; Spinella, R.; Stilo, A. Sodium hyaluronate eye drops of different osmolarity for the treatment
of dry eye in Sjögren’s syndrome patients. Br. J. Ophthalmol. 2002, 86, 879–884. [CrossRef]
41. Brjesky, V.V.; Maychuk, Y.F.; Petrayevsky, A.V.; Nagorsky, P.G. Use of preservative-free hyaluronic acid (Hylabak) for a range of
patients with dry eye syndrome: Experience in Russia. Clin. Ophthalmol. 2014, 8, 1169–1177.
42. Cazzaniga, G.; Ottobelli, M.; Ionescu, A.; Garcia-Godoy, F.; Brambilla, E. Surface properties of resin-based composite materials
and biofilm formation: A review of the current literature. Am. J. Dent. 2015, 28, 311–320. [PubMed]
43. Lam, C.N.C.; Kim, N.; Hui, D.; Kwok, D.Y.; Hair, M.L.; Neumann, A.W. The effect of liquid properties to contact angle hysteresis.
Colloids Surf. A Physicochem. Eng. Asp. 2001, 189, 265–278. [CrossRef]
44. Simpson, J.T.; Hunter, S.R.; Aytug,T. Superhydrophobic materials and coatings: A review. Rep. Prog. Phys. 2015, 78, 1–15.
[CrossRef] [PubMed]
45. Lira, M.; Silva, R. Contact lens care solutions and their influence on contact lens hydrophobicity. Contact Lens Anterior Eye 2018,
41, S14–S15. [CrossRef]
46. Figura, P. Powierzchnia soczewek kontaktowych a bezpieczeństwo i komfort użytkownika. Ophtha Therapy 2015, 2, 148–153.
47. Giraldez, M.J.; Resua, C.G.; Lira, M.; Oliveira, M.E.; Magariños, B.; Toranzo, A.E.; Yebra-Pimentel, E. Contact lens hydrophobicity
and roughness effects on bacterial adhesion. Optom. Vis. Sci. 2010, 87, E426–E431. [CrossRef]
48. Yu, Y.; Hsu, K.H.; Gharami, S.; Butler, J.E.; Hazra, S.; Chauhan, A. Interfacial polymerization of a thin film on contact lenses for
improving lubricity. J. Colloid Interface Sci. 2020, 1571, 356–367. [CrossRef]
49. Galas, S.; Copper, L. Oxygen permeability of the pigmented material used in cosmetic daily disposable contact lenses. Clin.
Ophthalmol. 2016, 10, 2469–2474. [CrossRef]
50. Lewandowska, M.; Jasińska-Kwaśnik, W.; Jóźwik, A.; Siedlecki, D. Measurement of oxygen permeability of contact lenses based
on analysis of porosity. Int. J. Eng. Sci. Technol. 2015, 3, 1–5.
51. Burgos-Fernández, F.J.; Guaus, E.; Martínez, C.; Vilaseca, M. Terahertz-based system for dehydration analysis of hydrogel contact
lenses. Opt. Appl. 2019, 49, 571–584. [CrossRef]
52. Krysztofiak, K.; Szyczewski, A. Study of dehydration and water states in new and worn soft contact lens materials. Opt. Appl.
2014, 44, 237–250.
53. Żenkiewicz, M. Methods for the calculation of surface free energy of solids. J. Achiev. Mater. Manuf. 2007, 24, 137–145.
54. Owens, D.K.; Wendt, R.C. Estimation of the Surface Free Energy of Polymers. J. Appl. Polym. Sci. 1969, 13, 1741–1747. [CrossRef]
55. Liber-Kneć, A.; Łagan, S. Surface Testing of Dental Biomaterials—Determination of Contact Angle and Surface Free Energy.
Materials 2021, 14, 2716. [CrossRef]
56. Lotfi, M.; Nejib, M.; Naceur, M. Cell adhesion to biomaterials: Concept of biocompatibility. In Advances in Biomaterials Science and
Biomedical Applications; Pignatello, R., Ed.; Intech: London, UK, 2013; pp. 208–240.
57. Wu, S. Calculation of Interfacial Tension in Polymer Systems. J. Polym. Sci. Part C 1971, 34, 19–30. [CrossRef]
58. Hejda, F.; Solař, P.; Kousal, J. Surface Free Energy Determination by Contact Angle Measurements–A Comparison of Various
Approaches. In Proceedings of the 19th Annual Conference of Doctoral Students—WDS’10; Proceedings of Contributed Papers,
Part III, Prague, Czech Republic, 1–4 June 2010; Matfyzpress: Prague, Czech Republic, 2010; pp. 25–30.
59. Neumann, A.W.; Good, R.J.; Hope, C.J.; Sejpol, M. An equation-of-state approach to determine surface tensions of low-energy
solids from contact angles. J. Colloid Interface Sci. 1974, 49, 291–304. [CrossRef]
60. Li, D.; Neumann, A.W. A reformulation of the equation of state for interfacial tensions. J. Colloid Interface Sci. 1990, 137, 304–307.
[CrossRef]
61. Kwok, D.Y.; Neumann, A.W. Contact angle measurement and contact angle interpretation. Adv. Colloid Interface Sci. 1999, 81,
167–249. [CrossRef]
62. Lira, M.; Franco, S.; Vazquez-Dorrio, J.B.; Real Oliveira, M.E.; Costa, M.F. Surface roughness and refractive index changes in
contact lens induced by lens care systems. Eye Contact Lens 2014, 40, 140–147. [CrossRef]
63. Krysztofiak, K.; Płucisz, M.; Szyczewski, A. The influence of wearing on water states and dehydration of silicone-hydrogel contact
lenses. Eng. Biomater. 2012, 15, 18–25.
64. Morgan, P.B.; Efron, N. In Vivo Dehydration of Silicone Hydrogel Contact Lenses. Eye Contact Lens 2003, 29, 173–176. [CrossRef]
65. Sekine, Y.; Ikeda-Fukazawa, T. Structural changes of water in a hydrogel during dehydration. J. Chem. Phys. 2009, 130, 034501.
[CrossRef]
66. Tranoudis, I.; Efron, N. Water properties of soft contact lens materials. Contact Lens Anterior Eye 2004, 27, 193–208. [CrossRef]
67. Fornasiero, F.; Krull, F.; Radke, C.J.; Prausnitz, J.M. Diffusivity of water through a HEMA-based soft contact lens.
Fluid Phase Equilibria 2005, 228–229, 269–273. [CrossRef]
68. French, K. Contact lens material properties. Part 1—Wettability. Optician 2005, 230, 20–28.
69. Alves, M.; Castanheira, E.M.S.; Lira M. Interactions between contact lenses and lens care solutions: Influence in optical properties.
Contact Lens Anterior Eye 2021, 44, 101414. [CrossRef]You can also read