India's housing vacancy paradox: How rent control and weak contract enforcement produce unoccupied units and a housing - shortage at the same time ...
←
→
Page content transcription
If your browser does not render page correctly, please read the page content below
CSEP Working Paper-4
January 2021

 India’s housing vacancy paradox:
     How rent control and weak
   contract enforcement produce
  unoccupied units and a housing
     shortage at the same time

SAHIL GANDHI, RICHARD GREEN AND SHAONLEE PATRANABIS

                       www.csep.org
About PRRC

                                        This paper was published as part of the Property Rights Research
                                        Consortium (PRRC), and supported by Omidyar Network India.
                                        PRRC is a network of leading think-tanks and research organisations,
                                        working to collaborate and drive policy action in the field of land,
                                        housing and property rights in India.

                                        Support for this research was generously provided by the Omidyar
                                        Network. CSEP recognises that the value it provides is in its absolute
                                        commitment to quality, independence, and impact. Activities
                                        supported by its donors reflect this commitment and the analysis and
                                        recommendations found in this report are solely determined by the
                                        scholar(s).

Copyright © Sahil Gandhi, Richard Green and Shaonlee Patranabis

Centre for Social and Economic Progress (CSEP)
CSEP Research Foundation
6, Dr. Jose P. Rizal Marg, Chanakyapuri,
New Delhi - 110021

The Centre for Social and Economic Progress (CSEP) conducts in-depth, policy-relevant research and provides
evidence-based recommendations to the challenges facing India and the world. It draws on the expertise of
its researchers, extensive interactions with policymakers as well as convening power to enhance the impact of
research. CSEP is based in New Delhi and registered as a company limited by shares and not for profit, under
Section 8 of the Companies Act, 1956.

All content reflects the individual views of the authors. The Centre for Social and Economic Progress (CSEP)
does not hold an institutional view on any subject.

CSEP working papers are circulated for discussion and comment purposes. The views expressed herein are
those of the author(s). All rights reserved. Short sections of text, not to exceed two paragraphs, may be quoted
without explicit permission provided that full credit, including © notice, is given to the source.
India’s housing vacancy paradox:
How rent control and weak
contract enforcement produce
unoccupied units and a housing
shortage at the same time
Sahil Gandhi, Richard Green and Shaonlee Patranabis1
1
Sahil Gandhi is a Fellow at CSEP and at the time of writing this paper was a postdoc at USC, Richard Green is a
professor at USC Price and USC Economics and a Senior Visiting Fellow at CSEP, and Shaonlee Patranabis is
Research Assistant at CSEP. The authors would like to thank Anirudh Burman, Jan Brueckner, Shubhagato Dasgupta,
Shreya Deb, Shishir Gupta, Hue-Tam Jamme, Jeffrey Lin, Rakesh Mohan, Shirish B Patel, Abhay Pethe, Kala
Sridhar, Alexander Tabarrok, and Vaidehi Tandel for their comments and suggestions. The authors additionally
thanks Zehra Kazmi and Rohan Laik for comments, suggestions and copyedits.
1Abstract
India has 12.38% of its urban housing stock vacant. We look at three possible explanations for
vacancy rates: pro-tenant rent control laws, effectiveness in contract enforcement, and under-
provision of public goods and amenities. We find that pro-tenant laws are positively related to
vacancy rates. Further, poor contract enforcement measured by the number of judges normalised
by population is negatively related to vacancy rates. We find under-provision of public goods and
amenities has no relationship with vacancy rates. We also discuss policies and experiences from
other countries to tackle the problem of vacant housing.
21. Introduction
With cities around the world facing severe housing shortages, the issue of vacant housing
has come to the fore and has been covered extensively by the media in recent years (New York
Times 2017, Financial Times 2014, The Economist 2019). Cities such as Washington DC and
Vancouver have started taxing vacant houses to bring the units back into the market. The problem
of vacant houses is not just a problem of cities in developed countries but it is, surprisingly, quite
rampant in developing countries. For example, in 2010, Mexico had a housing vacancy rate of
around 14%; in urban parts of China, housing vacancies can be upwards of 20%, leading to the
existence of some ghost towns (see Zhang et al. 2016). The phenomenon of a large number of vacant
houses in India has also been in the news (BBC 2015, Reuters 2018, Times of India 2012).
Academic literature on reasons for vacant housing has looked at the impact of housing
finance (Monkkonen 2019, Reyes 2020), inequality (Zhang et al. 2016), restrictive regulations
(Cheshire et al. 2016), and investments in housing for speculative purposes (Struyk 1988). This is
one among many serious problems in the housing market — including a housing shortage in millions
and a vast number of households living in slums — that beset Indian cities. As per the Census of
India (2011), 11.09 million units, forming approximately 12.38% of the total urban housing stock,
were vacant. In 1971, the Indian Census reported 1.83 million vacant houses. The proportion of
rental houses to occupied residential stock declined from 53% in 1971 to 28% in 2011 (Tandel et
al. 2016), while the share of vacant houses in the total residential stock increased (Figure 1). The
annual growth rate of vacant houses between 1971 to 2011 was 12.7% — 75% faster than the growth
of urban households in the same period. Given that India’s average urban household size is 4.66
people, the vacant stock could house almost 50 million people or around 13% of the urban Indian
population as per the Census of India 2011. The high share of vacant housing is a symptom of larger
inefficiencies in the market and, at the same time, an opportunity to increase housing supply. The
Economic Survey of India of 2017-18, also highlighted some of the issues related to vacant
housing.2
2
Chapter titled “Industry and Infrastructure” in Volume II of the Economic Survey 2017-18.
http://mofapp.nic.in:8080/economicsurvey/pdf/120-150_Chapter_08_Economic_Survey_2017-18.pdf
3Figure 1: Percent vacant and rental houses in urban India
12 11.09 60%
10 50%
53%
Houses in Millions
8 46% 40%
Urban Vacant Housing 6.45
6 % Vacant Houses (RHS) 37% 30%
% Rented Houses (RHS) 4.44 29% 28%
4 20%
2.29
1.83
2 10%
11% 12%
9% 10%
8%
0 0%
1971 1981 1991 2001 2011
Year
Source: Census of India (1971-2011)
A Government of India report estimated that 18.78 million more houses were required to
bridge the housing gap in 2012 (MHUPA, 2012). Most of this shortage is estimated to be due to
congestion, or obsolescence. If brought into the market, the 11 million vacant units could cover a
major portion of the estimated housing shortage. An important caveat here is that there will be a
mismatch between the houses needed to bridge the housing gap, and the vacant houses that may be
brought into the market.
The United Nations (2018) estimates that India will contribute the most (16.5%) to the
increase in the urban population in the world -- followed by China (11.3%) and Nigeria (8.7%) --
between 2015 to 2050. Given the shortages in housing and a booming urban population, studying
vacant housing and creating policies to address it requires urgent attention. Empirical research plays
a critical role in informing this policy discourse with data and analysis, but there has been little
academic research on India’s vacant housing. This paper aims to fill this lacuna by looking at the
reasons for vacant housing in India.
The paper focuses on intentional vacancies in India, i.e., a strategic decision by landlords to
keep housing vacant, and provides two potential reasons for this -- pro-tenant rent control laws and
weak contract enforcement. The negative impact of rent control on housing markets is well
documented in the literature (see Arnott 1988, 1995), but there are very few papers (see Gabriel and
Nothaft 2001), to our knowledge, documenting its possible impact on housing vacancy. The
inefficiency of legal systems in developing countries is potentially an important incentive against
renting out but has not been studied in existing research. This paper is among the first that explicitly
makes the case that state capacity in the enforcement of contracts matters for rental housing market
outcomes. The paper also looks at under-provision of public goods and amenities — hospitals,
schools, colleges, electricity connections, and roads, as a possible reason for vacancy rates at city
and district levels and finds no relationship between the two.
42. Literature Review:
2.1. Definitional aspects of vacancy rates
Housing vacancies can be of two types – “intentional and unintentional vacancies” (Molloy
2016, p. 118) or, as Segú (2020) calls it, voluntary vacancy and frictional vacancy. Frictions in
demand and supply within the housing market lead to some level of “natural” or “structural”
vacancies even in equilibrium – referred to as unintentional vacancy. This exists as people are
mobile and move between cities or locations or houses, leading to a delay in getting a new buyer or
tenant. For cities in the United States, Rosen and Smith (1983) show that when actual vacancy rates
diverge from the natural vacancy rate, price adjustments in the housing market bring vacancy back
to its natural rate.
Intentional vacancies can occur as a rational decision by landlords to keep their units out of
the rental market. Segú (2020) states two reasons for such vacancies in France – price uncertainties
or rent regulations. Uncertainties in future prices could lead to owners delaying their transactions in
the market, especially if the expectation is that prices will go up (ibid.). Further, intentional
vacancies could also be due to regulations that impede changes in rents or if there are restrictions
on contract termination (Gabriel and Nothaft 2001). In such cases, it would be rational to keep the
property vacant.
2.2. Reasons for housing vacancies
Monkkonen (2019) looks at housing vacancy in the 100 largest Mexican cities and finds a
strong positive correlation between housing finance issued by public sector agencies and vacancy
rates. Monkkonen states that government agencies provide the majority of housing finance in
Mexico at rates that are below market value to members of the National Workers’ Housing Fund
(INFONAVIT). Homeowners preferred new construction in the periphery as compared to old
properties in the core (ibid.) Another study corroborated these findings that highlights that
preferences for lending for new housing in the periphery, led to population loss in city centres in
Mexico (Monkkonen and Comandon 2016).
Zhang et al. (2016) estimate that housing vacancies in China’s urban parts can be upwards
of 20%. At the lower end of the income distribution, there is significant unmet demand for housing
due to high housing prices. In contrast the housing market’s luxury segment sees very high vacancy
rates. Zhang et al. attribute high vacancy rates to high-income inequality. They state that since there
are very few options for investments in China, “housing becomes a desirable asset for investment
purposes” (p. 1). They find that a 1% increase in the Gini coefficient leads to a 0.17% increase in
housing vacancies in Chinese cities.
The housing vacancy rate in the UK is less than 4%. Cheshire et al. (2018) study the impact
of restrictive land-use regulations on housing vacancies. The impact of regulations could be due to
two opposite forces – opportunity cost effect or the mismatch effect. The opportunity cost effect is
when restrictive regulations lead to a depletion in housing supply, causing an increase in prices.
5This raises the opportunity cost of keeping a residential unit vacant. The mismatch effect is when
buyers’ preferences do not match the housing supply stock in the restrictive market leading to longer
search periods. Cheshire et al. (2018) find that an increase in regulatory restrictiveness leads to
greater vacancy rates.
There are very few studies that look at vacancy rates in private housing markets in India.
Gandhi and Munshi (2017) study vacancy rates in India, looking at public and private housing
markets. They find high vacancy rates in public housing schemes by the Government of India, a
finding also noted by Pande (2017). This may be due to households’ reluctance to move from slums
in the core areas of the city to government housing in the peripheries, which would result in a loss
in their social networks (see Barnhardt et al. 2017). Gandhi and Munshi find that the low returns on
investments in the private rental market are a possible reason for high vacancy rates in urban India.
They find gross rental yields to be ranging between 2%-4% in most Indian cities.
There is some evidence to back the conjecture that houses that have been purchased as
investments are kept vacant due to low rental yields. Rental yields (rent as a share of property price)
are the returns a landlord can get and are therefore a key determinant in the decision to invest in
rental markets. We use user-contributed data available on Numbeo3 to examine rental yields in
Indian cities. Figure 2 shows that rental yields, defined as “the total yearly gross rent divided by the
house price (expressed in percentages)” for representative Indian cities, are typically below 5% and
range between 2 and 4%. When you compare these risk-free returns (interest rate of fixed deposits),
then these are extremely low. We note that these are gross yields; net yields will be much lower.
These returns are the lowest compared to all other asset classes and therefore create no incentives
for property owners to rent out. Rather, investments in property in India are typically made to gain
from capital appreciation or to conceal black money. Without sufficient rental housing, housing
markets in Indian cities are unable to meet the demand of a significant share of households who may
be unable or unwilling to own homes.
3
Numbeo data is available here https://www.numbeo.com/cost-of-living/
6Figure 2: Rental yields in Indian cities in 2018
5
4.5
4
3.5
3
2.5
2
1.5
1
0.5
0
Mumbai
Chennai
Thane
Delhi
Coimbatore
Kolkata
Visakhapatnam
Goa
Navi Mumbai
Jaipur
Indore
Pune
Chandigarh
Kochi
Bhubaneswar
Ahmedabad
Bangalore
Gurgaon
Hyderabad
Noida
Vadodara
Source: Numbeo
2.3. Literature on resource misallocation
The literature on misallocation and overconsumption of housing due to rent control is vast
(Glaeser and Luttmer 2003; Skak and Bloze 2013). Rent control, which is a non-price rationing
instrument, leads to tremendous misallocation of housing in New York; Glaeser and Luttmer (2003)
compare consumption of housing by different demographic subgroups in a city with free-market
housing and New York, which has a lot of housing under rent control, and estimate that due to rent
control almost 20% of housing in the New York is occupied by households that should not be
residing in it. A high housing vacancy rate reflects a distorted housing market and the fact that land
and capital are being inefficiently utilised. Some research explains how rent control affects the
behaviour of landlords. Diamond et al. (2019a; 2019b) study the impact of the expansion of rent
control in San Francisco and find that rent control affects landlords’ incentives to reduce their supply
of rental housing. Sims (2007) shows that rent control also leads to deterioration of the quality
Boston’s rental properties. Research by Gabriel and Nothaft (2001) shows that restrictions on rent
adjustment lead to greater vacancy rates in the United States. India has a long history of rent control
in urban parts of the country (See Tandel et al. 2016), and we hypothesise that the rent control legacy
disincentivises landlords to rent out their properties, leading to the misallocation of resources, which
we believe is far worse than a mismatch of tenants to units.
7Developing countries are well known to have weak contract enforcement. Weak contract
enforcement in India has been found to impact how firms structure production and have led to high
resource inefficiencies (Boehm and Oberfield 2020). In states with weak contract enforcement
measured by more congested courts, industries move away from relationship-specific contracts or
market-based contracts to a more hierarchical and vertical production process. The rationale for this
is that disputes in market-based contracts will be difficult to resolve in a state with weak contract
enforcement as they would rely on the court system. Similar reasoning could also apply to landlords’
decision to enter into agreements with tenants in states with weak contract enforcement.
We think both rent control and weak enforcement of contracts play a role in shaping
landlords’ incentives to keep units vacant.
83. Strategy and Data:
3.1. Empirical strategy
The paper looks at three possible reasons for vacant housing in India: pro-tenant rent control,
contract enforcement, and under-provision of public goods and amenities. For this, we make use of
vacancy rates at different administrative levels for urban areas only. We do not have data on vacancy
rates by tenure type in India, but we do have overall vacancy rates and tenure type shares at the
district and city levels. We use districts as the unit of analysis in most cases since vacancy data was
available for only 496 of the 7935 cities/towns in the Census 2011. The 496 cities cover 57.02
percent of the urban population; on the other hand, the district level data, which was available for
637 districts, covering 100 percent of the urban population.
We use OLS regressions to establish relationships between the main dependent variable, i.e.,
vacancy rates, and the independent variables discussed below. We control for the proportion of
scheduled castes and tribes population, married population, the proportion of people by religion, by
age groups, by the level of education, workforce participation, the share of female population, the
number of shops, office, educational institutes, and hospitals per person, the number of good,
liveable, and dilapidated buildings per person, mean household size, and the rate of access to
banking services. To control for state-level variations, we use state dummies. The district level’s
overall vacancy rate at the district level for urban areas is the dependent variable in most regressions
we run.
3.2. Vacant housing and tenure data
The main source of data on vacant housing and tenure choice data is the Census of India.
For the latest census released in 2011, the instruction manual for House listing and Housing census
provides the classification of vacant housing as:
“If a Census house is found vacant at the time of House listing, i.e., no person is living in it
and it is not being used for any other non-residential purpose(s) write ‘Vacant’.”4
The Census of India also provides data on tenure, categorising occupied houses as rented or
5
owned. Both vacant housing and tenure data are not available at the individual household level but
are aggregated at the city and district levels. Further, vacant houses in the Census of India are not
classified by tenure, i.e., ownership or rental. For this study, we utilise data from 2011 to develop
cross-sectional analyses, using percent vacant houses of urban housing stock as the dependent
variable.
4
While the manual instructs the enumerator to note the reason for vacancy, the Registrar General of India does not
release this data. Appendix 2 shows the questionnaire in which the enumerator categorises uses of census houses –
these are noted in Column 7.
5
There is also third category “other”, which refers to premises which are neither owned nor rented. This includes
houses provided by an employer rent-free, houses constructed on encroached land, unauthorised buildings, and natural
shelters used as housing. Only 3.30% of houses in urban India are classified thus.
93.3. Rent control variables
We analysed rent control laws from 29 states.6,7 These were obtained from the catalogue of
rent control laws in India in Dev and Dey (2006). This forms the basis of the explanatory variables
used in this section to understand the impact of the rent control laws on vacant housing. The salient
features of rent control laws in India can be found in Appendix 1.
Further, we look at case law to understand the implementation of the various rent control
clauses (used as explanatory variables) to see whether it supports our regression results. We
emphasise highly cited judgments from the High Courts, and Supreme Courts where relevant. We
analyse rent control laws as they were in 2011 for this study. However, nine states have amended
their rental legislation since 2011, and the central government produced a Draft Model Tenancy Act
in 2020. While rental legislation is changing, we must wait for the house-listing census of 2021 to
understand its impact.
The variables used are:
Number of months of non-payment allowed: This is calculated by adding two elements of tenant-
landlord law: the minimum number of months of non-payment before a landlord can begin
eviction proceedings, and the number of months the tenant has to vacate after the landlord or the
rent controller issues a notice for eviction. This period of minimum non-payment varies from no
time at all to five months.8 Laws with longer minimum periods before an eviction can begin are
more pro-tenant than shorter periods.
Rent revision dummy: Landlords in some states in India may set rents as they please with limited
restrictions, but in other states, they are subject to various strict restrictions. In the 19 states
containing 361 districts where there is no restriction on rents, we assign the rent revision dummy a
value of zero. In the remaining 10 states containing 237 districts, the rent revision dummy has a
value of one. A rent revision dummy with a value of one reflects a state with pro-tenant policy.
No occupancy dummy: This variable looks at whether the landlord can evict the tenant if they do
not occupy the unit. It takes the value 0 if it is pro-landlord, i.e., the landlord can evict the tenant in
case of non-occupancy. Twenty states, or 361 districts, have a value of 0. The dummy has the value
one if it is pro-tenant. i.e., if the landlord cannot evict the tenant. Nine states, or 237 districts, take
the value of one. For pro-landlord states, the time stipulated for no occupancy varies from one month
to 12 months.
6
Arunachal Pradesh, Dadra & Nagar Haveli, Manipur, and Lakshadweep Islands had no specific laws governing
rental housing until 2011. In Nagaland, there are no laws defining the relationship between tenants and landlords at
all. We have chosen not to include Chandigarh due to a legal dispute over the applicability of the East Punjab Rent
Restriction Act,1949 over the Union Territory without approval from the central government.
7
Barring Mizoram for which the text of the law was unavailable. In this case, we use the information as noted by Dev
and Dey.
8
These clauses are given in months and fortnights. We find the variable, number of months of non-payment taking the
values of 0, 0.5,1,2,3,4 and 5 with number of districts 26, 42, 46, 202, 128, 17, and 137 respectively.
10Lost title tort dummy: One feature of the Indian real estate market is that disputes of title are common.
Sometimes tenants seek to avoid paying rent by challenging whether their landlord is the true owner of
the property being rented. In some states, should they file such a suit and lose, they may be immediately
evicted—we count these as pro-landlord states. We count states where tenants may not be evicted in the
aftermath of losing such suits as pro-tenant states and give the lost tort dummy a value one. Within our
data, 12 states, containing 255 districts have pro-landlord laws and take the value zero. 17 states
containing 343 districts have pro-tenant laws and take the value one.
We control for the coverage of rent control laws as it does not apply to all properties and areas.
The three main coverage types are geography, age, and value of rent. Since the Rent Control Acts’ stated
aim is to protect tenants, we assume that a clause that gives the Act a broader coverage is pro-tenant.
We use a dummy variable for each, which is assigned a value of 1 if the clause had greater coverage and
hence pro-tenant and 0 if it had a restricted coverage and thus pro-landlord.9 We use these dummies as
control variables to understand the impact of the main rent control variables on vacancy rates. This
approach to coding law for quantitative analysis has been previously used to study labour regulations in
India (see Aghion et al. 2008; Besley and Burgess 2004).
Another gap in the coverage of rent control laws may be due to avoidance. Landlords and
tenants often do not execute lease agreements and instead use “Leave and License” agreements10,
governed by the Easements Act, 1882, which is a central legacy law11. In practice, the distinction
between a lease and a leave and license agreement has been held by the courts to be one of intent
and not the law under which it has been drafted. For example, the Supreme Court in Associated
Hotels Of India Ltd vs R. N. Kapoor (1953)12 held that
“Although the document executed by the parties was apparently in a language appropriate
to a license, the agreement between them, judged by its substance and real intention, as it must be,
left no manner of doubt that the document was a lease.”
The existence of informal or unregistered rental contracts also limits the coverage of rent
control laws. However, little information is available regarding the proportion of informal rentals.
Within this study, we limit our analysis to the formal private housing market.
9
The geography dummy takes the value 1 if the law has jurisdiction over all urban areas and takes the value 0 if it
excluded some urban areas. The age dummy takes the value 1 if the law did not exclude any premise on account of its
age and takes the value 0 if it excluded certain properties. The rent dummy takes the value 1 if no provision for the
exclusion of premises on the basis of the rental value existed in the law and takes the value 0 if it excluded based on
rental values.
10
To account for the same, Maharashtra brought leave and license agreements into the ambit of the rent control act in
1973 – however, it remains the only state to do so.
11
“An easement is a right which the owner or occupier of certain land possesses, as such, for the beneficial enjoyment
of that land, to do and continue to do something, or to prevent and continue to prevent something being done, in or
upon, or in respect of, certain other land not his own” (Chapter 1, Section 4 of the Easements Act, 1882). The
Easements Act is a legacy law governing land and other property that has not been repealed and still governs certain
contracts.
12
1960 SCR 1 368
113.4. Data for contract enforcement:
The state capacity for the enforcement of contracts can be measured by quantifying the
efficacy of the methods of arbitration and mediation over contract disputes. For India, the judiciary
is the formal arbitrator of contractual disputes. However, many indicators have been put forth which
measure the efficiency of the judiciary. Dakolias (1999) used the number of cases filed/disposed of
per year, pendency of cases, congestion rates, average duration of a case and the number of judge
per million inhabitants as measures to compare judiciaries across countries.
The practice of gathering and disseminating data on district level judicial apparatus is a new
one, with the National Judicial Data Grid being launched in 2015. Thus, the first four of Dakolias’
measures are unavailable to us. However, the number of judges has been of frequent interest in the
Parliament and is well documented in the Law and Justice Ministry’s formal answers to
parliamentarians’ questions. We use one such answer13 to infer the number of judges per 1000
people14 at the district level. We use it as an indicator of the effectiveness of the judiciary, and thus
the state capacity for contract enforcement.
Voigt (2016), in his study on judicial productivity, notes that several factors can improve
judicial productivity, one of them being the total number of judges. Some of the other factors he
includes are characteristics of the judges, the complexity of the law, and the complexity of the
judicial system itself. Voigt also notes that increasing the number of judges does not always lead to
an increase in the courts’ efficiency in many countries (ibid.). However, there is empirical evidence
that in India, it is indeed the case that an increase in the number of judges at the district level, leads
to a fall in the number of pending cases (Rao 2019).
Data for district-level tertiary judges are available for 2019, and the population data is from
2011. State-level totals of tertiary judge strength are available for 2012. Therefore, we deflate the
2019 values with a deflator calculated with these totals as a base.15
13
Annexure-I referred to in reply to part (a) of Lok Sabha Unstarred question No. 1101 for answer on 11.12.2013.
See: http://164.100.47.193/Annexture_New/lsq15/15/au1101.htm, accessed July 14, 2020
14
According to ongoing research at Brookings India, the number of cases pending in district courts shows a strong
correlation to the number of judges in the district courts.
15
The vacant housing data is from the Census of India 2011 and we have number of judges at district level from the
Brookings India judiciary data, which is taken from the National Judicial Data Grid, for the year 2019. For 2019, we
do not have data for of Arunachal Pradesh, Nagaland and parts of Meghalaya. We make use of 2012 state-level data
on the number of tertiary level judges to create deflators. The number of judges for 2012 with and without the above
mentioned three states are 14,432 and 14,393 respectively. The number of judges for the year 2019 without the three
states are 15,873. The number of judges from 2012 available at state level was used to deflate the 2019 dataset to
create estimated 2012 district level judges. We realise that there are some loopholes in this methodology, but given the
lack of data, this was the best available data strategy.
124. Vacant Housing: Spatial Trends
Figure 3 shows the share and number of vacant urban houses for 19 major states and union
territories in India. They constitute approximately 96.5% of the total of 11.09 million vacant houses
in urban India. Maharashtra has the highest number of vacant houses (2.1 million), followed by
Gujarat (around 1.2 million) in 2011 (Figure 3). Among all the states and union territories of India,
Goa has the highest share of vacant houses of its residential stock at 31.3%. Among the larger states,
Gujarat has the highest share of vacant houses of the total residential stock (around 19%), followed
by Jammu and Kashmir, Rajasthan, and Maharashtra.
Figure 3: Vacant Houses in major states (urban)
2,500 20
19 18 Vacant houses (in 000's) 18
17
2,000 16 16
%Vacant housing of the total residential stock
(RHS)
15 14 14 14
13 13 13
1,500 12 12
11 11
11 11
10
1,000 8 8
8 8
7
6
500 4
2
- 0
Gujarat
Jammu & Kashmir
Rajasthan
Maharashtra
Haryana
Kerala
Punjab
NCT Of Delhi
Odisha
Karnataka
Chattisgarh
Uttar Pradesh
Jharkhand
Madhya Pradesh
Andhra Pradesh
West Bengal
Bihar
Tamil Nadu
Assam
Source: Adapted from Gandhi and Munshi 2017 and IDFC Institute 2018 using Census of India 2011
The distribution of vacancy rates at the district level shows the median is around 12%.
However, the distribution is right-tailed, with 77 districts having more than 20% of their residential
stock vacant. Almost all of western India has higher residential vacancy rates as compared to India’s
average of 12.38%, as can be noted from figure 4.
13Figure 4: % urban vacant houses across districts.
Source: Census of India 2011, authors’ calculations.
Figure 5 shows the vacant housing situation in major Indian cities, each having more than
30,000 vacant houses. Towns on the outskirts of major cities have the highest proportion of their
residential stock vacant. Greater Noida, which has the highest share of vacant houses (61%), is
classified as a Census Town. Census Towns are areas that have urban characteristics but lack an
urban local body. In practice, Noida, which was created as an Industrial Development Area, is
governed by an industrial development authority. Vasai Virar – which is on the outskirts of Mumbai
– has the second-highest share of vacant houses at 28%. Greater Mumbai has the highest number of
vacant houses (comprising 15% of its residential housing stock), followed by Delhi and Bangalore.
14Figure 5: Vacant houses in major cities
500.0
Vacant houses (in '000s)
60
450.0
%Vacant housing of the total residential stock
400.0 in cities 50
350.0
300.0 40
250.0
30
200.0
150.0 20
100.0
10
50.0
0.0 0
Greater Noida
Vasai-Virar City
Gurgaon
Mira-Bhayandar
Pune
Jammu
Vadodara
Pimpri Chinchwad
Noida
Nashik
Kochi
Surat
Navi Mumbai
Jaipur
Rajkot
Bhopal
Thane
Greater Mumbai
Ghaziabad
Jalandhar
Ahmadabad
Kalyan-Dombivli
Bhubaneswar
Raipur
Guwahati
Bangalore
Delhi MC
Lucknow
Ludhiana
Nagpur
Kanpur
Indore
Kolkata
Hyderabad
Chennai
Source: Adapted from Gandhi and Munshi 2017 and IDFC Institute 2018 using Census of India 2011
Table 1 shows the trends in vacant housing rates in the residential stock for selected metros.
Since 1981, the percentage of vacant housing has been rising for all large cities except Chennai. It
would be interesting to understand the factors that have resulted in a decline in the share of vacant
housing in Chennai. Jaipur has seen a consistent and large increase in the share of the vacant housing
stock of the total residential stock from 5.5% in 1971 to 17.1% in 2011.
Table 1: Trends in percent vacant housing of the total residential stock for selected cities.
Year Jaipur Chennai Ahmadabad Kolkata Mumbai Bangalore
1971 5.5 4.2 8.5 3.0 11.8 6.0
1981 6.4 3.1 9.6 2.5 7.1 5.5
1991 11.7 4.2 13.8 3.2 10.5 9.3
2001 14.4 5.4 19.9 5.5 13.8 9.2
2011 17.1 3.8 15.0 8.2 15.3 12.4
Source: Census of India (various years)
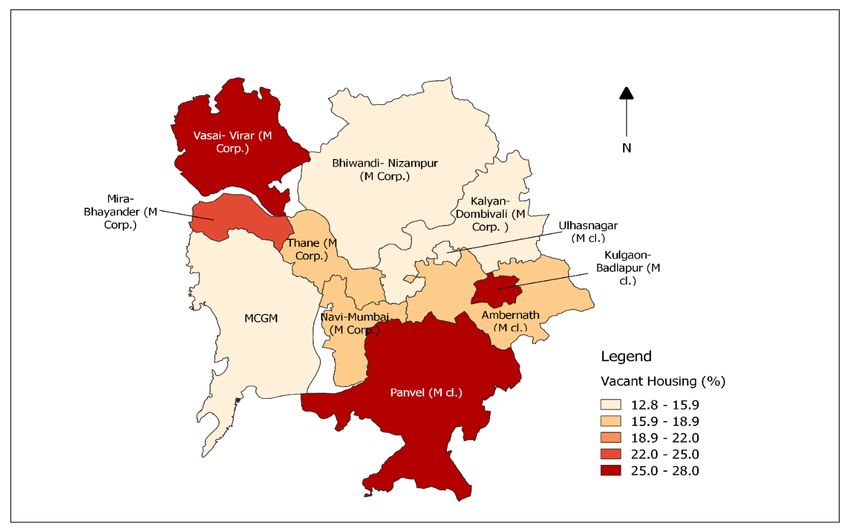
15As mentioned previously, the state of Maharashtra has the highest number of vacant houses
(2.1 million), which make up around 19% of vacant houses in India. The Mumbai Metropolitan
Region (MMR) makes up 44% of the vacant houses in Maharashtra. Figure 6 shows the percentage
of total residential stock that is vacant for all towns and cities in MMR. Vasai Virar, Mira
Bhayandar, Panvel, and Badlapur have more than 20% of its residential stock vacant, which is much
more than the corresponding share in Greater Mumbai.
From Figures 6 and 7, we can affirm that non-primate cities in the periphery of the
metropolitan cities of Mumbai and Delhi have a much higher share of vacant housing. This pattern
of vacant housing could be because housing units have been purchased as investments but not
rented out.
Figure 6: Percent vacant housing of total residential stock for cities in Mumbai Metropolitan Region
Source: Census of India 2011
Note: M. Corp is Municipal corporation, M. CI is Municipal council, MCGM is Municipal
corporation of Greater Mumbai.
16Figure 7: Percent vacant housing of total residential stock for cities in Delhi Region
Source: Census of India 2011
Figure 8 shows the returns to landlords from investing in real estate in selected cities. These
returns are a combination of price appreciation and rental yields. Per year price appreciation is
computed using Residex between 2007 to 2015 (IDFC Institute 2018) and rental yields are from
Numbeo for the year 2015. For almost all cities, cumulative returns are higher than risk-free returns
provided by fixed deposits. However, the rental yields form a small portion of the returns from
investing in a property.
Renting one’s property also involves risk, sources of which we discuss in this paper. We see
that only property in Chennai can beat the returns from investing in gold, via price appreciation
alone. Perhaps the risk-adjusted rental yields are so low that rational landlords leave homes vacant
– preferring to avoid the risks involved in renting out a property altogether. We believe that in a
risk-free market, a rational landlord will rent out his property to realise rental yields.
17Figure 8: Annual returns of landlords by investing in real estate in selected cities
25.00
Residex YoY growth
(between 2007-2015)
20.00
Gross rental yield
(2015)
15.00
13.73
10.79
10.00
8.25
5.00
0.00
Chennai
Pune
Mumbai
Ahmedabad
Gold
Bhopal
Kolkata
Lucknow
Bhubaneswar
Indore
Coimbatore
Surat
Sensex
Delhi
Guwahati
Nagpur
Vijayawada
Chandigarh
Fixed Deposit
Bengaluru
Hyderabad
Jaipur
Kochi
-5.00
Source: Residex from NHB; Numbeo and IDFC-Institute 2018.
Note: Hyderabad and Kochi saw a fall in Residex between 2007 to 2015.
5. Distortions in the Housing Market
Rosen and Smith (1983) demonstrated that just as “natural” unemployment rates characterise
labour markets, natural vacancy rates characterise housing markets. The natural vacancy rate is the
equilibrium rate—that is, it is the rate at which real rents neither rise nor fall. The natural rate is not
zero because the housing market contains frictions, particularly concerning search and matching.
The natural vacancy in the US is around 7-8% for rental housing (Gabriel and Nothaft 1988, Florida
2018) and around 2% for ownership housing (Florida 2018), and this nets to around roughly 5% for
the overall housing market. Anything between 4 to 6% is said to be acceptable if ownership and
rental housing have an equal composition (Mallach 2018).
Search and match issues increase with turnover—when people move from one housing unit
to another, they create, at minimum, a short period of vacancy, as units are rarely filled the instant
they are vacated. A series of papers (e.g., Rosen and Smith 1983, Eric and John 1996, Amy, Ming
and Yuan, 2000, Komai 2001) show that a higher turnover leads to higher natural vacancy.
Therefore, one would expect that a well-functioning housing market would have higher vacancy
among renters, whose leases are finite, than owners, whose leases are in perpetuity. Indeed,
American Community Survey Data and Current Population Survey data show that (1) length of
18tenure in owner-occupied houses is much longer than in rental units16 and (2) vacancy rates among
rental units are much higher than among owner-occupied units.17 Hence, it would follow that places
that relied more on rental housing would have higher overall housing vacancy rates than those that
relied on owning.
Table 2: Relationship between rental and vacancy rates
(1) (2) (3) (4) (5) (6)
VARIABLES Dep. variable = % vacant
% rented 0.0565 -0.0903*** 0.00131 -0.0524* -0.109*** -0.0310**
(0.0519) (0.0225) (0.0210) (0.0278) (0.0165) (0.0148)
Constant 11.74*** -106.2** -47.53 14.29*** 39.71** 2.750
(1.613) (51.91) (50.04) (1.877) (16.54) (13.19)
District controls N Y Y N Y Y
State dummy N N Y N N Y
Administrative unit Districts Districts Districts Cities Cities Cities
Observations 637 637 637 496 494 494
R-squared 0.018 0.762 0.853 0.078 0.706 0.790
Note: Dependent variable is the proportion of census houses vacant. Controls for columns (2) and (3 include the proportion of scheduled
castes and tribes, marriage, the proportion of people by religion, by age groups, by education, workforce participation, the share of the
female population, the number of occupied buildings used as residences, residence cum other use, shops, office, educational institutes,
and hospitals per person, the number of good, liveable, and dilapidated buildings per person, mean household size, and the rate of access
to banking services.The suppressed categories for the share of married persons, women, occupied buildings, religion, age group, and
education are the share of never-married persons, men, buildings used for residence as well as other non-residential use, Hindus, people
aged 0-4, and illiterates, respectively. Mean household size and marriage data were unavailable at the city level – these controls are
removed for columns (5) and (6).18 . Imphal (Manipur) does not have rental housing data in a neat form, and hence the dependent
variable could not be computed for it. Control variables were unavailable for the cities of Kapurthala (Punjab), Faizabad (UP), and
Imphal (Manipur). Robust standard errors clustered at state-level in parentheses * p < 0.10, ** p < 0.05, *** p < 0.01.
This is not the case in India. Table 2 presents regression results looking at the covariation of
rental share and vacancy by district and cities in India. In columns 1 and 4, with no controls, we see
no relationship and a negative relationship significant at 10%, respectively, between vacancy and
rental housing. In columns 2 and 5, with controls, we see that a 1% increase in rental housing is
associated with a 0.0903% and 0.109% fall in vacancy rate, respectively, with a coefficient that is
significant at the 1% level of confidence. When we add state dummies in column 3, the coefficient
is insignificant and the negative relationship remains for cities in column 6. These are contrary to
16
The median renter in the US in 2018 had lived in their unit for less than three years, while the median owner had
lived in their unit for considerably more than 9 years. The categories in the ACS questionnaire prevent us from
expressing the difference more precisely.
https://data.census.gov/cedsci/table?q=Year%20Householder%20Moved%20Into%20Unit&hidePreview=false&t=Ye
ar%20Householder%20Moved%20Into%20Unit&tid=ACSDT1Y2018.B25038&vintage=2018. Accessed July
19,2020.
17
See https://www.census.gov/housing/hvs/index.html, accessed July 19, 2020.
18
We ran columns 2 and 3 with the same controls as columns 5 and 6 and the coefficient for percent rented did not
change much; they were -0.0981 significant at 1 percent and -0.00176 and insignificant respectively.
19the expected positive relationship between rental share and vacancy. This could reflect the fact that
renters in India have strong tenure security, and hence, lower turnover. While this may benefit the
stability of those in rental units, it also reduces the appeal to property owners for renting out their
units. It may help explain why we have seen a decline in the share of units available for rent in India
over the past five decades.
6. Potential Causes for Vacant Houses
This section highlights some of the potential reasons for an increase in vacant urban houses.
We focus on two critical potential reasons viz. stringent rent controls, and the effectiveness of
enforcement of contracts.
6.1. Rent control –
A rent control law aims to protect tenants by putting a cap on the increase in rent and by
making eviction difficult. Rent controls in India were first introduced in Mumbai/Bombay in 1918
and then in other states of India after the Second World War. Indian rent control laws not only set a
‘standard rent’; they also set out the terms of engagement between landlords and tenants. Under the
Indian federal system, rent control laws are subject to state legislative power in India. We utilise
this natural variance among states to see how specific clauses within these acts may impact vacant
housing, also controlling for any variations in their respective jurisdictions. We expect states with
more pro-tenant rent control laws to result in higher vacancy rates.
20Table 3: Relationship between percent vacant housing and clauses in rent control laws19
(1) (2) (3) (4) (5) (6) (7)
VARIABLES Dep. variable = % vacant
# Months of non-payment allowed 1.045*** 1.118*** 1.523*** 2.025***
(0.266) (0.280) (0.532) (0.634)
Rent revision dummy (1 = Pro-tenant) 1.277** 0.118 -0.462
(0.590) (0.936) (0.934)
No occupancy dummy (1= Pro-tenant) -0.824 -0.838 -1.689**
(0.841) (0.752) (0.739)
Lost title tort dummy (1=Pro-tenant) -1.085** 1.705 2.194*
(0.500) (1.170) (1.196)
Geo. Coverage (1= Pro-tenant) -0.267 -0.00576 -0.147 -0.553 -0.492 -0.194 0.333
(0.841) (0.906) (0.878) (0.882) (0.893) (0.911) (0.870)
Rent Coverage (1= Pro-tenant) 1.573* 1.319 -0.161 -0.264 0.0831 1.875** 1.565*
(0.844) (0.921) (0.691) (0.690) (0.740) (0.859) (0.829)
Age Coverage (1= Pro-tenant) -3.203*** -0.584 -2.003* -1.679 -1.516 -4.185*** 2.606
(0.923) (2.054) (1.101) (1.043) (1.042) (1.170) (2.171)
Age Cov*Months of non-payment -0.985 -2.692***
(0.771) (0.909)
Constant -85.01 -82.24 -71.53 -97.01* -82.06 -100.6* -112.8*
(61.93) (63.85) (59.95) (55.32) (60.78) (57.16) (57.86)
District Controls Y Y Y Y Y Y Y
Observations 598 598 598 598 598 598 598
R-squared 0.782 0.784 0.769 0.767 0.768 0.788 0.795
Note: Dependent variable proportion of households with vacant housing. Controls include the proportion of scheduled castes and
tribes, marriage, the proportion of people by religion, by age groups, by education, workforce participation, the share of the female
population, the number of occupied buildings used as residences, residence cum other use, shops, office, educational institutes, and
hospitals per person, the number of good, liveable, and dilapidated buildings per person, mean household size, and the rate of access
to banking services. The suppressed categories for the share of married persons, women, occupied buildings, religion, age group, and
education are the share of never-married persons, men, buildings used for residence as well as other non-residential use, Hindus,
people aged 0-4, and illiterates, respectively. Missing districts consist of 39 districts from Arunachal Pradesh, Chandigarh, Dadra
and Nagar Haveli, Lakshadweep Islands, Manipur, and Nagaland, rent control acts for these states were unavailable. Further, three
districts – Kinnaur, Lahul & Spiti, and Nicobar – had missing values for vacant housing. All regressions are for urban areas only
with population weights at the administrative unit level. Robust standard errors clustered at state-level in parentheses. * p < 0.10, **
p < 0.05, *** p < 0.01
Table 2 presents how various rent control measures, individually and collectively, influence
housing vacancy by district in India. Columns 1, 2, 6, and 7 imply that each month a tenant is
protected from eviction while not paying rent is associated with a minimum one percentage point
increase in vacancy. In columns 1 and 6, we find that when more properties based on the age criteria
fall under the ambit of rent control protection, vacancy is reduced. When interacted with the number
of months of non-payment, the age coverage is not significant (columns 2 and 7). When we include
all rent control variables (column 7), we see that the interaction term is significant and negative.
19
We primarily make use of district-level variables because vacancy data at the city level is only available for 497
cities. The rent control variables are taken from state acts, and these cities coverage of the states are not similar to that
of the districts.
21This suggests that the impact on vacancy of more permissive laws with respect to how long tenants
may not pay rent without being evicted, is attenuated in places where all buildings are covered by
rent control. Perhaps this is because the application of rent control on new buildings discourages
new supply, and hence reduces vacancy.
Column 3 in Table 3 shows that, by itself, a limitation on landlords’ ability to raise rent
freely pushes up vacancy; this impact loses statistical significance, however, when other rent control
variables are included in columns 6 and 7. The “No occupancy” dummy does not have a significant
impact in column 4 and a negative and significant impact in column 7 on housing vacancy rate.20
The eviction after denial of title variable surprisingly has a negative and significant impact on
housing vacancy rates.
Taking our results in sum, we see that only the pro-tenant rent control clauses that affect
returns of landlords are associated with higher housing vacancy rates. Column 7 reports a
specification of all rent control variables, and they are jointly significant (F (8, 28) =10.03). When
we do a comparative statics exercise, and move all rent control variables from less restrictive to
more by one standard deviation, we find vacancy rises by 4.1 percentage points. Given that mean
vacancy is 12 percent, this is quite substantial.
6.2. Enforcement of contracts
According to the World Bank’s Ease of Doing Business Index, it took an average of 1,445
days to enforce a contract in India, which is fifth from the bottom out of 190 countries.21 An efficient
judiciary can resolve contractual disputes, quickly creating an enabling environment to enter into
formal contracts; an inefficient one means that fewer contracts are entered into (Voigt 2016).
One way to improve the efficiency of the judiciary system is by increasing the number of
judges (ibid.).22 Hazra & Micevska (2004) look at the Indian legal system and find that the number
of judges at the district level has a significant impact on case resolution in India and thus reduces
congestion in the system.23 Further evidence is provided in Rao (2019), finding that every additional
judge appointed reduced backlog by 6%. Without enough judges, the judiciary is burdened with
high caseloads, affecting state capacity to enforce contracts. This makes it expensive and time-
consuming to enforce a rental contract, and hence landlords prefer to not rent out their property,
leading to higher vacancy rates.
20
We ran a regression to see if the variance in time stipulated affects the vacancy rate. We find that the coefficient is
positive but not significant. The number of months is not available for the state of Mizoram, since we could not access
the original text of the law.
21
The detailed report can be found here :
https://www.doingbusiness.org/content/dam/doingBusiness/country/i/india/IND.pdf
22
Voigt (2016) lists several factors that can improve judicial productivity, one of them being the total number of
judges. Some of the other factors include characteristics of the judges, the complexity of the law, and the complexity
of the judicial system itself.
23
Increasing the number of judges does not always lead to an increase in the efficiency of the courts in many
countries (Voigt 2016).
22We make use of the number of judges at the district-level tertiary court as the main
explanatory variable. As these courts serve both urban and rural jurisdictions, we create two
different variables – the number of judges per 1000 urban population in the district and, the number
of judges per 1000 total (urban and rural) population in the district. We run separate regressions in
Table 4 using both these variables. We find a significant and negative coefficient of the number of
judges on percent vacant housing with state dummies.
This result is consistent with the hypothesis that an absence of capacity to enforce contracts
undermines the working of a rental market and incentivises owners/landlords to keep their property
vacant. Even if judges uphold landlords’ rights, if it takes several years for them to do so, potential
landlords might prefer to keep their housing units vacant and avoid the problem of any legal dispute
with their tenants.
Table 4: Relationship between vacancy rates and number of courts
(1) (2) (3) (4)
VARIABLES Dep. variable = % vacant
Judges per 1000 persons (total) -48.42 -42.93**
(29.59) (19.15)
Judges per1000 persons (urban) -16.22*** -9.947*
(5.575) (5.017)
Constant -108.8* -53.29 -108.5* -48.23
(57.22) (48.95) (56.86) (49.56)
District controls N Y N Y
State dummy N Y N Y
Observations 580 580 580 580
R-squared 0.759 0.856 0.762 0.856
Note: Dependent variable proportion of percent vacant houses. Controls include the proportion of scheduled castes and tribes,
marriage, the proportion of people by religion, by age groups, by education, workforce participation, the share of the female
population, the number of occupied buildings used as residences, residence cum other use, shops, office, educational institutes, and
hospitals per person, the number of good, liveable, and dilapidated buildings per person, mean household size, and the rate of access
to banking services. The suppressed categories for the share of married persons, women, occupied buildings, religion, age group, and
education are the share of never-married persons, men, buildings used for residence as well as other non-residential use, Hindus,
people aged 0-4, and illiterates, respectively. All regressions are for urban areas only with population weights at the district level.
There are 60 missing districts; there was no data available for districts in Andaman & Nicobar Islands (3), Arunachal Pradesh (16),
Bihar (1), Chhattisgarh (2), Dadra and Nagar Haveli (1), Gujarat (1), Himachal Pradesh (2), Lakshadweep(1), Maharashtra (3),
Manipur(1), Meghalaya (7), Mizoram (6), Nagaland (11), Puducherry (4), and West Bengal (1). The judicial districts of Andaman
and Nicobar Islands, Puducherry, and Mumbai have been dropped since the data is unavailable at the Census District level. Robust
standard errors clustered at state-level in parentheses. * p < 0.10, ** p < 0.05, *** p < 0.01
237. Alternate Explanation – Public Goods and Vacancy Rates
Thus far, we have shown stringent rent controls and enforcement of contracts as the main
reasons for high vacancy rates in Indian cities. In this section, we discuss some alternative
explanations for understanding the phenomenon of high vacancies.
An important stylised fact is that non-primate cities in the periphery of the core metropolitan
cities of Mumbai and Delhi have a much higher share of vacant housing. From figures 6 and 7, we
can affirm that Vasai Virar, Mira Bhayandar, Panvel and Badlapur, and Gurgaon and Greater Noida,
have higher residential stock vacant than the core cities of Greater Mumbai and New Delhi in the
metropolitan regions. It could indicate that houses are bought as investments and therefore not let
out or occupied by the owner. Another hypothesis is that smaller municipal bodies around the core
cities have a lower capacity in delivering services (see Pethe 2013, Sivaramakrishnan 2014). Poor
public amenities could lead to vacant housing units. Households purchase homes on the outskirts of
big cities to make potential returns in the form of price appreciation but are unable to rent them out
due to low demand. The low rental demand in the areas is due to no or poor amenities.
To test this hypothesis, we make use of schools, colleges, hospitals, length of good quality
road (pucca) road, and electricity connections from the Census of India to see if there is a
relationship between these variables and vacancy rates. We normalise these public amenities by
urban population for variables of colleges, schools and hospitals, urban households for electricity
connections, and urban areas of the district and the area of the city for variables related to pucca
road. Table 5 shows there is no or weak relationship between housing vacancies and public
amenities. We run an F-test where the null hypothesis is that the impact of all measured amenities
is jointly equal to zero. Our test statistic implies that we may not reject that null at any standard level
of confidence.
24Table 5: Relationship between vacancy rates and public goods
(1) (2) (3) (4)
VARIABLES Dep. Variable = % vacant
# Colleges per 1000 persons 3.377 9.259* 2.342 6.721
(5.667) (4.678) (5.608) (4.257)
# Schools per 1000 persons 0.403 -0.110 0.588* -0.139
(0.297) (0.250) (0.330) (0.429)
# Hospitals per 1000 persons -0.865 -0.686 1.334 -1.395
(0.692) (0.495) (4.186) (3.602)
# Domestic electricity connections per
household -0.0199 0.162 -1.105** -1.242***
(1.261) (0.921) (0.494) (0.384)
Road density per Sq. Km. -0.0899** -0.00916 -0.00979 -0.00335
(0.0345) (0.0380) (0.00633) (0.00340)
Constant -107.9* -48.82 -16.62 -7.609
(60.73) (54.36) (21.66) (10.82)
State Dummy N Y N Y
Administrative Unit Districts Districts Cities Cities
Observations 602 602 379 379
R-squared 0.766 0.860 0.674 0.788
Note: Dependent variable is the percent of vacant houses. Controls for column (2) and (3) include the proportion of scheduled castes
and tribes, marriage, the proportion of people by religion, by age groups, by education, workforce participation, the share of the
female population, the number of occupied buildings used as residences, residence cum other use, shops, office, educational institutes,
and hospitals per person, the number of good, liveable, and dilapidated buildings per person, mean household size, and the rate of
access to banking services. Mean household size and marriage data were unavailable for at the city level – these controls are removed
for regressions (3) and (4).24 All columns are for urban areas only with population weights at the administrative unit level. There are
38 missing districts from Andaman and Nicobar Islands (1), Arunachal Pradesh (16), Himachal Pradesh (2), Maharashtra (1),
Manipur (4), Mizoram (1), NCT of Delhi (2), and Nagaland (11) as public good and amenities, and/or vacancy data were unavailable.
Vacancy data was available for only 497 of the 7935 cities/towns in census 2011. Public goods data was unavailable for 115 missing
cities in columns (3) and (4) from Assam (1), Bihar (1), Chhattisgarh (9), Gujarat (30), Haryana (3), Madhya Pradesh (8), Mizoram
(1), Nagaland (1), NCT Of Delhi (15), Tamil Nadu (32), Tripura (1) and West Bengal (13). Control variables were unavailable for
the cities of Kapurthala (Punjab), Faizabad (UP), and Imphal (Manipur). The 379 cities cover 42.9% percent of the urban population.
The suppressed categories for the share of married persons, women, occupied buildings, religion, age group, and education are the
share of never-married persons, men, buildings used for residence as well as other non-residential use, Hindus, people aged 0-4, and
illiterates, respectively. Robust standard errors clustered at state-level in parentheses. * p < 0.10, ** p < 0.05, *** p < 0.01
8. Policy Recommendations
This section discusses the deficiencies in the data available for India and ways to improve
data collection and reporting. It then focuses on potential policy responses for India, while also
looking at the experience of some cities/countries in implementing these policies.
8.1. A data plan for India
A major challenge faced during this study was the lack of a comprehensive database of
vacant houses. The census is the only database that counts vacant houses, but it lacks in three major
fronts – geographical depth, reasons for the vacancy, and frequency. We recommend that the
24
We ran columns 1 and 2 with the same controls as columns 3 and 4 and the same variables continue to remain
significant with not too much change in the coefficient values.
25You can also read