Illinois Modeling Users Group Quarterly Meeting - Feb 2021
←
→
Page content transcription
If your browser does not render page correctly, please read the page content below
Illinois Modeling Users Group
       Quarterly Meeting
            Feb 2021
Agenda
1.   Update on the ILSTDM phase II – Sheng Chen & Steve Tuttle

2.   COVID-19 impact on regional travel and traffic patterns – Sun-Gyo Lee & Rafsun Mashraky

3.   CUUATS land use model and integration with the Travel Demand Model (TDM) – Rafsun Mashraky

4.   Travel demand modeling for future scenarios– Shuake Wuzhati

5. Discussion of ILMUG member modeling needs
COVID-19 and Transportation
        Modeling
      A Review of Contemporary Research
Observed Changes during the Pandemic
Reduced Vehicle Miles Traveled

                                                                             Source: Brookings Analysis of FHA data.
          url- https://www.brookings.edu/research/coronavirus-has-shown-us-a-world-without-traffic-can-we-sustain-it/
Higher Perception of Risk for Shared Modes

              Source: How is COVID-19 reshaping activity-travel behavior? Evidence from a comprehensive survey in Chicago
                             url- https://www.sciencedirect.com/science/article/pii/S2590198220301275?via=ihub#bb0105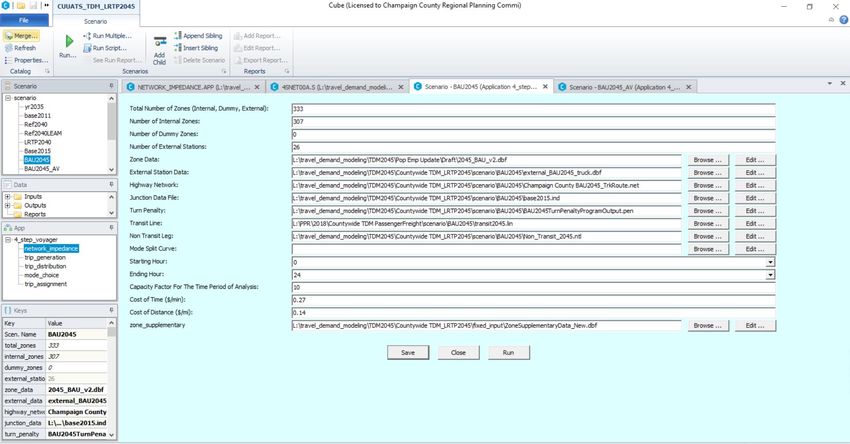
Increased use of Active Transportation

                       Source: How did outdoor biking and walking change during COVID-19?: A case study of three U.S. cities
                                            url- https://journals.plos.org/plosone/article?id=10.1371/journal.pone.0245514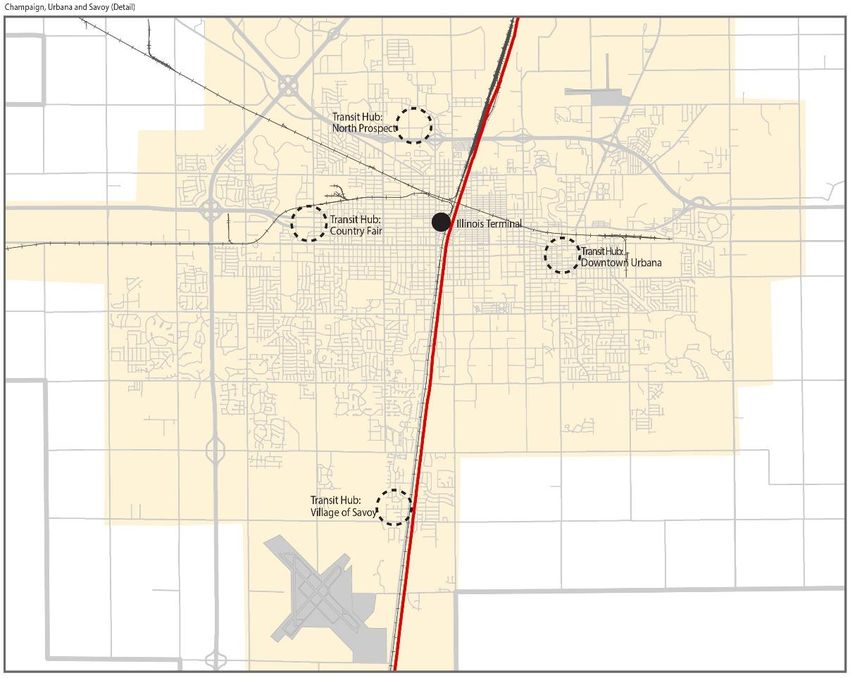
Future Predicted Trends
UIC Research
• Sample distribution of how likely the respondents are to do (a) online grocery
  shopping or (b) ordering food online more frequently in the future as compared
  to the before-pandemic routines.

                                   Source: How is COVID-19 reshaping activity-travel behavior? Evidence from a comprehensive survey in Chicago
                                                  url- https://www.sciencedirect.com/science/article/pii/S2590198220301275?via=ihub#bb0105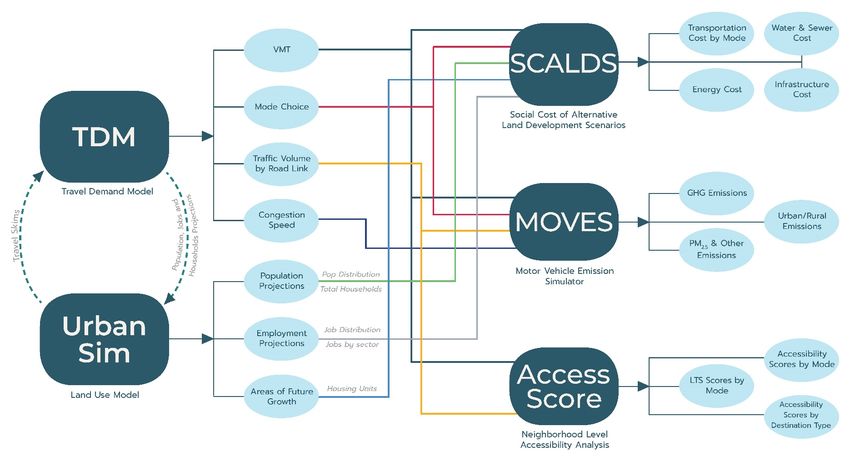
Accelerating pre-existing trends

                  Source: Planning for a Post-Pandemic Economy and Transportation: Implications for Transportation and Economic Models
                      url- https://tredis.com/recordings/2020/Adjustments_to_Transportation_Planning_for_a_Post_Pandemic_World.pdf
Decelerating pre-existing trends
Source: Planning for a Post-Pandemic Economy and Transportation: Implications for Transportation and Economic Models
url- https://tredis.com/recordings/2020/Adjustments_to_Transportation_Planning_for_a_Post_Pandemic_World.pdfTransportation Implication
Variable Potential Change
+ (Likely Growth) - (Likely Loss) ? (Mixed)
Trip Generation Freight delivery, Commuting, trip
personal travel chaining
Mode Split Ped, bike, truck Transit, rideshare, Cars
aviation
Origin-Destination To/from residential, To/from office
Distribution warehouse, daytrip areas, retail areas,
recreation areas airports
Trip Distance Inter-regional
trucks, vacation car
trips
Time Period Off-peak Peak (“rush hour”)
Source: Planning for a Post-Pandemic Economy and Transportation: Implications for Transportation and Economic Models
url- https://tredis.com/recordings/2020/Adjustments_to_Transportation_Planning_for_a_Post_Pandemic_World.pdfFuture Research Directions
Future Research Topics
• “Home Workability” as a critical factor related to residential location
  preferences.

• Potential shift from usage of shared mobility options such as pooled
  ridesharing and transit services to modes that avoid contact—such as
  walking, biking, using scooters, and personal vehicles.

• Promotion of sustainable and safe modes of travel to prevent further
  car-dependency.
                                Source: How is COVID-19 reshaping activity-travel behavior? Evidence from a comprehensive survey in Chicago
                                               url- https://www.sciencedirect.com/science/article/pii/S2590198220301275?via=ihub#bb0105
Going Forward
• Should DOTs and MPOs apply new scenarios for long range planning
and risk analysis?
• Should agencies adjust travel model assumptions (mode, time-of-day,
spatial distribution)?
• Should agencies rethink the public transport planning models?
Source: Planning for a Post-Pandemic Economy and Transportation: Implications for Transportation and Economic Models
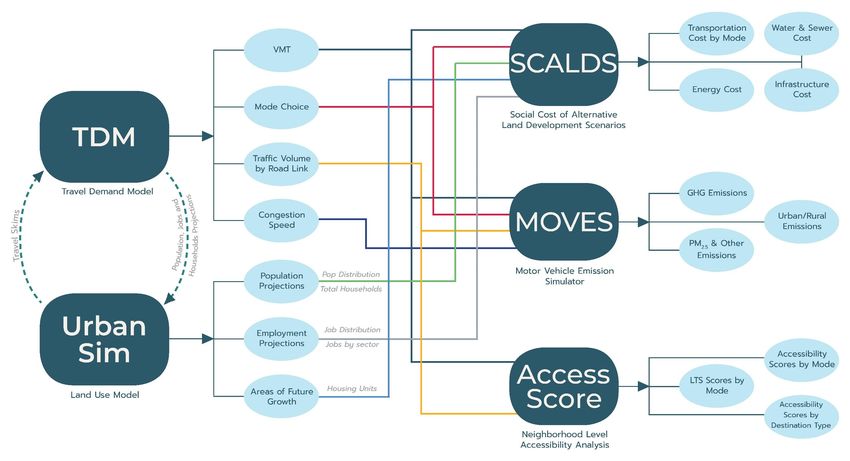
url- https://tredis.com/recordings/2020/Adjustments_to_Transportation_Planning_for_a_Post_Pandemic_World.pdfCUUATS Modeling Suite
UrbanSim An urban simulation system Simulates the key decision makers and choices impacting urban development The model explicitly accounts for land, structures, and occupants
Purpose of the model Predicting land use information for input to the travel model Predicting the effects of changes in land use regulations on land use Predicting the possible effects of changes in demographic composition on land use Projecting population and employment for each simulation year
UrbanCanvas Modeler A web-based platform to generate long-range, small area socioeconomic forecasts using UrbanSim Census block-level cloud platform for LRTP 2045
UrbanSim Model Schema
Cloud Platform: Input and Output for Block model

                         Core base year data
  User uploaded data                                    Outputs
                              (built-in)
 • HH Control totals    • Census blocks          • HH by income, size,
 • Employment           • Building types           age
   Control Totals       • Residential units by   • Employment by
 • Travel Model Zones     type                     industry
   (TAZs)               • Disaggregate           • Dwelling units by
 • Travel Model Skims     households data          type
 • Regional Zoning      • Disaggregate
                          persons data
                        • Disaggregate jobs
                          data
Cloud Platform: Output from Block model - Sets of output for each simulation year (i.e., 2016 to 2040) - Outputs are summarized at block level or coarser (i.e., TAZs, block groups) - Each agent (HH, person, job) is assigned to a census block
Issues with Cloud Platform Addressing the group quarter population TAZ aggregation: heavily relied on spot checks and manual adjustments More flexible use of regional zoning/control
UrbanSim Parcel Model In a block-level model, space is represented by census blocks, and each agent has a block ID. In a typical parcel-level model, space is represented by buildings and parcels, and each agent has a building ID, and a parcel ID. Each household and job (agents) is assigned to a building, and each building is associated with a parcel. It is the most disaggregate and behaviorally-explicit version of the model system.
Purpose of the Parcel model Same as block-level More specific and easier to reaggregate into coarser geographic levels
Input and Output for Parcel model
  User uploaded         Core base year
                                                  Outputs
       data                  data
• HH Control totals   • Parcel record       • HH by income,
• Employment          • Buildings record      size, age
  Control Totals      • Area per job        • Employment by       - Sets of output for each
• Travel Model        • Establishments        industry              simulation year (i.e. 2016 to
  Zones (TAZs)        • Building types      • Dwelling units by     2040)
• Travel Model                                type                - Outputs are summarized at
                      • Residential units
  Skims                 by type                                     parcel level or coarser (i.e.
• Regional Zoning     • Disaggregate                                TAZs, block groups)
                        households data
                      • Disaggregate
                                                                  - User provides the core base
                        persons data                                year data
                      • Disaggregate jobs                         - Each agent (HH, person, job) is
                        data                                        assigned to a building
Visualizing the Model Output The parcel-level outputs are hosted at the CUUATS land use model results site- https://landuse.ccrpc.org/ Model Documentation- https://gitlab.com/ccrpc/land-use-model
Next Steps
Land Use Inventory of Champaign, Urbana, and Savoy
- Create a consistent land use database
- Use Data to update UrbanSim Model
- Create a web portal for data access and updateLand Use Inventory Database
Parcel Building Parking Lot
• Total Area • Number of • Spaces
• Impervious • Stories • Area • Data Collection Method
Surface Area • LBCS Code - Aerial Imagery
• Photos • Footprint - Field Visit (360 images)
• LBCS Code • Construction - Other Secondary Sources
Year (CCGISC, Property Data,
Realtors)
• Per-Sqft Rent
for Non-
Residential
UsesTravel demand modeling
for future scenarios
Shuake Wuzhati, Transportation Engineer II
Champaign County Regional Planning Commission
1Future scenarios
Existing conditions, Literature review, Public input, Expert interviews, Model limitations/capabilities
Trends Goals
✓ Connected/Autonomous Vehicles • Environmentally sustainable transportation
system
✓ Ride-Sharing
• Additional pedestrian and bicycle infrastructure
✓ Lower Fuel Price and improved fuel economy
• Shorter off-campus transit times
✓ Climate change
• Equitable access to transportation services
o Micromobility
• A compact urban area that supports active
o Work from home transportation and limits sprawl development
o System resiliency • …
o … 6Future scenarios
Existing conditions, Literature review, Public input, Expert interviews, Model limitations/capabilities
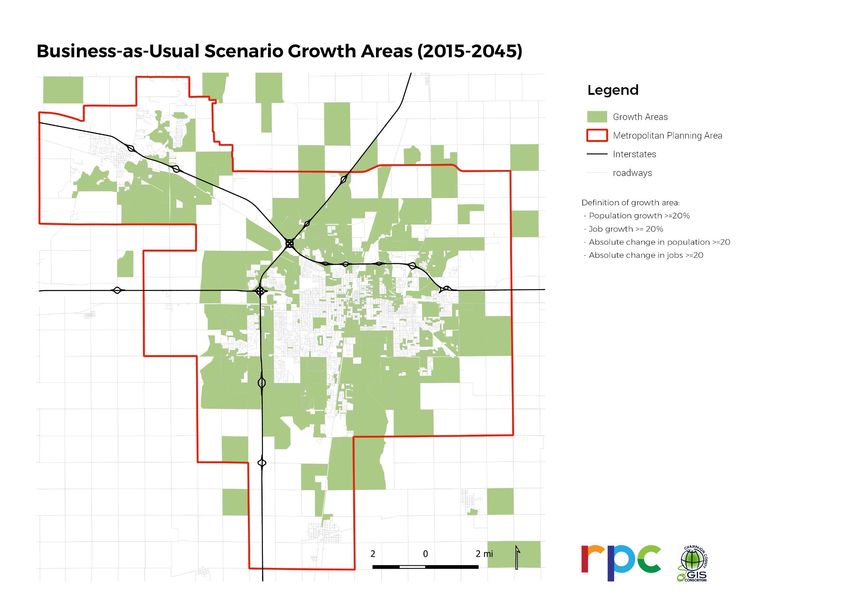
1. Expected Future / Business as usual: based on current conditions and trends*
2. Alternative Futures : “what-if” scenarios
3. Preferred Future: incorporates relatively certain future developments and
transportation system changes as well as Federal, State, and local goals
78
Future scenarios
      Existing conditions, Literature review, Public input, Expert interviews, Model limitations/capabilities

              Trends                                                       Goals

✓ Connected/Autonomous Vehicles                            • Environmentally sustainable transportation
                                                             system
✓ Ride-Sharing
                                                           • Additional pedestrian and bicycle infrastructure
✓ Lower Fuel Price and improved fuel economy
                                                           • Shorter off-campus transit times
✓ Climate change
                                                           • Equitable access to transportation services
o Micromobility
                                                           • A compact urban area that supports active
o Work from home                                             transportation and limits sprawl development
o System resiliency                                        • …
o …                                                                                                     9
10
Source of
Uncertainty
uncertainty
1 Different capacity consumption by CAVs Supply Side
2 Decreased disutility of travel time Demand Side
3 Empty vehicle or ZOV trips Demand Side
4 Induced trip-making Demand Side
Level of car sharing and ridesharing as a
5 Demand Side
substitute for private vehicle use
6 Market penetration and use of AVs Demand Side
7 Overall household vehicle holdings Demand Side
8 Changes to parking locations & behavior Demand Side
9 Temporal shifts in demand Demand Side
10 Different speeds of CAVs Supply Side
Provision of CAV infrastructure (smart
11 Supply Side
signals, dedicated lanes, etc.)
12 Frequency and severity of incidents Supply Side
TNC CAV fleet sizes, depot locations &
13 Supply Side
other operational considerations
Bernardin, Vincent L., et al. A Framework for Modeling Connected and Autonomous Vehicles in The New Michigan Statewide Model, 201711
Source of
Uncertainty CUUATS TDM representation
uncertainty
Presence of AVs with smaller capacity consumption results in 50% capacity increase on
1 Different capacity consumption by CAVs Supply Side
freeways and 10% capacity increase on arterials (WSP).
18% reduction in driver perception of time as drivers can do other things in AVs, thus
2 Decreased disutility of travel time Demand Side willing to travel far. 15% reduction in driver perception of cost of distance due to higher
energy efficiency of C/AVs.
3 Empty vehicle or ZOV trips Demand Side
Increased mobility for the young, elderly, and others currently unable to drive. Partially
4 Induced trip-making Demand Side induced/idling trips. Increase by 25%.
Level of car sharing and ridesharing as a
5 Demand Side Not in BAU. Can be included in the "preferred" AV scenario discussions.
substitute for private vehicle use
Unknown. Assumptions above reflect certain degrees of AV market penetration, which
6 Market penetration and use of AVs Demand Side
cannot be measured in the models.
7 Overall household vehicle holdings Demand Side Not incorporated in the model
8 Changes to parking locations & behavior Demand Side Not incorporated in the model
9 Temporal shifts in demand Demand Side Not incorporated in the model
10 Different speeds of CAVs Supply Side Not incorporated in the model
Provision of CAV infrastructure (smart signals,
11 Supply Side Not incorporated in the model
dedicated lanes, etc.)
12 Frequency and severity of incidents Supply Side Not incorporated in the model
TNC CAV fleet sizes, depot locations & other
13 Supply Side Not incorporated in the model
operational considerations12
13
                                                    Source of
     Uncertainty                                                   CUUATS TDM representation
                                                    uncertainty
                                                                   Presence of AVs with smaller capacity consumption results in 50% capacity increase on
1 Different capacity consumption by CAVs            Supply Side
                                                                   freeways and 10% capacity increase on arterials (WSP).

                                                                   18% reduction in driver perception of time as drivers can do other things in AVs, thus
2 Decreased disutility of travel time               Demand Side    willing to travel far. 15% reduction in cost of distance due to higher energy efficiency of
                                                                   C/AVs.

3 Empty vehicle or ZOV trips                        Demand Side
                                                                   Increased mobility for the young, elderly, and others currently unable to drive. Partially
4 Induced trip-making                               Demand Side    induced/idling trips. Increase by 25%.

     Level of car sharing and ridesharing as a
5                                                   Demand Side    Not in BAU. Can be included in the "preferred" AV scenario discussions.
     substitute for private vehicle use
                                                                   Unknown. Assumptions above reflect certain degrees of AV market penetration, which
6 Market penetration and use of AVs                 Demand Side
                                                                   cannot be measured in the models.
7 Overall household vehicle holdings                Demand Side    Not incorporated in the model
8 Changes to parking locations & behavior           Demand Side    Not incorporated in the model
9 Temporal shifts in demand                         Demand Side    Not incorporated in the model
10 Different speeds of CAVs                         Supply Side    Not incorporated in the model
     Provision of CAV infrastructure (smart signals,
11                                                   Supply Side   Not incorporated in the model
     dedicated lanes, etc.)
12 Frequency and severity of incidents              Supply Side    Not incorporated in the model
     TNC CAV fleet sizes, depot locations & other
13                                                  Supply Side    Not incorporated in the model
     operational considerations
14
15
16
                                                    Source of
     Uncertainty                                                   CUUATS TDM representation
                                                    uncertainty
                                                                   Presence of AVs with smaller capacity consumption results in 50% capacity increase on
1 Different capacity consumption by CAVs            Supply Side
                                                                   freeways (WSP) and 10% capacity increase on arterials (WSP).

                                                                   18% reduction in driver perception of time as drivers can do other things in AVs, thus
2 Decreased disutility of travel time               Demand Side    willing to travel far. 15% reduction in driver perception of cost of distance due to higher
                                                                   energy efficiency of C/AVs.

3 Empty vehicle or ZOV trips                        Demand Side
                                                                   Increased mobility for the young, elderly, and others currently unable to drive. Partially
4 Induced trip-making                               Demand Side    induced/idling trips. Increase by 25%.

     Level of car sharing and ridesharing as a
5                                                   Demand Side    Not in BAU. Can be included in the "preferred" AV scenario discussions.
     substitute for private vehicle use
                                                                   Unknown. Assumptions above reflect certain degrees of AV market penetration, which
6 Market penetration and use of AVs                 Demand Side
                                                                   cannot be measured in the models.
7 Overall household vehicle holdings                Demand Side    Not incorporated in the model
8 Changes to parking locations & behavior           Demand Side    Not incorporated in the model
9 Temporal shifts in demand                         Demand Side    Not incorporated in the model
10 Different speeds of CAVs                         Supply Side    Not incorporated in the model
     Provision of CAV infrastructure (smart signals,
11                                                   Supply Side   Not incorporated in the model
     dedicated lanes, etc.)
12 Frequency and severity of incidents              Supply Side    Not incorporated in the model
     TNC CAV fleet sizes, depot locations & other
13                                                  Supply Side    Not incorporated in the model
     operational considerations
17
18
                                                    Source of
     Uncertainty                                                   CUUATS TDM representation
                                                    uncertainty
                                                                   Presence of AVs with smaller capacity consumption results in 50% capacity increase on
1 Different capacity consumption by CAVs            Supply Side
                                                                   freeways (WSP) and 10% capacity increase on arterials (WSP).

                                                                   18% reduction in driver perception of time as drivers can do other things in AVs, thus
2 Decreased disutility of travel time               Demand Side    willing to travel far. 15% reduction in driver perception of cost of distance due to higher
                                                                   energy efficiency of C/AVs.

3 Empty vehicle or ZOV trips                        Demand Side
                                                                   Increased mobility for the young, elderly, and others currently unable to drive. Partially
4 Induced trip-making                               Demand Side    induced/idling trips. Increase by 25%.

     Level of car sharing and ridesharing as a
5                                                   Demand Side    Not in BAU. Included in the "preferred" AV scenario discussions.
     substitute for private vehicle use
                                                                   Unknown. Assumptions above reflect certain degrees of AV market penetration, which
6 Market penetration and use of AVs                 Demand Side
                                                                   cannot be measured in the models.
7 Overall household vehicle holdings                Demand Side    Not incorporated in the model
8 Changes to parking locations & behavior           Demand Side    Not incorporated in the model
9 Temporal shifts in demand                         Demand Side    Not incorporated in the model
10 Different speeds of CAVs                         Supply Side    Not incorporated in the model
     Provision of CAV infrastructure (smart signals,
11                                                   Supply Side   Not incorporated in the model
     dedicated lanes, etc.)
12 Frequency and severity of incidents              Supply Side    Not incorporated in the model
     TNC CAV fleet sizes, depot locations & other
13                                                  Supply Side    Not incorporated in the model
     operational considerations
19
20
                                                    Source of
     Uncertainty                                                   CUUATS TDM representation
                                                    uncertainty
                                                                   Presence of AVs with smaller capacity consumption results in 50% capacity increase on
1 Different capacity consumption by CAVs            Supply Side
                                                                   freeways (WSP) and 10% capacity increase on arterials (WSP).

                                                                   18% reduction in driver perception of time as drivers can do other things in AVs, thus
2 Decreased disutility of travel time               Demand Side    willing to travel far. 15% reduction in driver perception of cost of distance due to higher
                                                                   energy efficiency of C/AVs.

3 Empty vehicle or ZOV trips                        Demand Side
                                                                   Increased mobility for the young, elderly, and others currently unable to drive. Partially
4 Induced trip-making                               Demand Side    induced/idling trips. Increase by 25%.

     Level of car sharing and ridesharing as a
5                                                   Demand Side    Not in BAU. Included in the "preferred" AV scenario discussions.
     substitute for private vehicle use
                                                                   Unknown. Assumptions above reflect certain degrees of AV market penetration, which
6 Market penetration and use of AVs                 Demand Side
                                                                   cannot be measured in the models.
7 Overall household vehicle holdings                Demand Side    Not incorporated in the model
8 Changes to parking locations & behavior           Demand Side    Not incorporated in the model
9 Temporal shifts in demand                         Demand Side    Not incorporated in the model
10 Different speeds of CAVs                         Supply Side    Not incorporated in the model
     Provision of CAV infrastructure (smart signals,
11                                                   Supply Side   Not incorporated in the model
     dedicated lanes, etc.)
12 Frequency and severity of incidents              Supply Side    Not incorporated in the model
     TNC CAV fleet sizes, depot locations & other
13                                                  Supply Side    Not incorporated in the model
     operational considerations
21
Source of
Uncertainty CUUATS TDM representation
uncertainty
Presence of AVs with smaller capacity consumption results in 50% capacity increase on
1 Different capacity consumption by CAVs Supply Side
freeways (WSP) and 10% capacity increase on arterials (WSP).
18% reduction in driver perception of time as drivers can do other things in AVs, thus
2 Decreased disutility of travel time Demand Side willing to travel far. 15% reduction in driver perception of cost of distance due to higher
energy efficiency of C/AVs.
3 Empty vehicle or ZOV trips Demand Side
Increased mobility for the young, elderly, and others currently unable to drive. Partially
4 Induced trip-making Demand Side induced/idling trips. Increase by 25%.
Level of car sharing and ridesharing as a
5 Demand Side Not in BAU. Included in the "preferred" AV scenario discussions.
substitute for private vehicle use
Unknown. Assumptions above reflect certain degrees of AV market penetration, which
6 Market penetration and use of AVs Demand Side
cannot be measured in the models.
7 Overall household vehicle holdings Demand Side Not incorporated in the model
8 Changes to parking locations & behavior Demand Side Not incorporated in the model
9 Temporal shifts in demand Demand Side Not incorporated in the model
10 Different speeds of CAVs Supply Side Not incorporated in the model
Provision of CAV infrastructure (smart signals,
11 Supply Side Not incorporated in the model
dedicated lanes, etc.)
12 Frequency and severity of incidents Supply Side Not incorporated in the model
TNC CAV fleet sizes, depot locations & other
13 Supply Side Not incorporated in the model
operational considerationsFuture scenarios
Existing conditions, Literature review, Public input, Expert interviews, Model limitations/capabilities
Trends Goals
✓ Connected/Autonomous Vehicles • Environmentally sustainable transportation
system
✓ Ride-Sharing
• Additional pedestrian and bicycle infrastructure
✓ Lower Fuel Price and improved fuel economy
• Shorter off-campus transit times
✓ Climate change
• Equitable access to transportation services
o Micromobility
• A compact urban area that supports active
o Work from home transportation and limits sprawl development
o System resiliency • …
o … 22Future scenarios
Existing conditions, Literature review, Public input, Expert interviews, Model limitations/capabilities
Trends Goals
✓ Connected/Autonomous Vehicles • Environmentally sustainable transportation
system
✓ Ride-Sharing
• Additional pedestrian and bicycle infrastructure
✓ Lower Fuel Price and improved fuel economy
• Shorter off-campus transit times
✓ Climate change
• Equitable access to transportation services
o Micromobility
• A compact urban area that supports active
o Work from home transportation and limits sprawl development
o System resiliency • …
o … 23Future scenarios
Existing conditions, Literature review, Public input, Expert interviews, Model limitations/capabilities
Trends Goals
✓ Connected/Autonomous Vehicles • Environmentally sustainable transportation
system
✓ Ride-Sharing
• Additional pedestrian and bicycle infrastructure
✓ Lower Fuel Price and improved fuel economy
• Shorter off-campus transit times
✓ Climate change
• Equitable access to transportation services
o Micromobility
• A compact urban area that supports active
o Work from home transportation and limits sprawl development
o System resiliency • …
o … 24MOVES: Increased temperature assumptions (Summer high +5.6°F, Winter low +4.2°F ) Umair Irfan, Eliza Barclay, and Kavya Sukumar. Weather 2050. https://www.vox.com/a/weather-climate-change-us-cities-global-warming 25
Future scenarios
      Existing conditions, Literature review, Public input, Expert interviews, Model limitations/capabilities

              Trends                                                       Goals

✓ Connected/Autonomous Vehicles                            • Environmentally sustainable transportation
                                                             system
✓ Ride-Sharing
                                                           • Additional pedestrian and bicycle infrastructure
✓ Lower Fuel Price and improved fuel economy
                                                           • Shorter off-campus transit times
✓ Climate change
                                                           • Equitable access to transportation services
o Micromobility
                                                           • A compact urban area that supports active
o Work from home                                             transportation and limits sprawl development
o System resiliency                                        • …
o …                                                                                                    26
27
Strategy 1: Transit Hubs
Average bus passenger
in-vehicle travel time
60%
Illinois Terminal: a
multi-modal hub
connecting local
Average bus passenger public transit, intercity
wait time 20% transit, & passenger rail.
Four small satellite terminals or mini transit hubs
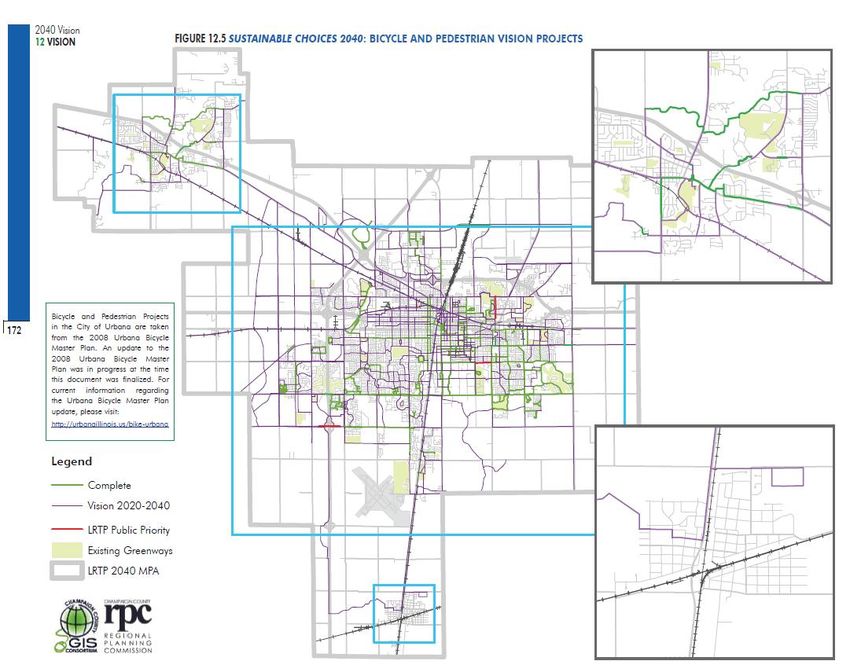
with feeder busesStrategy 2: Active Transportation Network
60lane miles in 2010
Bicycle facilities
410 lane miles in 2040
Sidewalk coverage
50% in 2010
100% in 2040Strategy 3: Higher Parking Fees on Campus
Faculty/ staff
$
parking permit cost 50%Strategy 4: Land Use Strategies Weighted average land use density 4.5% Weighted average land use diversity 12.3%
Strategy 5: High Speed Rail Corridor

Train travel time
to Chicago          65%
Future scenarios
      Existing conditions, Literature review, Public input, Expert interviews, Model limitations/capabilities

              Trends                                                       Goals

✓ Connected/Autonomous Vehicles                            • Environmentally sustainable transportation
                                                             system
✓ Ride-Sharing
                                                           • Additional pedestrian and bicycle infrastructure
✓ Lower Fuel Price and improved fuel economy
                                                           • Shorter off-campus transit times
✓ Climate change
                                                           • Equitable access to transportation services
o Micromobility
                                                           • A compact urban area that supports active
o The Pandemic and work from home                            transportation and limits sprawl development
o …                                                        • …
                                                                                                       33
36 Scenario Results
37

Scenario Results
38

Scenario Results
39

Scenario Results
40

Scenario Results
You can also read