Identifying Communities at Risk for COVID-19-Related Burden Across 500 US Cities and Within New York City: Unsupervised Learning of the ...
←
→
Page content transcription
If your browser does not render page correctly, please read the page content below

JMIR PUBLIC HEALTH AND SURVEILLANCE                                                                                              Deonarine et al

     Original Paper

     Identifying Communities at Risk for COVID-19–Related Burden
     Across 500 US Cities and Within New York City: Unsupervised
     Learning of the Coprevalence of Health Indicators

     Andrew Deonarine, MSc, MHSc, MD, PhD; Genevieve Lyons, MSc; Chirag Lakhani, PhD; Walter De Brouwer, PhD
     XY.ai, Cambridge, MA, United States

     Corresponding Author:
     Andrew Deonarine, MSc, MHSc, MD, PhD
     XY.ai
     56 JFK Street
     Cambridge, MA, 02138
     United States
     Phone: 1 8575000461
     Email: andrew@xy.ai

     Abstract
     Background: Although it is well-known that older individuals with certain comorbidities are at the highest risk for complications
     related to COVID-19 including hospitalization and death, we lack tools to identify communities at the highest risk with fine-grained
     spatial resolution. Information collected at a county level obscures local risk and complex interactions between clinical
     comorbidities, the built environment, population factors, and other social determinants of health.
     Objective: This study aims to develop a COVID-19 community risk score that summarizes complex disease prevalence together
     with age and sex, and compares the score to different social determinants of health indicators and built environment measures
     derived from satellite images using deep learning.
     Methods: We developed a robust COVID-19 community risk score (COVID-19 risk score) that summarizes the complex disease
     co-occurrences (using data for 2019) for individual census tracts with unsupervised learning, selected on the basis of their
     association with risk for COVID-19 complications such as death. We mapped the COVID-19 risk score to corresponding zip
     codes in New York City and associated the score with COVID-19–related death. We further modeled the variance of the COVID-19
     risk score using satellite imagery and social determinants of health.
     Results: Using 2019 chronic disease data, the COVID-19 risk score described 85% of the variation in the co-occurrence of 15
     diseases and health behaviors that are risk factors for COVID-19 complications among ~28,000 census tract neighborhoods
     (median population size of tracts 4091). The COVID-19 risk score was associated with a 40% greater risk for COVID-19–related
     death across New York City (April and September 2020) for a 1 SD change in the score (risk ratio for 1 SD change in COVID-19
     risk score 1.4; P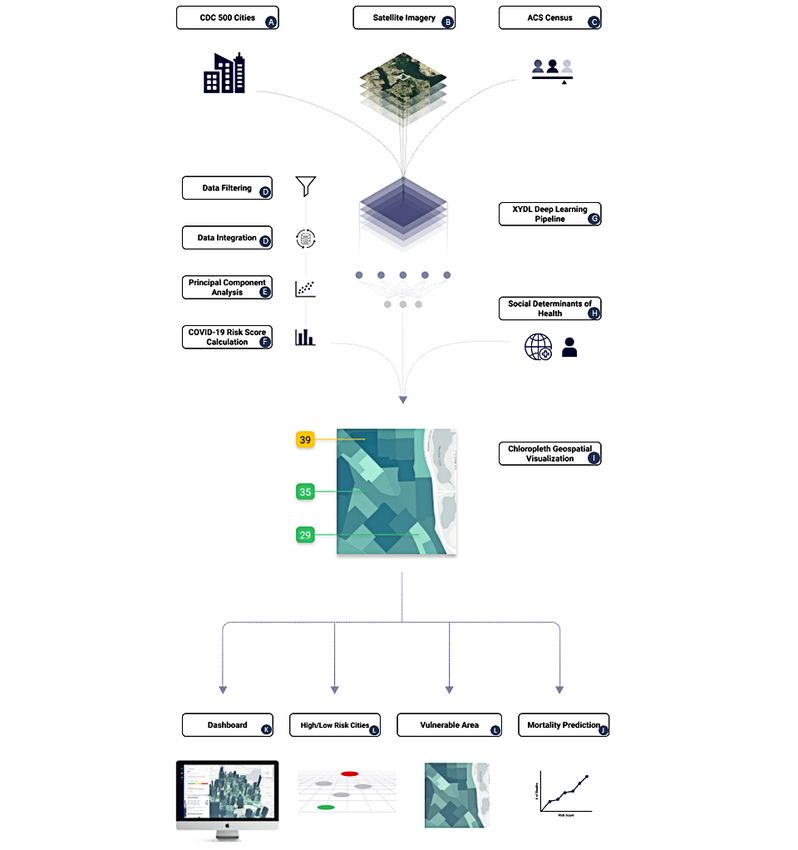
JMIR PUBLIC HEALTH AND SURVEILLANCE                                                                                                Deonarine et al

     mortality, including older age, male sex, impaired lung function,    of health (including the built environment, measured using
     cardiometabolic-related diseases (eg, diabetes, heart disease, or    satellite imagery methods [26]) explained score variance and
     stroke), and obesity. In the United States, comorbidities are        validated the risk score by examining its relationship with zip
     known to cluster in geographies such as the southeast states and     code–level deaths during the late-May 2020 COVID-19
     counties (eg, in chronic disease [12] and in COVID-19 [13-16]),      epidemic in New York City. Last, we deployed the COVID-19
     and are partly mediated by built environment features, such as       risk score with an application programming interface and a
     walkability [17]. Although race and ethnicity have been              browsable dashboard [28].
     identified as risk factors, systemic racism and discrimination
     in the health care system play an important role in this             Methods
     relationship [18-20]. Additionally, racial and ethnic
     discrimination have influenced where individuals reside and          Study Data
     has played a substantial role in the increased morbidity and         We obtained geocoded disease prevalence data at the census
     mortality related to COVID-19 [21]. Other factors including          tract level from the US Centers for Disease Control and
     the built environment and air pollution have been associated         Prevention (CDC) 500 Cities Project (the December 2019
     with COVID-19 infection and complications [22,23], but it has        release, which is based on data from 2016 to 2017 [29]; Figure
     been unclear how to prioritize these associations to prevent         1A). The project 500 Cities contains disease and health indicator
     complications. Both individual-level factors (eg, diabetes,          prevalence for 27,648 individual census tracts of the 500 largest
     smoking, and asthma [3,8,10,11]) and geographical-level social       cities in the United States, and these prevalences are estimated
     determinant factors (eg, census tract–level population density       from the Behavioral Risk Factor Surveillance System [30].
     and increased household occupancy) are strong risk factors for
     COVID-19 infection and risk [24]. Social determinants of health      From the 500 Cities data, we chose 13 population-level health
     are defined as “conditions in the environments where people          indicators that correspond to individual-level chronic disease
     are born, live, learn, work, play, worship, and age that affect a    risk factors associated with COVID-19–related hospitalization
     wide range of health, functioning, and quality-of-life outcomes      and death based on reports from China, Italy, and the United
     and risks” [25]. Social determinants of health can be grouped        States (eg, [3,8,10,11]). Disease indicators include the
     into five domains, including economic stability, education access    prevalence among adults of diabetes, coronary heart disease,
     and quality, health care access and quality, neighborhood and        chronic kidney disease, asthma, arthritis, any cancer, or chronic
     built environment, and social and community context [25].            obstructive pulmonary disorder. We also selected behavioral
     Recently, Maharana and Nsoesie [26] developed an approach            risk factors including smoking and obesity, and the prevalence
     to map the built environment to obesity prevalence using deep        of individuals on blood pressure medication. We chose these
     learning analysis of satellite imagery, highlighting a potentially   comorbidities and risk factors with guidance from the CDC
     novel method of using measurements of the built environment          because they were classed as among the strongest risk factors
     to quantify disease risk.                                            for COVID-19–related hospitalization, intensive care unit use,
                                                                          and death (eg, males and females older than 65 years, diabetes,
     At the time of writing, New York emerged as a location with          heart disease, and stroke); were indicative of risk for
     several COVID-19–related deaths spread across the 2141 census        cardiometabolic disease or impaired lung function, which are
     tracts in the city. Even within city hot spots like New York City,   risk factors for COVID-19 (eg, smoking, obesity, high blood
     common chronic diseases and their risk factors for COVID-19          pressure, high cholesterol, kidney disease, asthma, or chronic
     are geographically heterogeneous and vary per unit of                pulmonary obstructive disorder); or involve pharmacological
     geography, including within and across states, counties, and         interventions that could result in an immunocompromised state
     even cities. It is unclear how the heterogeneity of                  (eg, certain antineoplastic, arthritis, and antihypertensive
     community-based risk or prevalence of diseases at a census tract     medications) [31].
     level (median population sizes of ~3000-5000 individuals) is
     related to COVID-19 risk. Furthermore, analyses on coarser           We further obtained 5-year 2013-2017 American Community
     spatial resolutions will attenuate predictions and associations      Survey (ACS) Census data [32], which contain
     [27].                                                                sociodemographic prevalences and median values for census
                                                                          tracts (Figure 1C), and corresponded to the 2016-2017 CDC
     In this investigation, we sought to create a clinically focused      500 Cities data. We also selected the total number of individuals
     risk score that could be used to predict COVID-19 cases and          in the tract, proportion of males and females older than 65 years,
     deaths within cities, identify hot spots at the subcounty (census    and proportion of individuals by race and ethnicity, which
     tract) level, and identify potentially vulnerable communities,       included African American, Mexican, Hispanic, Asian, and
     and to determine how the social determinants of health and the       White groups from the ACS. Race and ethnicity were examined
     built environment may explain the variance of this clinically        to determine if there were different risks associated with these
     focused risk score and whether the built environment explains        groups (where race is a socially constructed concept that can
     statistically significant amounts of score variance even after       be used as a proxy for the complex interplay of institutional and
     accounting for the social determinants of health. To do this, we     individual-level racism and barriers to health care experienced
     developed the COVID-19 community risk score (COVID-19                by these different groups [33]). These data also included
     risk score) that summarizes the complex comorbidity and              information on socioeconomic indicators including median
     demographic patterns of small communities at the census tract        income, the proportion of individuals living in poverty,
     level. Additionally, we examined how the social determinants         unemployment, cohabitation with more than one individual per

     https://publichealth.jmir.org/2021/8/e26604                                             JMIR Public Health Surveill 2021 | vol. 7 | iss. 8 | e26604 | p. 2
                                                                                                                  (page number not for citation purposes)
XSL• FO
RenderX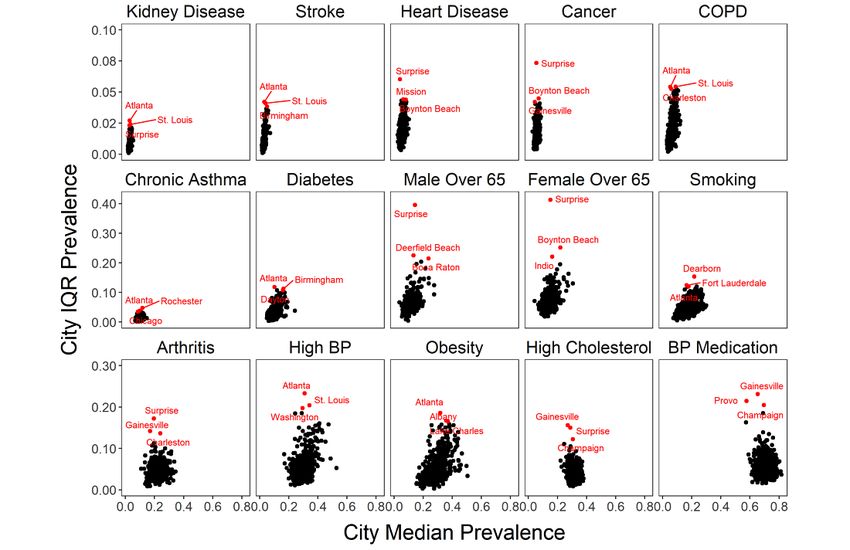
JMIR PUBLIC HEALTH AND SURVEILLANCE                                                                                                            Deonarine et al

     room, and having no health insurance. These measures were                     of infection or mortality associated with COVID-19 [20,34].
     previously identified as possible contributors to increased risk
     Figure 1. Overview of study. (A) CDC 500 Cities; (B) satellite imagery of 500 cities from OpenMapTiles; (C) ACS Census summary statistics for
     each census tract; (D) estimates of prevalence and coprevalence of disease and health indicators for risk of COVID-19 complications; (E) use of principal
     components analysis to reduce dimensionality of diseases and health indicators; (F) construction of COVID-19 score from principal components; (G)
     “XYDL” deep learning pipeline that inputs satellite imagery, social determinants of health indicators from ACS Census data to predict COVID-19
     community risk score; (H) social determinants of health from ACS Census data; (I) visualization of the COVID-19 community risk score; (J) association
     of the COVID-19 risk score with mortality in New York City; (K) creation of a dashboard; (L) mapping highest and lowest risk cities and tracts as a
     function of the risk score. ACS: American Community Survey; CDC: Centers for Disease Control and Prevention.

                                                                                   built environment and social determinants of health.
     Defining the COVID-19 Community Risk Score                                    Understanding if the built environment and social determinants
     Given the complex interplay between the social determinants                   of health can explain the variance of a clinically focused risk
     of health, chronic disease, and the built environment, we sought              score would show that more complex risk models could be built
     to first examine how clinical comorbidities could be used to                  using this data in the future. To do this, we used the statistical
     predict COVID-19 rates by developing a clinically focused risk                programming language R (version 4.0.5; R Foundation for
     score and then examine how these comorbidities relate to the                  Statistical Computing) [35] to merge disease and behavior

     https://publichealth.jmir.org/2021/8/e26604                                                         JMIR Public Health Surveill 2021 | vol. 7 | iss. 8 | e26604 | p. 3
                                                                                                                              (page number not for citation purposes)
XSL• FO
RenderX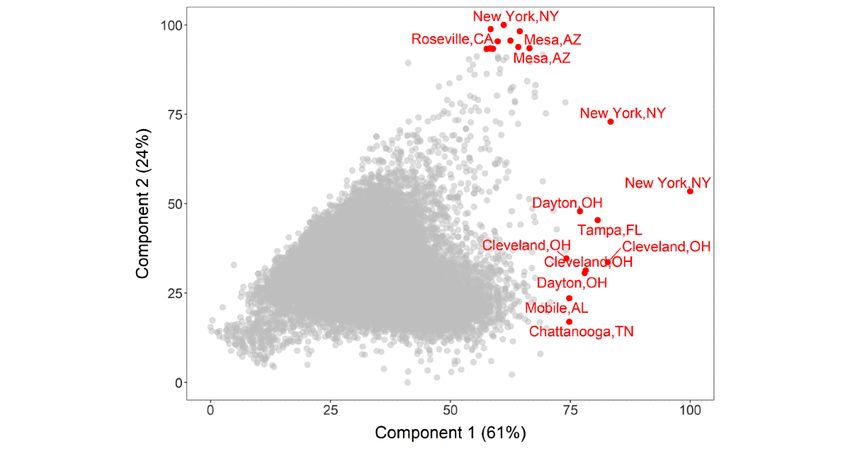
JMIR PUBLIC HEALTH AND SURVEILLANCE                                                                                                Deonarine et al

     prevalence data from the CDC 500 Cities Project for each of          called feature extraction [42] (Figure 1G). The resulting vector
     the 27,648 census with ACS information and calculate their           from this process is a latent space feature representation of the
     Pearson pairwise correlations (Figure 1D) to determine how the       image comprising 4096 features. This latent space representation
     data were correlated with each other. We considered 15 variables     is essentially an encoded (non–human readable) version of the
     in total, including 13 health indicators (eg, diseases and risk      visual patterns found in the satellite images, which, when
     factors), and 2 demographic factors, the proportion of male and      coupled with machine learning approaches, is used to model
     female individuals older than 65 years in the risk score. The        the built environment of a given census tract [26]. For each
     disease prevalence included any form of cancer, arthritis, stroke,   census tract, we calculated the mean of the latent space feature
     chronic asthma, chronic obstructive pulmonary disease (COPD),        representation. We performed feature extraction on a NVIDIA
     heart disease, diabetes, kidney disease, high blood pressure, and    Tesla T4 GPU using the PyTorch package in Python. Finally,
     high cholesterol. Behavioral and lifestyle-related risk factors      the latent space feature representation was regressed against the
     included smoking, obesity, and the rate of individuals on blood      COVID-19 risk score variance using gradient boosted decision
     pressure medication. Finally, demographic factors included the       trees [43]. We deployed existing AlexNet deep learning models
     prevalence of males and the prevalence of females older than         originally trained on images from the internet and fine-tuned
     65 years.                                                            [44] them to predict the variance associated with the COVID-19
                                                                          risk score, framing the analysis as a regression task. To do this,
     Socioeconomic Correlates of the Community                            we split the census tract data set (with the split being fully
     COVID-19 Risk Score                                                  randomized) into 80:20 and 50:50 training and testing groups
     Next, we examined the relationship between the ACS-derived           to get a conservative estimate of variance explained and
     sociodemographic indicators with the COVID-19 risk score.            predictive capability of the sociodemographic variables in the
     This was done by calculating multivariate linear and random          COVID-19 risk score while not overfitting the data. To train
     forest regressions to test the linear and nonlinear contribution     the model, we used a maximum tree depth of 5, a subsample of
     of the sociodemographic indicators in the COVID-19 score             80% of the features per tree, a learning rate (ie, feature weight
     (Figure 1H), and provide insight into the relationship of            shrinkage for each boosting step) of 0.1, and used threefold
     sociodemographic factors and the clinical indicators used in the     cross-validation to determine the optimal number of boosted
     COVID-19 score. This comparison to sociodemographic factors          trees. Training was completed on a NVIDIA Tesla T4 GPU
     also serves as a form of validation, as the risk increases, one      using Python 3.7.7 and the XGBoost package. In a separate
     would expect certain sociodemographic indicators to also             analysis, both satellite image features and the social determinants
     increase, such as poverty. Further details concerning the            of health features (previously mentioned) were regressed against
     calculation of the linear and random forest regression can be        the COVID-19 risk score variance. We reported R2 for the
     found in Multimedia Appendix 1 [28,35-38].                           predictions in the test data (Figure 1G, 1H).
     Association of the COVID-19 Community Risk Score                     Association of the COVID-19 Community Risk Score
     With Satellite Imagery                                               With Zip Code–Level COVID-19–Attributed Mortality
     To correlate the COVID-19 risk score from satellite imagery          We downloaded case and death count data on a zip code
     (Figure 1B), millions of satellite images (n=4,742,919) were         tabulation area (ZCTA) of New York City, a hot spot of the US
     analyzed in an ensemble of an unsupervised deep learning             COVID-19 epidemic as of May 20, 2020, and then again on
     algorithm and a supervised machine learning algorithm. The           September 20, 2020 (Figure 1J). We used 2010 census crossover
     images are satellite raster tiles that were downloaded from the      files to map census tracts to ZCTAs. We mapped the COVID-19
     OpenMapTiles database. The images have a spatial resolution          risk score to each ZCTA in New York City in April and
     close to 20 meters per pixel, allowing a maximum zoom level          September 2020. Each ZCTA had information on the total
     of 13 [39]. Images were extracted in tiles from the                  number of COVID-19 tests, positive cases, and
     OpenMapTiles database using the coordinate geometries of the         COVID-19–related deaths. We computed the average
     census tracts. After extraction, images were digitally enlarged      COVID-19 risk score for the ZCTA, weighting the average by
     to achieve a zoom level of 18.                                       population size of the census tract. As previously mentioned,
     Many census tracts are large enough to contain multiple satellite    we estimated the ZCTA-level socioeconomic values and
     images. The median number of images per tract was 94, and            proportions. We associated the COVID-19 risk score with the
     the number of images per census tract ranged from 1 image in         death rate using a negative binomial model. We set the offset
     the census tract to the largest geographical tract with 162,811      term as the logarithm of the total population size of a zip code.
     images (in Anchorage, Arkansas) with an IQR from 43 to 182           The exponentiated coefficients are interpreted as the incidence
     images. The geographical coverage of the images per census           rate ratio for a unit change (eg, 1 SD increase) in the variable
                                                                          (vs no change). We also examined multicollinearity, calculating
     tract ranged from the smallest census tract covering 0.022 km2
                                                                          the variance inflation factor (VIF) using the VIF function in the
     and the largest census tract covering 5679.52 km2, with an IQR       regclass package in R.
     from 0.93 km2 to 3.89 km2 and a median of 1.92 km2 per census
     tract.
     First, using the Python 3.7.7 programming language [40], we
     passed images through AlexNet [41], a pretrained convolutional
     neural network, in an unsupervised deep learning approach
     https://publichealth.jmir.org/2021/8/e26604                                             JMIR Public Health Surveill 2021 | vol. 7 | iss. 8 | e26604 | p. 4
                                                                                                                  (page number not for citation purposes)
XSL• FO
RenderX
JMIR PUBLIC HEALTH AND SURVEILLANCE                                                                                                        Deonarine et al

     Data Availability Through the COVID-19 Risk Score                          CDC 500 Cities data (derived from data obtained in 2017) and
     Application Programming Interface and Dashboard                            ACS data collected between 2013 and 2017 (Figure 1A, 1C).
                                                                                Census tracts represent small communities that have a median
     Finally, the COVID-19 risk score was made publicly available
                                                                                population size of 4091 (total range of 15-51,536). From the
     through an application programming interface and online web
                                                                                500 cities analyzed, there was a median number of 28 (IQR
     dashboard (see Multimedia Appendix 1).
                                                                                20-47) census tracts, with the most tracts found in New York
     Ethics Approval                                                            (2141 tracts, with a population of n=8,440,712), Los Angeles
     Ethics approval was not required for this investigation as the             (992 tracts, with a population of n=3,961,681), and Chicago
     study did not involve any human participants, and all of the data          (794 tracts, with a population of n=2,726,431), while Meridian,
     used were obtained from publicly available data sets.                      Idaho (4 tracts, with a population of n=53,442) has the fewest
                                                                                number of tracts. There was a wide range of prevalence values
     Results                                                                    (ranging from 6% to 100%; Figure 1D, Figure 2) for the
                                                                                different prevalence measures, and a wide range of IQR values
     Prevalence and Heterogeneity of                                            within cities was noted (Figure 3 and Tables S1 and S2 in
     COVID-19–Associated Comorbidities and Risk Factors                         Multimedia Appendices 2 and 3).
     Across 500 Cities of the United States                                     Atlanta had the greatest IQR for obesity (22%-40%), high blood
     We present summary statistics of the prevalence of the 15                  pressure (20%-44%), and COPD (4%-9%), while Gainesville
     COVID-19 comorbidities and risk factors for 27,648 census                  had the highest variation in prevalence of high cholesterol
     tracts across the United States using the 2019 release of the              (18%-34%) and blood pressure medication (51%-74%).

     Figure 2. Per census tract prevalence for health indicators (y-axis). BP: blood pressure; COPD: chronic obstructive pulmonary disease.

     https://publichealth.jmir.org/2021/8/e26604                                                     JMIR Public Health Surveill 2021 | vol. 7 | iss. 8 | e26604 | p. 5
                                                                                                                          (page number not for citation purposes)
XSL• FO
RenderX
JMIR PUBLIC HEALTH AND SURVEILLANCE                                                                                                         Deonarine et al

     Figure 3. Median prevalence within a city versus the IQR of the prevalence of health indicators (top 3 cities with the largest IQR are highlighted in
     red). BP: blood pressure; COPD: chronic obstructive pulmonary disease.

                                                                                 a mean correlation of 0.78 was found for males and females
     Comorbidity and Risk Factor Patterns Across the                             older than 65 years and cancer prevalence.
     United States
                                                                                 The first two principal components of the 15 COVID-19 health
     The Pearson correlations between the 15 different prevalence
                                                                                 indicators and risk factors described 85% of the total variation
     values was calculated using census tract–level data (Figure 1D,
                                                                                 (61% and 24% for component 1 and 2, respectively, see Figure
     Figure 4), with a median absolute value of correlation of 0.63
                                                                                 5) of the variation over all 27,648 census tracts (Figure 1E).
     (IQR 0.35-0.78) noted with disease prevalences. The mean
                                                                                 The first principal component had equal contribution from all
     pairwise correlation between cardiometabolic diseases (diabetes,
                                                                                 15 health indicators and risk factors, except for cancer and males
     stroke, and heart disease) was 0.92, for cardiovascular risk
                                                                                 and females older than 65 years; the second principal component
     factors (obesity, high blood pressure, and high cholesterol) was
                                                                                 was dominated by cancer and age (Table S3 in Multimedia
     0.62, and for smoking and respiratory conditions (asthma and
                                                                                 Appendix 2). This pattern of health indicator and risk factor
     COPD) was 0.69. An average correlation of 0.78 existed for
                                                                                 contribution to principal components was also noted when the
     diseases like diabetes, stroke, and heart disease, with obesity
                                                                                 COVID-19 risk score was calculated at the city and county level
     highly correlated with all of them (mean correlation 0.54), and
                                                                                 (Table S3 in Multimedia Appendix 2).

     https://publichealth.jmir.org/2021/8/e26604                                                      JMIR Public Health Surveill 2021 | vol. 7 | iss. 8 | e26604 | p. 6
                                                                                                                           (page number not for citation purposes)
XSL• FO
RenderX
JMIR PUBLIC HEALTH AND SURVEILLANCE Deonarine et al
Figure 4. Pearson correlation of health indicators across 27,648 census tracts (legend value corresponds to Pearson correlation value). BP: blood
pressure; COPD: chronic obstructive pulmonary disease.
Figure 5. Scatterplot showing the relationship between the first and second principal components from principal component analysis, with each point
indicating a city or census tract in the United States (top 10 cities/tracts by principal component 1 or 2 are highlighted in red).
https://publichealth.jmir.org/2021/8/e26604 JMIR Public Health Surveill 2021 | vol. 7 | iss. 8 | e26604 | p. 7
(page number not for citation purposes)
XSL• FO
RenderXJMIR PUBLIC HEALTH AND SURVEILLANCE Deonarine et al
Calculating a Robust COVID-19 Community Risk average score was 33.7 (SD 8.6); the median was 33.32 (IQR
Score 28-38). Table 1 shows the communities with the highest
variation of scores in the United States. The average error of
The COVID-19 risk score was calculated using the 15 disease
the COVID-19 risk score across the census tracts was 1.25 (SD
and health indicators for 27,648 included census tracts. The
0.85).
Table 1. Cities with the largest variation of COVID-19 risk score.
City, State Median Min Max 25th percentile 75th percentile SD IQR
Athens, GA 32.2 6.3 42.6 20.7 35.7 10.0 15.0
Atlanta, GA 33.7 4.7 53.7 23.8 41.4 11.0 17.6
Boynton Beach, FL 41.7 21.6 81.3 35.5 52.1 16.2 16.6
Champaign, IL 29.8 3.4 45.2 17.9 34.1 12.8 16.2
Gainesville, FL 27.1 2.2 75.2 16.6 38.5 15.0 21.9
Hemet, CA 41.2 30.1 67.9 36.4 53.4 11.1 17.0
Mesa, AZ 32.2 7.7 84.6 29.0 43.2 14.7 14.2
Montgomery, AL 41.0 15.0 61.3 33.5 47.6 9.8 14.1
St. Louis, MO 36.9 22.0 57.3 31.7 46.3 8.6 14.6
Surprise, AZ 30.2 24.1 77.9 26.1 58.7 20.6 32.6
Birmingham, AL 43.9 18.8 57.9 36.4 49.3 9.6 12.9
Cape Coral, FL 43.4 30.3 63.3 37.3 49.3 8.2 12.0
Clearwater, FL 42.9 28.7 66.4 39.6 51.5 8.0 12.0
Cleveland, OH 42.4 18.3 78.3 38.0 49.6 9.1 11.6
Dayton, OH 43.1 6.0 78.1 38.6 49.8 11.8 11.2
Huntsville, AL 42.7 22.1 56.3 32.9 45.6 8.4 12.7
Lake Charles, LA 41.5 27.4 54.0 36.4 46.5 7.5 10.1
Lakeland, FL 43.9 18.0 65.8 38.3 49.2 10.9 10.9
Largo, FL 45.0 26.1 75.3 41.1 53.2 11.6 12.2
Palm Coast, FL 46.8 33.9 58.1 43.7 54.8 7.5 11.0
Pompano Beach, FL 43.6 27.1 64.3 37.0 48.5 9.7 11.5
Shreveport, LA 42.8 21.7 64.0 37.7 49.7 8.6 12.1
Gary, IN 50.8 42.5 61.8 47.1 54.6 5.2 7.6
COVID-19 risk score. In total, combining both social
COVID-19 Community Risk Score Variance Can Be determinants and satellite imagery explained 87% of the
Explained by Social Determinants of Health and variation of the COVID-19 risk score when using an 80:20
Satellite Images of the Built Environment training:testing split (Figure 1G, 1H).
The social determinants of health measures (excluding built
Concerning important features, all 13 sociodemographic
environment) and demographic characteristics of a community
variables correlated with the COVID-19 risk score (linear
(Figure 1C, 1H) explain 54% of the total additive variation
regression PJMIR PUBLIC HEALTH AND SURVEILLANCE Deonarine et al
When assessing the explained variance using nonlinear of MSE), at or below poverty (91% increase of MSE), Hispanic
regression (random forest) methods, the most important (78% increase MSE), and less than high school (78% increase
variables in the training data (ascertained through a permutation MSE). The rank order of the importance of these variables was
of each variable sequentially) included the proportion of the similar to the strength of their association in the linear model
tract that was not employed (273% increase of mean squared (Table 2). The same results were observed when the
error [MSE] when permuted), of Asian ethnicity (93% increase training:testing split was 50:50 and 80:20.
Table 2. Multivariate coefficients and CIs for linear regression and random forest regression of the COVID-19 risk score.
Variable Linear coefficient P value Low (95% CI) High (95% CI) MSEa Node purityb VIFc,d
Median income –1.34JMIR PUBLIC HEALTH AND SURVEILLANCE Deonarine et al
Table 3. Multivariate incidence rate ratios (for 1 SD change in the variable) for zip code–level deaths in New York City in May and September 2020.
Variable (per 1 SD unit) May IRRa (95% CI) May P value VIFb September IRR (95% CI) September P value VIF
COVID-19 risk score 1.40 (1.27-1.55)JMIR PUBLIC HEALTH AND SURVEILLANCE Deonarine et al
of this writing, New York City is contemplating another environment may be partly due to how discrimination affects
lockdown due to a surge in the same zip codes we identified as where people live, their built environment, and access to health
high risk [52]. Given the heterogeneity of various census tracts care [15,53,54]. Since the built environment and social
and neighborhoods across the United States and the range of determinants of health were found to play an important role in
COVID-19 rates and deaths, a more comprehensive national explaining the variance associated with the COVID-19 risk
analysis will need to be performed using nationally score, we plan to integrate this information into future
representative comorbidity data and satellite data before COVID-19 risk score calculations that can be extended across
extending the conclusions from the New York City analysis to the United States beyond the 500 Cities data set. We found that
similar jurisdictions in the United States or across the whole ~90% of the variation of prevalence of the 15 disease and health
country. indicator prevalences (eg, diabetes, obesity, cardiovascular
disease, populations that take blood pressure medication, and
As a byproduct of developing a risk score for communities, we
average age) can be explained by just two dimensions.
observed that there is substantial variation of chronic disease
prevalence within cities and across cities in the United States. Limitations
With the exception of New York City and a few other places The following are limitations of this study. First, we relied on
in the United States, public health agencies mostly collect disease and health indicator prevalence from the 500 largest
COVID-19 case and death records at the county level across cities in the United States but missed out on less urban areas
the country. However, the findings in our study implicate that whose populations are at risk for COVID-19 complications. In
smaller populations are at risk, and counties are heterogeneous. the future, we aim to task satellite imaging technology to
We demonstrated how COVID-19 rates can be modeled using locations that cannot be covered by resource-limited public
the COVID-19 risk score and how social determinants of health surveillance programs. Second, although the CDC 500 Cities
and the built environment can explain most of the score variance. data are reflective of the diversity of individuals who live in a
Through simulations of the coprevalences of each of the 27,648 census tract, they are updated every 2 years and are dated to the
census tracts, we found that the point estimates for the latest collection (2019 data release reflects disease prevalence
community risk scores were robust to simulated sampling error. in 2017). Relatedly, neither individual-level disease nor
Many cities in the southwest and southeast demonstrated wide COVID-19 status of individuals from these communities are
ranges in the COVID-19 risk score values. For example, measured. Third, satellite image data are captured at a resolution
Surprise, Arizona had a COVID-19 risk score with an IQR of of approximately 20 m per pixel. It is not clear from our study
26 to 59. Atlanta, Georgia had an IQR of 24 to 41 (Figure S1 if higher resolution images (that can theoretically capture more
in Multimedia Appendix 2). Social determinants of health are human-visible details of the built environment) would lead to
hierarchical in structure and distributed over both geographic better predictions of the COVID-19 risk score. Finally,
space and time whose measurement can occur on both the interpretations of the New York–related data is limited due to
individual level (exposure of a person) or area level (exposure the fact that it is aggregated to the zip code level. It is clear that
levels of a place). Satellite images provide a microscope into COVID-19 is a disease of disparity; however, we cannot make
the area-level built environment, a concept that encapsulates a causal claim between the instruments such as the COVID-19
the physical structures of how humans live, such as the city risk score, satellite imagery, and census tract–level
layout, resource presence, and landscape. A total of 65% of sociodemographic factors, and eventual individual-level
COVID-19 community risk score variance was explained by COVID-19–related complications.
demographics and the social determinants of health, and 87%
Conclusions
explained when the built environment was included. Given the
large proportion of variance explained by the built environment, Although it is clear that individual-level comorbidities are
future precision public health strategies like hot spot associated with risk for COVID-19, here we show that
identification and vaccine prioritization could be quickly communities’ clinical coprevalence structure are predictive of
improved by including measurements of the built environment risk quantified by the COVID-19 risk score, and the variance
to identify geographical areas in need of assistance. of that score can be explained using the social determinants of
health and the built environment measured from satellite
This large proportion of COVID-19–associated risk variance imagery. We provide all our tools to monitor COVID-19 risk
explained by the social determinants of health and built and related data in an interactive web-based dashboard.
Acknowledgments
We thank Emmanuel Coloma and Sumeet Parekh for their help in crafting the figures. This study is funded by XY Health, Inc,
a company that develops machine learning approaches for prediction of health outcomes using satellite and land sensor data.
Conflicts of Interest
This study was funded by XY Health, Inc, and AD, GL, CL, and WDB completed this study while employed at XY Health Inc.
https://publichealth.jmir.org/2021/8/e26604 JMIR Public Health Surveill 2021 | vol. 7 | iss. 8 | e26604 | p. 11
(page number not for citation purposes)
XSL• FO
RenderXJMIR PUBLIC HEALTH AND SURVEILLANCE Deonarine et al
Multimedia Appendix 1
Supplementary methods.
[DOCX File , 16 KB-Multimedia Appendix 1]
Multimedia Appendix 2
Supplementary information containing figures, tables, and application programming interface specification for the COVID-19
community risk score.
[DOCX File , 735 KB-Multimedia Appendix 2]
Multimedia Appendix 3
Table S2.
[XLSX File (Microsoft Excel File), 489 KB-Multimedia Appendix 3]
References
1. Munshi L, Hall JB. Respiratory support during the COVID-19 pandemic: is it time to consider using a helmet? JAMA 2021
May 04;325(17):1723-1725. [doi: 10.1001/jama.2021.4975] [Medline: 33764370]
2. Nuzzo J, Moss B, Watson C, Rutkow L. COVID-19 Dashboard by the Center for Systems Science and Engineering (CSSE)
at Johns Hopkins University (JHU). Johns Hopkins Coronavirus Resource Center. 2021. URL: https://coronavirus.jhu.edu/
map.html [accessed 2021-07-06]
3. CDC COVID-19 Response Team. Severe outcomes among patients with coronavirus disease 2019 (COVID-19) - United
States, February 12-March 16, 2020. MMWR Morb Mortal Wkly Rep 2020 Mar 27;69(12):343-346. [doi:
10.15585/mmwr.mm6912e2] [Medline: 32214079]
4. Garg S, Kim L, Whitaker M, O'Halloran A, Cummings C, Holstein R, et al. Hospitalization rates and characteristics of
patients hospitalized with laboratory-confirmed coronavirus disease 2019 - COVID-NET, 14 States, March 1-30, 2020.
MMWR Morb Mortal Wkly Rep 2020 Apr 17;69(15):458-464. [doi: 10.15585/mmwr.mm6915e3] [Medline: 32298251]
5. Gold JAW, Wong KK, Szablewski CM, Patel PR, Rossow J, da Silva J, et al. Characteristics and clinical outcomes of adult
patients hospitalized with COVID-19 - Georgia, March 2020. MMWR Morb Mortal Wkly Rep 2020 May 08;69(18):545-550.
[doi: 10.15585/mmwr.mm6918e1] [Medline: 32379729]
6. Petrilli C, Jones S, Yang J, Rajagopalan H, O'Donnell L, Chernyak Y, et al. Factors associated with hospital admission and
critical illness among 5279 people with coronavirus disease 2019 in New York City: prospective cohort study. BMJ 2020
May 22;369:m1966 [FREE Full text] [doi: 10.1136/bmj.m1966] [Medline: 32444366]
7. Nandi A, Balasubramanian R, Laxminarayan R. Who is at the highest risk from COVID-19 in India? Analysis of health,
healthcare access, and socioeconomic indicators at the district level Internet. medRxiv. Preprint posted online on June 9,
2020. [doi: 10.1101/2020.04.25.20079749]
8. Zhang X, Tan Y, Ling Y, Lu G, Liu F, Yi Z, et al. Viral and host factors related to the clinical outcome of COVID-19.
Nature 2020 Jul;583(7816):437-440. [doi: 10.1038/s41586-020-2355-0] [Medline: 32434211]
9. Yang X, Yu Y, Xu J, Shu H, Xia J, Liu H, et al. Clinical course and outcomes of critically ill patients with SARS-CoV-2
pneumonia in Wuhan, China: a single-centered, retrospective, observational study. Lancet Respir Med 2020 May;8(5):475-481
[FREE Full text] [doi: 10.1016/S2213-2600(20)30079-5] [Medline: 32105632]
10. Grasselli G, Zangrillo A, Zanella A, Antonelli M, Cabrini L, Castelli A, COVID-19 Lombardy ICU Network. Baseline
characteristics and outcomes of 1591 patients infected with SARS-CoV-2 admitted to ICUs of the Lombardy Region, Italy.
JAMA 2020 Apr 28;323(16):1574-1581 [FREE Full text] [doi: 10.1001/jama.2020.5394] [Medline: 32250385]
11. Zhou F, Yu T, Du R, Fan G, Liu Y, Liu Z, et al. Clinical course and risk factors for mortality of adult inpatients with
COVID-19 in Wuhan, China: a retrospective cohort study. Lancet 2020 Mar 28;395(10229):1054-1062 [FREE Full text]
[doi: 10.1016/S0140-6736(20)30566-3] [Medline: 32171076]
12. Barker LE, Kirtland KA, Gregg EW, Geiss LS, Thompson TJ. Geographic distribution of diagnosed diabetes in the U.S.:
a diabetes belt. Am J Prev Med 2011 Apr;40(4):434-439. [doi: 10.1016/j.amepre.2010.12.019] [Medline: 21406277]
13. Krieger N, Chen JT, Waterman PD, Soobader M, Subramanian SV, Carson R. Geocoding and monitoring of US
socioeconomic inequalities in mortality and cancer incidence: does the choice of area-based measure and geographic level
matter?: the Public Health Disparities Geocoding Project. Am J Epidemiol 2002 Sep 01;156(5):471-482. [doi:
10.1093/aje/kwf068] [Medline: 12196317]
14. Chin T, Kahn R, Li R, Chen JT, Krieger N, Buckee CO, et al. U.S. county-level characteristics to inform equitable COVID-19
response. medRxiv. Preprint posted online on April 11, 2020. [doi: 10.1101/2020.04.08.20058248] [Medline: 32511610]
15. Figueroa JF, Wadhera RK, Lee D, Yeh RW, Sommers BD. Community-level factors associated with racial and ethnic
disparities in COVID-19 rates in Massachusetts. Health Aff (Millwood) 2020 Nov;39(11):1984-1992. [doi:
10.1377/hlthaff.2020.01040] [Medline: 32853056]
https://publichealth.jmir.org/2021/8/e26604 JMIR Public Health Surveill 2021 | vol. 7 | iss. 8 | e26604 | p. 12
(page number not for citation purposes)
XSL• FO
RenderXJMIR PUBLIC HEALTH AND SURVEILLANCE Deonarine et al
16. Jin J, Agarwala N, Kundu P, Harvey B, Zhang Y, Wallace E, et al. Individual and community-level risk for COVID-19
mortality in the United States. Nat Med 2021 Feb;27(2):264-269. [doi: 10.1038/s41591-020-01191-8]
17. Jones AC, Chaudhary NS, Patki A, Howard VJ, Howard G, Colabianchi N, et al. Neighborhood walkability as a predictor
of incident hypertension in a national cohort study. Front Public Health 2021;9:611895. [doi: 10.3389/fpubh.2021.611895]
[Medline: 33598444]
18. Lopez L, Hart LH, Katz MH. Racial and ethnic health disparities related to COVID-19. JAMA 2021 Feb 23;325(8):719-720.
[doi: 10.1001/jama.2020.26443] [Medline: 33480972]
19. Webb Hooper M, Nápoles AM, Pérez-Stable EJ. COVID-19 and racial/ethnic disparities. JAMA 2020 Jun
23;323(24):2466-2467. [doi: 10.1001/jama.2020.8598] [Medline: 32391864]
20. Khazanchi R, Evans CT, Marcelin JR. Racism, not race, drives inequity across the COVID-19 continuum. JAMA Netw
Open 2020 Sep 01;3(9):e2019933 [FREE Full text] [doi: 10.1001/jamanetworkopen.2020.19933] [Medline: 32975568]
21. Berkowitz RL, Gao X, Michaels EK, Mujahid MS. Structurally vulnerable neighbourhood environments and racial/ethnic
COVID-19 inequities. Cities Health 2020 Jul 29:1-4. [doi: 10.1080/23748834.2020.1792069]
22. Wu X, Nethery RC, Sabath MB, Braun D, Dominici F. Exposure to air pollution and COVID-19 mortality in the United
States: a nationwide cross-sectional study. medRxiv. Preprint posted online on April 27, 2020. [doi:
10.1101/2020.04.05.20054502]
23. Travaglio M, Yu Y, Popovic R, Selley L, Leal NS, Martins LM. Links between air pollution and COVID-19 in England.
Environ Pollut 2021 Jan 01;268(Pt A):115859 [FREE Full text] [doi: 10.1016/j.envpol.2020.115859] [Medline: 33120349]
24. Cromer S, Lakhani C, Wexler D, Burnett-Bowie S, Udler M, Patel C. Geospatial analysis of individual and community-level
socioeconomic factors impacting SARS-CoV-2 prevalence and outcomes. medRxiv. Preprint posted online on September
30, 2020. [doi: 10.1101/2020.09.30.20201830] [Medline: 33024982]
25. Social determinants of health. Office of Disease Prevention and Health Promotion. URL: https://health.gov/healthypeople/
objectives-and-data/social-determinants-health [accessed 2021-05-12]
26. Maharana A, Nsoesie EO. Use of deep learning to examine the association of the built environment with prevalence of
neighborhood adult obesity. JAMA Netw Open 2018 Aug 03;1(4):e181535 [FREE Full text] [doi:
10.1001/jamanetworkopen.2018.1535] [Medline: 30646134]
27. Krieger N, Waterman P, Chen JT, Soobader M, Subramanian SV, Carson R. Zip code caveat: bias due to spatiotemporal
mismatches between zip codes and US census-defined geographic areas--the Public Health Disparities Geocoding Project.
Am J Public Health 2002 Jul;92(7):1100-1102. [doi: 10.2105/ajph.92.7.1100] [Medline: 12084688]
28. XY.ai COVID-19 Community Risk Score Dashboard. URL: https://covid19satellite.org/ [accessed 2021-02-01]
29. Centers for Disease Control and Prevention. URL: https://www.cdc.gov/places/about/500-cities-2016-2019/index.html
[accessed 2020-10-04]
30. Zhang X, Holt JB, Lu H, Wheaton AG, Ford ES, Greenlund KJ, et al. Multilevel regression and poststratification for
small-area estimation of population health outcomes: a case study of chronic obstructive pulmonary disease prevalence
using the behavioral risk factor surveillance system. Am J Epidemiol 2014 Apr 15;179(8):1025-1033. [doi:
10.1093/aje/kwu018] [Medline: 24598867]
31. People with certain medical conditions. Centers for Disease Control and Prevention. 2020. URL: https://www.cdc.gov/
coronavirus/2019-ncov/need-extra-precautions/people-with-medical-conditions.html [accessed 2020-12-12]
32. American Community Survey Data. United States Census Bureau. URL: https://www.census.gov/programs-surveys/acs/
data.html [accessed 2020-10-04]
33. Boyd RW, Lindo EG, Weeks LD, McLemore MR. On racism: a new standard for publishing on racial health inequities.
Health Affairs. URL: https://www.healthaffairs.org/do/10.1377/hblog20200630.939347 [accessed 2021-05-07]
34. Maroko AR, Nash D, Pavilonis BT. COVID-19 and inequity: a comparative spatial analysis of New York City and Chicago
hot spots. J Urban Health 2020 Aug;97(4):461-470 [FREE Full text] [doi: 10.1007/s11524-020-00468-0] [Medline:
32691212]
35. The R Project for Statistical Computing. 2017. URL: http://www.R-project.org/ [accessed 2020-10-10]
36. CSSEGISandData / COVID-19. GitHub. URL: https://github.com/CSSEGISandData/COVID-19 [accessed 2020-10-04]
37. Cartographic boundary files - shapefile. United States Census Bureau. URL: https://www.census.gov/geographies/
mapping-files/time-series/geo/carto-boundary-file.html [accessed 2020-12-17]
38. Patel CJ. xyhealth / covid_comorbidity_score. GitHub. URL: https://github.com/xyhealth/covid_comorbidity_score [accessed
2020-12-16]
39. Klokan Technologies GmbH. URL: https://openmaptiles.com/ [accessed 2020-10-04]
40. Python. URL: https://www.python.org/ [accessed 2021-05-14]
41. Krizhevsky A. One weird trick for parallelizing convolutional neural networks. arXiv. 2014. URL: http://arxiv.org/abs/
1404.5997 [accessed 2020-09-14]
42. Krizhevsky A, Sutskever I, Hinton G. ImageNet classification with deep convolutional neural networks. Commun ACM
2017 May 24;60(6):84-90. [doi: 10.1145/3065386]
https://publichealth.jmir.org/2021/8/e26604 JMIR Public Health Surveill 2021 | vol. 7 | iss. 8 | e26604 | p. 13
(page number not for citation purposes)
XSL• FO
RenderXJMIR PUBLIC HEALTH AND SURVEILLANCE Deonarine et al
43. Chen T, Guestrin C. XGBoost: a scalable tree boosting system. In: Proceedings of the 22nd ACM SIGKDD International
Conference on Knowledge Discovery and Data Mining. 2016 Presented at: KDD '16; August 13-17, 2016; San Francisco,
CA p. 785-794. [doi: 10.1145/2939672.2939785]
44. Razavian A, Azizpour H, Sullivan J, Carlsson S. CNN features off-the-shelf: an astounding baseline for recognition. 2014
Presented at: 2014 IEEE Conference on Computer Vision and Pattern Recognition Workshops; June 23-28, 2014; Columbus,
OH. [doi: 10.1109/cvprw.2014.131]
45. Kim SJ, Bostwick W. Social vulnerability and racial inequality in COVID-19 deaths in Chicago. Health Educ Behav 2020
Aug;47(4):509-513 [FREE Full text] [doi: 10.1177/1090198120929677] [Medline: 32436405]
46. Marvel SW, House JS, Wheeler M, Song K, Zhou Y, Wright FA, et al. The COVID-19 Pandemic Vulnerability Index (PVI)
Dashboard: monitoring county-level vulnerability using visualization, statistical modeling, and machine learning. Environ
Health Perspect 2021 Jan;129(1):17701 [FREE Full text] [doi: 10.1289/EHP8690] [Medline: 33400596]
47. Mehta M, Julaiti J, Griffin P, Kumara S. Early stage machine learning-based prediction of US county vulnerability to the
COVID-19 pandemic: machine learning approach. JMIR Public Health Surveill 2020 Sep 11;6(3):e19446 [FREE Full text]
[doi: 10.2196/19446] [Medline: 32784193]
48. Yang S, Chen X, Wang L, Wu T, Fei T, Xiao Q, et al. Walkability indices and childhood obesity: a review of epidemiologic
evidence. Obes Rev 2021 Feb;22 Suppl 1:e13096 [FREE Full text] [doi: 10.1111/obr.13096] [Medline: 33185012]
49. Gan WQ, Tamburic L, Davies HW, Demers PA, Koehoorn M, Brauer M. Changes in residential proximity to road traffic
and the risk of death from coronary heart disease. Epidemiology 2010 Sep;21(5):642-649. [doi:
10.1097/EDE.0b013e3181e89f19] [Medline: 20585255]
50. Yao Y, Shi W, Zhang A, Liu Z, Luo S. Examining the diffusion of coronavirus disease 2019 cases in a metropolis: a space
syntax approach. Int J Health Geogr 2021 Apr 29;20(1):17 [FREE Full text] [doi: 10.1186/s12942-021-00270-4] [Medline:
33926460]
51. COVID-19 contact tracing trainingand resources. Centers for Disease Control and Prevention. 2020. URL: https://www.
cdc.gov/coronavirus/2019-ncov/php/contact-tracing/strategies-to-reduce-spread.html [accessed 2020-10-04]
52. Cook L. 9 NYC zip codes with coronavirus clusters face shutdown of schools, businesses Internet. PIX11. 2020. URL:
https://pix11.com/news/coronavirus/9-nyc-zip-codes-with-coronavirus-clusters-face-shutdown-of-schools-businesses/
[accessed 2021-05-12]
53. Alcendor DJ. Racial disparities-associated COVID-19 mortality among minority populations in the US. J Clin Med 2020
Jul 30;9(8):2442 [FREE Full text] [doi: 10.3390/jcm9082442] [Medline: 32751633]
54. Poteat T, Millett GA, Nelson LE, Beyrer C. Understanding COVID-19 risks and vulnerabilities among black communities
in America: the lethal force of syndemics. Ann Epidemiol 2020 Jul;47:1-3 [FREE Full text] [doi:
10.1016/j.annepidem.2020.05.004] [Medline: 32419765]
Abbreviations
ACS: American Community Survey
CDC: Centers for Disease Control and Prevention
COPD: chronic obstructive pulmonary disease
IRR: incident rate ratio
MSE: mean squared error
VIF: variance inflation factor
ZCTA: zip code tabulation area
Edited by T Sanchez; submitted 18.12.20; peer-reviewed by A Maharan, R Berkowitz; comments to author 13.01.21; revised version
received 14.05.21; accepted 15.07.21; published 26.08.21
Please cite as:
Deonarine A, Lyons G, Lakhani C, De Brouwer W
Identifying Communities at Risk for COVID-19–Related Burden Across 500 US Cities and Within New York City: Unsupervised
Learning of the Coprevalence of Health Indicators
JMIR Public Health Surveill 2021;7(8):e26604
URL: https://publichealth.jmir.org/2021/8/e26604
doi: 10.2196/26604
PMID: 34280122
©Andrew Deonarine, Genevieve Lyons, Chirag Lakhani, Walter De Brouwer. Originally published in JMIR Public Health and
Surveillance (https://publichealth.jmir.org), 26.08.2021. This is an open-access article distributed under the terms of the Creative
https://publichealth.jmir.org/2021/8/e26604 JMIR Public Health Surveill 2021 | vol. 7 | iss. 8 | e26604 | p. 14
(page number not for citation purposes)
XSL• FO
RenderXJMIR PUBLIC HEALTH AND SURVEILLANCE Deonarine et al
Commons Attribution License (https://creativecommons.org/licenses/by/4.0/), which permits unrestricted use, distribution, and
reproduction in any medium, provided the original work, first published in JMIR Public Health and Surveillance, is properly
cited. The complete bibliographic information, a link to the original publication on https://publichealth.jmir.org, as well as this
copyright and license information must be included.
https://publichealth.jmir.org/2021/8/e26604 JMIR Public Health Surveill 2021 | vol. 7 | iss. 8 | e26604 | p. 15
(page number not for citation purposes)
XSL• FO
RenderXYou can also read