Housing statistics 1 April 2020 - 31 March 2021 - Published 22 June 2021 Making homes happen - GOV.UK
←
→
Page content transcription
If your browser does not render page correctly, please read the page content below
Making homes happen

Housing statistics
1 April 2020 – 31 March 2021
Published 22 June 2021

                         OFFICIAL
Contents

1. Key results ............................................................................................................... 3

2. Introduction ............................................................................................................. 4

3. Housing outputs....................................................................................................... 6

4. Accompanying tables ............................................................................................. 11

5. Revisions................................................................................................................ 12

6. Definitions ............................................................................................................. 15

7. Data sources and quality ........................................................................................ 17

8. Related statistics ................................................................................................... 19

9. Other information .................................................................................................. 21

10. User consultation ................................................................................................. 22

Annexe 1 ................................................................................................................... 23

Annexe 2 ................................................................................................................... 28

Page 2

                                                             OFFICIAL
1. Key results
1.1    In the financial year 2020-21 there were 37,330 housing starts on site and 34,995 housing completions
       delivered through programmes managed by Homes England in England (excluding London for all
       programmes except those administered by Homes England on behalf of the Greater London
       Authority (GLA)). Levels of starts were the lowest since 2015-16 and levels of completions were the
       lowest since 2017-18. The reduction in both starts and completions are as a result of a slow-down in
       housebuilding activity caused by the Covid-19 pandemic. Homes England manages the Help to Buy
       (Equity Loan) scheme in England but the completions are reported by the Ministry of Housing,
       Communities and Local Government (MHCLG) available from the webpage linked below1 and are,
       therefore, excluded from this publication.

1.2    28,191 or 76 per cent of housing starts on site in 2020-21 were for affordable homes. This represents
       a decrease of 21 per cent on the 35,909 affordable homes started in 2019-20, when they accounted
       for 75 per cent of all housing starts. The number of affordable starts was the lowest since 2017-18.

1.3    10,713 affordable homes started were for Affordable Rent, a reduction of 37 per cent on the 17,012
       started in 2019-20. A further 7,249 were for Intermediate Affordable Housing schemes, including
       Shared Ownership and Rent to Buy. This is a decrease of 38 per cent on the 11,750 started in the
       previous year. 2,665 were for Social Rent, an increase of 11 per cent on the 2,409 started in the
       previous year. In addition, a further 7,564 affordable homes started with tenure to be confirmed2, an
       increase of 60 per cent on the 4,738 started in the previous year. Of the affordable homes started in
       2020-21, the highest delivering programmes were: Shared Ownership and Affordable Homes
       Programme (SOAHP) 2016-21 with 90 per cent (down from 91 per cent), the Single Land Programme
       (SLP) with 4 per cent (no change) and Right to Buy Replacement with 3 per cent (up from 1 per cent).

1.4    24,023 or 69 per cent of housing completions in 2020-21 were for affordable homes. This represents
       a reduction of 15 per cent on the 28,226 affordable homes completed in 2019-20, when they
       accounted for 70 per cent of total completions. The number of affordable completions was the lowest
       since 2016-17.

1.5    13,306 affordable homes completed were for Affordable Rent, a decrease of 21 per cent on the 16,863
       completed in 2019-20. A further 8,811 were for Intermediate Affordable Housing schemes, including
       Shared Ownership and Rent to Buy, a decrease of 11 per cent on the 9,883 completed in the previous
       year. The remaining 1,906 were for Social Rent, a 29 per cent increase on 1,480 completed in the
       previous year. Of the affordable homes completed, the highest delivering programmes were the
       SOAHP 2016-21 with 89 per cent (up from 81 per cent), the AHP 2015-18 with 4 per cent (down from
       13 per cent) and the Single Land Programme with 3 per cent (no change).

1 https://www.gov.uk/government/collections/help-to-buy-equity-loan-and-newbuy-statistics
2 Affordable Tenure TBC  refers to units that have reached the start on site milestone but where the tenure of these units has not
yet been specified. This was introduced as a flexibility for Strategic Partnerships to enable them to determine tenure close to or at
the point of completion. These starts will be restated under their specified tenure headings in future national statistics updates
once the tenure has been established at completion.

Page 3

                                                            OFFICIAL
2. Introduction
Geographical coverage
2.1    This release presents the housing starts on site and housing completions delivered by Homes England
       between 1 April 2009 and 31 March 2021 in England excluding London (for both the current and
       historical series3) with the exception of the Build to Rent (BTR), Builders Finance Fund, Get Britain
       Building and the Home Building Fund – Short Term Fund (HBF – STF)4 programmes which are
       administered by Homes England on behalf of the Greater London Authority (GLA) and where delivery
       covers all of England including London.

Purposes and uses
2.2    The figures in this release show the supply of affordable and market housing delivered through Homes
       England’s programmes5 with the exception of Help to Buy (Equity Loan scheme), the statistics for
       which are published quarterly by MHCLG6. Further details on housing types are available in section 6
       of this release. MHCLG also publishes annual statistics on affordable housing supply in England 7
       showing the gross annual supply of affordable homes, irrespective of funding mechanism. Further
       information on the Affordable Housing Supply and Help to Buy releases is provided in section 8 of this
       release.

2.3    The data in this release are used by MHCLG to monitor delivery of affordable homes as part of the
       MHCLG business plan (see paragraph 8.3). Homes England uses the data to measure progress
       towards commitments made in its published Strategic Plan8 and its Annual Business Plan. Local
       authorities also use the data when compiling their annual return to MHCLG for the purpose of
       calculating the enhancement for affordable housing under the New Homes Bonus (NHB), a grant for
       local authorities to incentivise new housing supply.

What is included in this release?
2.4    This is the first release of data relating to delivery for the financial year ending 31 March 2021 and
       covers all current and historical programmes delivered by Homes England (summarised in Annex 1).
       These include the acquisition of existing land or property as well as new house building, and some
       programmes provide a mix of affordable and market housing. Affordable housing may be for home
       ownership (on Shared Ownership or Rent to Buy terms) or for rent.

2.5    Housing starts on site and housing completions are reported for each programme, where applicable.

2.6    A programme breakdown of the data is available in Table 1 of the tables accompanying this release9.
       Further information on the accompanying tables is provided in section 4 of this release. Table A of

3 As housingstarts on site and completions are recorded by their geographical location, this release may exclude homes located
outside London where the funding was allocated to a local authority district within London.
4 The Home Building Fund – Short Term Fund was launched on 3 October 2016 and includes the Builders Finance Fund.
5 See Annex 1 for a summary and links to information about Homes England’s programmes.
6 https://www.gov.uk/government/collections/help-to-buy-equity-loan-and-newbuy-statistics
7 https://www.gov.uk/government/collections/affordable-housing-supply
8 https://www.gov.uk/government/publications/homes-england-strategic-plan-201819-to-202223
9 https://www.gov.uk/government/collections/housing-statistics

Page 4

                                                          OFFICIAL
the latest annual statistics on affordable housing supply in England published by MHCLG10 shows how
Homes England programmes relate to the statistics on affordable housing published by MHCLG.
How is new subsidised housing provided?
2.7 Affordable homes delivered through Homes England programmes are funded by central government.
The funding is administered by Homes England to fund investment partners (including private
registered providers, house builders, community groups and local authorities) to deliver affordable
housing.
2.8 With the exception of the Single Land Programme (SLP), funding for all programmes is allocated
through an application/bidding process based on the assessment eligibility/criteria for each
programme. Funding is paid in accordance with the contractual agreement for each programme.
Investment for projects delivered under the SLP is determined in accordance with Homes England’s
Framework Document11 and relevant commissioning template.
London
2.9 Since April 2012, the Mayor of London has had oversight of strategic housing, regeneration and
economic development in London. This means that Homes England no longer publishes housing
starts on site and completions for London, except where Homes England is administering a
programme on behalf of the GLA. The historical series for London, which reflects past delivery by
Homes England, is included in Homes England’s housing statistics published on 12 June 2012 (revised
24 August 2012) available from the housing statistics page on the Homes England section of
GOV.UK12.
2.10 MHCLG has combined the affordable housing statistics in this release with the GLA’s affordable
housing statistics to produce Table 1012 showing total affordable housing starts on site and
completions delivered nationally under the affordable housing programmes of Homes England and
the GLA13. This table excludes additional affordable housing delivery reported annually through local
authority returns, which are included in MHCLG’s full annual release on affordable housing supply in
England10. The table includes any revisions made to London data since it was published by Homes
England on 12 June 2012 (revised 24 August 2012). Further details are provided in section 8 of this
release.
10 https://www.gov.uk/government/collections/affordable-housing-supply
11 https://www.gov.uk/government/publications/homes-england-framework-document
12 https://www.gov.uk/government/collections/housing-statistics
13 https://www.gov.uk/government/statistical-data-sets/live-tables-on-affordable-housing-supply
Page 5
OFFICIAL3. Housing outputs
This section provides the detailed statistics for housing starts and completions by tenure. It includes
all Homes England programmes and analyses them over time14.
Starts on site
Table 1a: Housing starts on site by tenure, England (excluding non-Homes England London delivery) 1, 2
Intermediate Affordable
Housing Total
Affordable Total
Affordable Affordable 5
Social Rent Affordable Tenure Market Housing
Rent Intermediate Housing
Home TBC 3 4 Starts
Rent Starts
Ownership
2020-21 6 Apr - Sep 3,322 483 262 2,520 3,380 9,967 2,685 12,652
6
2020-21 Oct - Mar 7,391 2,182 191 4,276 4,184 18,224 6,454 24,678
6
2020-21 Full Year 10,713 2,665 453 6,796 7,564 28,191 9,139 37,330
6
2019-20 Apr - Sep 5,337 724 58 4,154 2,895 13,168 5,004 18,172
6
2019-20 Oct - Mar 11,675 1,685 118 7,420 1,843 22,741 6,894 29,635
6
2019-20 Full Year 17,012 2,409 176 11,574 4,738 35,909 11,898 47,807
6
2018-19 Apr - Sep 5,698 508 156 3,543 .. 9,905 6,230 16,135
6
2018-19 Oct - Mar 12,074 749 158 7,872 .. 20,853 9,111 29,964
6
2018-19 Full Year 17,772 1,257 314 11,415 .. 30,758 15,341 46,099
6
2017-18 Apr - Sep 4,526 304 8 2,130 .. 6,968 6,501 13,469
6
2017-18 Oct - Mar 12,627 1,314 108 7,017 .. 21,066 7,616 28,682
6
2017-18 Full Year 17,153 1,618 116 9,147 .. 28,034 14,117 42,151
6
2016-17 Apr - Sep 7,218 308 42 1,838 .. 9,406 5,318 14,724
6
2016-17 Oct - Mar 14,895 629 8 4,201 .. 19,733 6,693 26,426
6
2016-17 Full Year 22,113 937 50 6,039 .. 29,139 12,011 41,150
6
2015-16 Apr - Sep 5,858 199 0 1,317 .. 7,374 3,952 11,326
6
2015-16 Oct - Mar 10,686 431 5 2,822 .. 13,944 7,838 21,782
2015-16 6 Full Year 16,544 630 5 4,139 .. 21,318 11,790 33,108
6
2014-15 Apr - Sep 7,487 698 0 1,242 .. 9,427 3,226 12,653
2014-15 6 Oct - Mar 14,392 547 21 2,071 .. 17,031 5,676 22,707
2014-15 6 Full Year 21,879 1,245 21 3,313 .. 26,458 8,902 35,360
2013-14 Apr - Sep 7,418 716 0 1,468 .. 9,602 2,496 12,098
2013-14 Oct - Mar 17,764 1,864 0 3,162 .. 22,790 3,413 26,203
2013-14 Full Year 25,182 2,580 0 4,630 .. 32,392 5,909 38,301
1 Since April 2012, the Mayor of London has had oversight of strategic housing, regeneration and economic development in
London. This means that Homes England no longer publishes housing starts on site and completions for London (current and
historical series) except for delivery in London under the Build to Rent, Builders Finance Fund, Get Britain Building and The
Home Building Fund – Short Term Fund (HBF – STF) programmes which are administered by Homes England on behalf of the
GLA. The historical series for London included in Homes England’s housing statistics published on 12 June 2012 (revised 24
August 2012) is available from: https://www.gov.uk/government/collections/housing-statistics
2 Figures by local authority and region are available in the accompanying tables.
3 Tenure will be determined on completion of the unit and will be restated in future releases under its appropriate tenure.
4 Total affordable housing is the sum of Affordable Rent, Social Rent, Intermediate Rent, Affordable Home Ownership and
Affordable Tenure TBC.
5 The market units delivered under the Accelerated Land Disposal, Build to Rent, Builders Finance Fund, Economic Assets, Get
Britain Building, Kickstart Housing Delivery, Local Authority Accelerated Construction, Property and Regeneration, Single Land
and the HBF – STF programmes may include some starts on site and completions which are made available at below market
price or rents but do not meet the definition for affordable housing.
6 To ensure consistent reporting with completions, with effect from 1 April 2014 the range of products reported for affordable
housing starts on site includes the start on site for new build homes where the procurement route is such that the provider
purchases the home at completion. For reporting purposes, the start on site date is taken as the date of completion.
“..” not applicable
14The tables and charts in this and future releases have been restricted to an eight-year rolling profile to avoid overcrowding pages
with excessively long graphics. For earlier years (going back to 2009-10) please see the accompanying tables and previous releases
available at https://www.gov.uk/government/collections/housing-statistics.
Page 6
OFFICIALChart 1a: Housing starts on site
40,000
35,000
30,000
Housing Units
25,000
20,000
Affordable
15,000 Market
10,000
5,000
0
2013-14 2014-15 2015-16 2016-17 2017-18 2018-19 2019-20 2020-21
Year
Chart 1b: Affordable Housing starts on site
30,000
25,000 Affordable Rent
20,000
Housing Units
Social Rent
15,000
Intermediate Affordable
Housing
10,000
Affordable Tenure TBC
5,000
0
2013-14 2014-15 2015-16 2016-17 2017-18 2018-19 2019-20 2020-21
Year
In the period 1 April 2020 to 31 March 2021 (financial year
2020-21, with comparisons to 2019-20):
3.1 A total of 37,330 homes started on site, representing a decrease of 10,477 or 22 per cent compared to
47,807. Levels of starts were the lowest since 2015-16 and this can be attributed to a slow-down in
housebuilding activity caused by the Covid-19 pandemic.
3.2 28,191 or 76 per cent of housing starts on site were for affordable homes – a decrease of 7,718 or 21
per cent compared to 35,909. Whilst some of this can be attributed to the Covid-19 pandemic
affecting housebuilding activity, 2020-21 is the last year of the SOAHP 2016-21 and, as such, there
was an expectation that levels of affordable starts would be lower than last year.
3.3 10,713 affordable homes started were for Affordable Rent, a reduction of 6,299 (37 per cent) on 17,012.
A further 7,249 were for Intermediate Affordable Housing schemes, including Shared Ownership and
Rent to Buy. This is a decrease of 4,501 (38 per cent) on 11,750. 2,665 were for Social Rent, an increase
of 256 (11 per cent) on 2,409. The increase in Social Rent starts follows the upward trend seen over
the last two years and is a reflection of the funding being focussed on intermediate tenures in the early
years of the 2016-21 programme with the grant funding opening up to Affordable Rent and Social
Rent in subsequent years. In addition, a further 7,564 affordable homes started with tenure to be
confirmed, an increase of 2,826 (60 per cent) on 4,738. All ‘tenure to be confirmed starts’ originate
from Strategic Partnerships where providers are not contractually required to identify the tenure of a
unit until completion. The increase in this type of starts from 2019-20 corresponds directly to the
Page 7
OFFICIALoverall increase in Strategic Partnership starts as the programme reached maturity in 20/21. The
tenure for these units will not be known until completion and they will be restated under their
appropriate tenure in future releases.
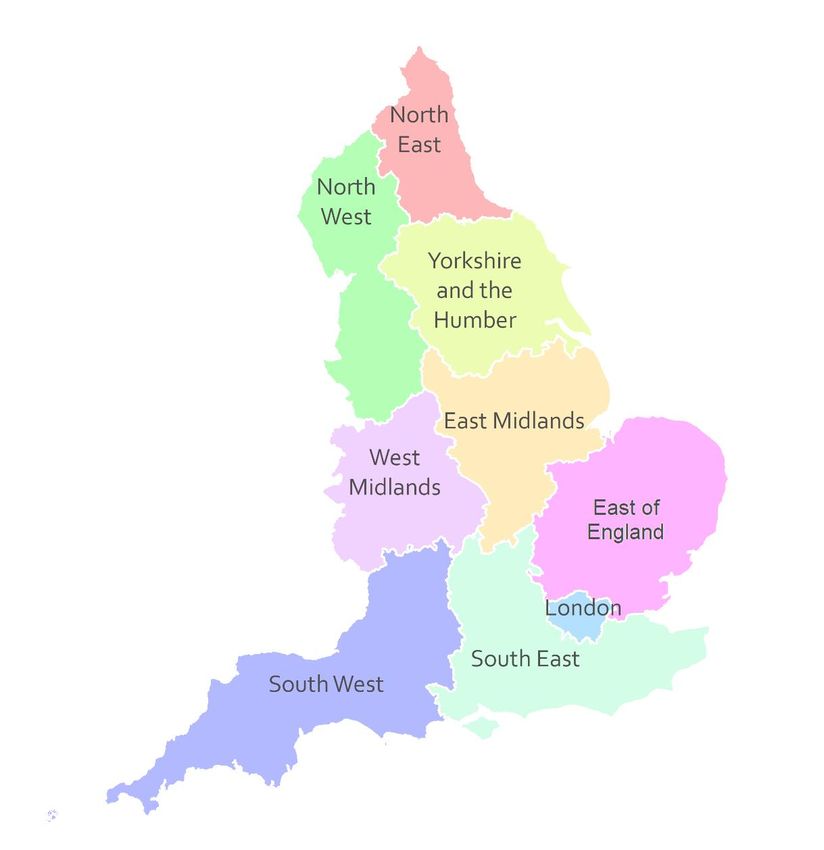
3.4 Table 1b below shows the percentage of Homes England’s affordable housing starts on site delivered
by each region15 compared to the previous year16, ranked highest to lowest. A map showing the region
boundaries is available at Annex 2.
Table 1b: Affordable Housing Starts on Site - Percentage Delivery by Region
2020-21 2019-20
North West 24% 17%
South East 18% 24%
East of England 13% 16%
West Midlands 11% 12%
South West 10% 10%
East Midlands 10% 7%
Yorkshire and The Humber 9% 8%
North East 6% 8%
London 1% 0%
3.5 The number of market starts on site reduced by 2,759 (23 per cent) to 9,139 compared to 11,898.
The SLP produced the majority of these at 5,619 or 50 per cent, the HBF – STF delivered 3,980 or 38
per cent and Local Authority Accelerated Construction (LAAC) delivered 1,371 or 12 per cent. The
drop in market starts is consistent with that in affordable starts and can be attributed to the impact
of Covid-19 on the construction industry during the year.
15 https://www.ons.gov.uk/methodology/geography/ukgeographies/administrativegeography/england#regions-former-gors
16 Note that proportions do not sum to 100 per cent due to rounding.
Page 8
OFFICIALCompletions (excluding Help to Buy):
Table 2a: Housing completions by tenure, England (excluding Help to Buy and non-Homes England London
delivery) 1, 2
Intermediate Affordable
Housing Total
Total
Affordable Affordable 5
Social Rent Affordable Market Housing
Rent Intermediate Housing
Home 4 Completions
Rent Completions
Ownership
2020-21 Apr - Sep 4,315 711 31 3,055 8,112 3,923 12,035
2020-21 Oct - Mar 8,991 1,195 67 5,658 15,911 7,049 22,960
2020-21 Full Year 13,306 1,906 98 8,713 24,023 10,972 34,995
2019-20 Apr - Sep 6,405 562 27 3,362 10,356 4,593 14,949
2019-20 Oct - Mar 10,458 918 104 6,390 17,870 7,526 25,396
2019-20 Full Year 16,863 1,480 131 9,752 28,226 12,119 40,345
2018-19 Apr - Sep 7,912 326 3 2,824 11,065 4,752 15,817
2018-19 Oct - Mar 10,977 668 42 5,964 17,651 6,618 24,269
2018-19 Full Year 18,889 994 45 8,788 28,716 11,370 40,086
2017-18 Apr - Sep 7,219 174 0 1,900 9,293 2,723 12,016
2017-18 Oct - Mar 12,544 859 34 3,132 16,569 5,321 21,890
2017-18 Full Year 19,763 1,033 34 5,032 25,862 8,044 33,906
2016-17 Apr - Sep 7,096 218 1 1,338 8,653 2,957 11,610
2016-17 Oct - Mar 11,184 373 4 2,671 14,232 5,252 19,484
2016-17 Full Year 18,280 591 5 4,009 22,885 8,209 31,094
2015-16 Apr - Sep 4,681 684 0 1,032 6,397 3,082 9,479
2015-16 Oct - Mar 8,419 813 2 1,759 10,993 4,919 15,912
2015-16 Full Year 13,100 1,497 2 2,791 17,390 8,001 25,391
2014-15 Apr - Sep 7,447 865 0 2,141 10,453 3,682 14,135
2014-15 Oct - Mar 23,387 2,124 18 4,882 30,411 6,218 36,629
2014-15 Full Year 30,834 2,989 18 7,023 40,864 9,900 50,764
2013-14 Apr - Sep 4,569 1,135 84 2,511 8,299 2,540 10,839
2013-14 Oct - Mar 12,525 3,340 19 3,423 19,307 4,281 23,588
2013-14 Full Year 17,094 4,475 103 5,934 27,606 6,821 34,427
1, 2, 4 See footnotes
below Table 1a on page 6
5 Some of the market completions delivered since 2013-14 may include houses sold to purchasers who have received assistance
through the Help to Buy scheme to buy a property at market value from a house builder where the scheme as a whole may have
benefitted from funding through another programme. Help to Buy is reported by MHCLG (see
https://www.gov.uk/government/collections/help-to-buy-equity-loan-and-newbuy-statistics)
Page 9
OFFICIALChart 2a: Housing completions (excluding Help to Buy)
45,000
40,000
35,000
30,000
Housing Units
25,000
20,000 Affordable
15,000 Market
10,000
5,000
0
2013-14 2014-15 2015-16 2016-17 2017-18 2018-19 2019-20 2020-21
Year
Chart 2b: Affordable Housing completions
35,000
30,000
25,000
Housing Units
20,000
Affordable Rent
15,000
Social Rent
10,000 Intermediate Affordable
Housing
5,000
0
2013-14 2014-15 2015-16 2016-17 2017-18 2018-19 2019-20 2020-21
Year
In the period 1 April 2020 to 31 March 2021 (financial year
2020-21, with comparisons to 2019-20):
3.6 34,995 homes were completed, a decrease of 5,350 or 13 per cent compared to 40,345. Levels of
completions were the lowest since 2017-18 and, as with housing starts, this can be attributed to a
slow-down in housebuilding activity caused by the Covid-19 pandemic.
3.7 24,023 affordable homes were completed, a decrease of 4,203 or 15 per cent compared to 28,226.
3.8 13,306 or 55 per cent of affordable completions were for Affordable Rent, a decrease of 3,557 or 21 per
cent compared to 16,863. Intermediate Affordable Housing accounted for a further 8,811 or 37 per
cent, a decrease of 1,072 or 11 per cent compared to 9,883. The remaining 1,906 or 8 per cent of
affordable homes completed were for Social Rent, an increase of 426 or 29 per cent compared to
1,480. The increase in Social Rent completions follows the upward trend seen over the last two years
and is a reflection of the funding being focussed on intermediate tenures in the early years of the
2016-21 programme with the grant funding opening up to Affordable Rent and Social Rent in
subsequent years.
Page 10
OFFICIAL3.9 Table 2b below shows the percentage of Homes England’s affordable housing completions delivered
by each region compared to the same period last year17, ranked highest to lowest.
Table 2b: Affordable Housing Completions - Percentage Delivery by Region
2020-21 2019-20
South East 22% 23%
North West 17% 16%
East of England 16% 16%
West Midlands 12% 10%
South West 10% 11%
East Midlands 8% 9%
Yorkshire and The Humber 8% 8%
North East 6% 7%
London 0% 0%
3.10 10,972 market homes completed, a decrease of 1,147 or 9 per cent compared to 12,119. Aside from
the impact of Covid-19 in this period, fluctuations in the number of market completions between
periods reflects the nature of the programmes, with different types and sizes of sites commencing at
different times and having varying build-out rates. The principal components are the HBF - STF with
5,754 completions or 52 per cent, the SLP with 4,254 completions or 39 per cent and BtR with 935
completions or 9 per cent.
4. Accompanying tables
4.1 The tables accompanying this release are available to download from the housing statistics page on
the Homes England section of GOV.UK18 and include the following:
Table 1
Housing starts on site and completions by programme and tenure for:
1 April 2020 – 31 March 2021 with half year analysis
1 April 2019 – 31 March 2020 with half year analysis
1 April 2018 – 31 March 2019 with half year analysis
1 April 2017 – 31 March 2018 with half year analysis
1 April 2016 – 31 March 2017 with half year analysis
1 April 2015 – 31 March 2016 with half year analysis
1 April 2014 – 31 March 2015 with half year analysis
1 April 2013 – 31 March 2014 with half year analysis
1 April 2012 – 31 March 2013 with half year analysis
1 April 2011 – 31 March 2012 with half year analysis
1 April 2010 – 31 March 2011 with half year analysis
1 April 2009 – 31 March 2010 with half year analysis
17 Note that proportions do not sum to 100 per cent due to rounding.
18 https://www.gov.uk/government/collections/housing-statistics
Page 11
OFFICIALTable 2a
Housing starts on site and completions by local authority district and tenure (all programmes except
Help to Buy), 1 April 2020 – 31 March 2021.
Table 2b
Housing starts on site and completions by local authority district and tenure (all programmes except
Help to Buy), 1 April 2019 – 31 March 2020.
Table 2c
Housing starts on site and completions by local authority district and tenure (all programmes except
Help to Buy), 1 April 2018 – 31 March 2019.
Table 2d
Housing starts on site and completions by local authority district and tenure (all programmes except
Help to Buy), 1 April 2017 – 31 March 2018.
4.2 Housing starts on site and completions by local authority district and tenure (all programmes except
Help to Buy) for historical periods are available to download from the Homes England housing
statistics web page19.
4.3 In a small number of cases, Homes England funding to an affordable housing provider may be to
support a person or family to be housed in a local authority that is different to the one in which they
currently reside. The local authority presentations in Table 2a, 2b, 2c and 2d are based on the local
authority district in which the house is located. These tables also identify the region in which each
local authority is located.
4.4 We can provide programme level statistics for specified local authority areas in response to requests
made to housing.statistics@homesengland.gov.uk.
5. Revisions
Revisions policy
5.1 Homes England has adopted the revisions policy developed by MHCLG20. This policy covers two types
of revisions.
Scheduled revisions
5.2 These statistics are drawn from funding and project administration systems and therefore updated
information can be provided by funding recipients and developers after the official statistics have
been extracted and compiled from these systems. This is particularly the case during the financial
year and figures for the first six months of the year, as reported in the November/December release,
are subject to scheduled revision in the release of financial year data in May/June. It is also possible
19 https://www.gov.uk/government/collections/housing-statistics
20 http://www.communities.gov.uk/documents/corporate/pdf/1466387.pdf
Page 12
OFFICIALfor revisions to be made for earlier periods, although procedures are in place to minimise the scale of
these.
5.3 As notified in our release of official statistics published on 11 June 2013, we will make scheduled
revisions once a year in May/June. These revisions will cover the first six months of the full year being
reported together with revisions for the previous two financial years. Data for earlier years will be
regarded as final and there will be no further changes.
Non-scheduled revisions
5.4 If a substantial error occurs as a result of the production process, the statistical release and
accompanying tables will be updated with a correction notice as soon as is practical.
5.5 If, as a result of new information, there are significant or noteworthy changes to the figures in years
outside of the scheduled revisions period, that information will be revised in the May/June release
together with scheduled revisions.
Revisions in this release
Revisions for the six-month period ending 30 September
2020, as published on 8 December 2020
5.6 The total housing starts figure for the Local authority Accelerated Construction (LAAC) programme
increased by 212 units from 350 to 562. The increase relates to 3 schemes where confirmation of the
starts was received after publication of the statistical release.
5.7 The total housing completions figure for the LAAC programme has increased by 11 units from 0 to 11.
The increase relates to a single scheme in which information was received after publication.
5.8 The total housing starts figure for the SOAHP 2016-21 has increased by 1,208 units from 7,858 to
9,066. The increase relates to Strategic Partnership starts connected with delivery processing routes
where the start is recorded at completion.
5.9 The total housing completions figure for the SOAHP 2016-21 has increased by 494 units from 6,708
to 7,202. The increase is a result of homes which were technically complete but not declared due to
delays in contracting caused by Covid-19.
5.10 The total housing starts figure for the SLP has decreased by 71 units from 1,777 to 1,706. The net
decrease relates to the receipt of updated information during the second half of the year on 5
schemes.
5.11 The total housing completions figure for the SLP has increased by 85 units from 1,360 to 1,445. The
net increase relates to the receipt of updated information during the second half of the year on 20
schemes.
5.12 The total housing starts figure for the HBF – STF has decreased by 10 units from 1,004 to 994. The
decrease relates to the reprofiling of units into the second half of the year on one scheme following
receipt of updated information from the developer.
5.13 The total housing completions figure for the HBF – STF has increased by 87 units from 2,657 to 2,744.
The net increase relates to the receipt of updated information during the second half of the year on
14 schemes.
Page 13
OFFICIALRevisions for the financial year ending 31 March 2020
(2019-20), as published on 8 December 2020
5.14 The total housing completions figure for the Build to Rent Programme has decreased by 94 units from
631 to 537. This decrease relates to a single scheme which was aborted.
5. 15 The total housing starts figure for the SOAHP 2016-21 has decreased by 4 units from 32,665 to
32,661. The decrease relates to three schemes that became inactive prior to completion.
5.16 The total housing completions figure for the SOAHP 2016-21 has decreased by 12 units from 22,830
to 22,818. The decrease relates to a single scheme where the units were transferred to a different
scheme, with completion occurring in the subsequent year.
5.17 The total housing starts figure for the SLP decreased by 84 units from 9,321 to 9,237. The net decrease
relates to 18 schemes that were updated following reviews and receipt of updated information from
developers.
5.18 The total housing completions figure for the SLP decreased by 3 units from 7,047 to 7,044. The net
decrease relates to 17 schemes that were updated following reviews and receipt of updated
information from developers.
5.19 The total housing starts figure for the HBF – STF decreased by 70 units from 4,541 to 4,471. The net
decrease relates to receipt of updated information from developers and project reviews on 5 schemes.
5.20 The total housing completions figure for the HBF – STF increased by 2 units from 5,701 to 5,703. The
net increase relates to receipt of updated information from a developer on 1 scheme and a correction
following a project review on 1 scheme.
Revisions for the financial year ending 31 March 2019
(2018-19), as published on 8 December 2020
5.21 The total housing completions figure for the Build to Rent Programme has decreased by 223 units
from 1,423 to 1,200. This decrease relates to a single scheme which was aborted.
5.22 The total housing starts figure for the SLP has increased by 109 units from 8,971 to 9,080. The net
increase relates to the receipt of updated information from developers and project reviews on 16
schemes.
5.23 The total housing completions figure for the SLP decreased by 41 units from 6,935 to 6,894. The net
decrease relates to the receipt of updated information from developers and project reviews on 6
schemes.
5.24 The total housing starts figure for the HBF – STF increased by 20 units from 7,860 to 7,880. The net
increase relates to the receipt of updated information from developers and project reviews on 8
schemes.
Revisions for the financial year ending 31 March 2018
(2017-18), as published on 8 December 2020
Page 14
OFFICIAL5.25 The total housing starts figure for the SOAHP 2016-21 has decreased by 6 units from 19,904 to
19,898. The decrease relates to units on one scheme that were subsequently removed from the
programme due to reclassification of the works carried out.
If you would like to comment on our revisions policy please contact Mike Shone by email at
housing.statistics@homesengland.gov.uk.
6. Definitions
Affordable housing
Affordable Housing is the sum of Affordable Rent, Social Rent, Intermediate Rent and Affordable Home
Ownership (Shared Ownership and Rent to Buy). Affordable homes are defined in line with the National
Planning Policy Framework21, published 27 March 2012 and updated 19 February 2019, as housing units (or
traveller pitches and bed spaces when describing a shared dwelling such as a hostel) provided to specified
eligible households whose needs are not met by the market. Eligibility may be determined with regard to
local authority allocations policies, local incomes and local house prices depending on the type of affordable
housing. Affordable housing should include provisions to remain at an affordable price for future eligible
households or for the subsidy to be recycled for alternative affordable housing provision. The term
‘affordable housing’ is equivalent to ‘social housing’ as defined in Section 68 of the Housing and
Regeneration Act 200822.
Affordable rented housing
Affordable rented housing is a form of social housing, introduced in 2011. It may only be delivered with
grant through the AHP 2011-15 and other associated and subsequent programmes or without grant by local
authority and other providers, where a contract or confirmation of the ability to charge an Affordable Rent
is in place. Affordable rented homes are let by local authorities or private registered providers of social
housing to households who are eligible for social rented housing. Affordable Rent is subject to rent controls
that require a rent of up to 80 per cent of the local market rent (including service charges, where applicable).
Social rented housing
Social rented housing is rented housing owned and managed by local authorities and private registered
providers, for which target rents are determined through the national rent regime. It may also include
rented housing managed by other persons and provided under equivalent rental arrangements to the above.
Intermediate affordable housing
Intermediate affordable housing is housing at prices and rents above those of Social Rent but below
market price or rents, and which meet the criteria as set out in the definition for affordable housing. These
can include Shared Ownership, equity loan products, Rent to Buy and Intermediate Rent. Intermediate
rented housing was eligible for funding under the now closed NAHP.
Equity loan scheme
Under an equity loan scheme for affordable housing, the majority of the cost (usually at least 70 per cent)
is funded by the purchaser through a mortgage and savings (deposit). The remaining cost of the home is
21 https://www.gov.uk/government/publications/national-planning-policy-framework--2
22 http://www.legislation.gov.uk/ukpga/2008/17/pdfs/ukpga_20080017_en.pdf
Page 15
OFFICIALpaid for by the government and the house builder through an equity loan. The property title is held by the
home owner who can therefore sell their home at any time and upon sale should provide the government
and the house builder the value of the same equity share of the property when it is sold. In the historical
series covered by this release, equity loan was available under FirstBuy, Kickstart and the NAHP (HomeBuy
Direct). There are a small number of equity loan cases in the current series.
Shared Ownership scheme
Under a Shared Ownership scheme for affordable housing, the purchaser pays for an initial share of
between 25 per cent and 75 per cent of the home’s value with the option to increase their ownership if they
later choose and can afford to do so. The provider owns the remaining share and rent is paid on the
landlord’s share. The rent is up to 3 per cent of the share’s value. Shared ownership properties are always
leasehold homes.
Rent to Buy scheme
Under the Rent to Buy scheme for affordable housing, homes are let at an Intermediate Rent to tenants
who plan to buy in the future but need a period of lower rents to help them to save for a deposit. After an
initial rental period (at least the first five years of the life of the property) the tenant has the option to buy
outright the home they are living in. Grant funded Intermediate Rent has to be set at no more than 80 per
cent of the market rate.
Market housing
Market housing is private housing (or bed spaces) for rent or for sale where the rental value or market price
is set mainly in the open market.
Acquisitions (non-new build)
Acquisitions (non-new build) are additions to affordable or market housing supply that take place without
building a new property. This can include the purchase of existing properties for use as affordable or market
housing. It may also include empty properties brought back into use. These will normally be long term
empty properties where rehabilitation works are required and which would not otherwise come back into
use without intervention. Conversions of existing affordable or market properties are only included where
there is substantial re-improvement works carried out to the fabric of the building (for example the
conversion of bedsits to self-contained apartments). Repairs or simple refurbishment of properties are not
included.
Housing starts on site
Housing starts on site are reported when the provider/developer and builder have entered into the house
building contract, the building contractor has taken possession of the site and the start on site works have
commenced. Starts on site are not applicable for Mortgage Rescue or for equity loan products delivered
under FirstBuy.
Housing completions
Housing completions are reported when the units are fit for occupation or, in the case of Mortgage Rescue
and equity loan products delivered under FirstBuy, the Kickstart Housing Delivery Programme, the AHP
2011-15 and the National Affordable Housing Programme, at the point of completion of the purchase.
Private registered providers
Page 16
OFFICIALPrivate registered providers, under the terms of the 2008 Housing and Regeneration Act23, are
organisations which provide social housing, either in a for-profit or not-for-profit capacity, and who are
registered on the Statutory Register of Providers of Social Housing maintained by Homes England. Most
private registered providers are housing associations. The term excludes local authorities, who also provide
social housing. Any private provider wishing to deliver Affordable Rent homes, who has not contracted with
Homes England through a Grant Agreement, must contract with Homes England through a Short Form
Agreement to deliver Affordable Rent without grant. The definition of private registered providers is not
affected by the Office for National Statistics’ decision to classify them to the private sector for National
Accounts and statistical purposes (16 November 2017)24.
7. Data sources and quality
7.1 Data for the following programmes have been produced using our Investment Management System
(IMS), which contains information provided by investment partners in accordance with monitoring
requirements for the payment of grant: Affordable Homes Guarantees, AHP, AHP 2015-18, Care and
Support Specialised Housing, Empty Homes, Empty Homes Round Two, FirstBuy, Homelessness
Change, Homelessness Change 2015-18, the Kickstart Housing Delivery Programme (HomeBuy
Direct and National Affordable Housing Programme), the Local Authority New Build Programme,
Mortgage Rescue, the National Affordable Housing Programme, Platform for Life, Rent to Buy, Right
to Buy Replacement, Short Form Agreements, SOAHP 2016-21 and Traveller Pitch Funding.
7.2 Data for the following programmes have been produced using our Project Control System (PCS),
which is maintained by our own staff based on the best information currently available: Accelerated
Land Disposal, Build to Rent, Builders Finance Fund, Economic Assets, Get Britain Building, Kickstart
Housing Delivery (Investment Support), Local Authority Accelerated Construction, Property and
Regeneration, Single Land and the HBF – STF programmes.
7.3 The levels of affordable housing starts on site and completions recorded in the first half of the year
reflect the historical annual delivery profile of the programmes. Homes England data is dependent
on the submission of grant claims by providers and historically the majority have been submitted in
the second half of the year. The table below shows the percentage of affordable housing delivered in
each half of the year since 2009-10.
23 http://www.legislation.gov.uk/ukpga/2008/17/pdfs/ukpga_20080017_en.pdf
24 Statement on classification of English housing associations, November 2017 - Office for National Statistics
Page 17
OFFICIALTable 3: Affordable Housing - Half Yearly Percentage Delivery
Total Affordable
Total Affordable
Year Period Housing
Housing Starts
Completions
Apr - Sep 35% 34%
2020-21
Oct - Mar 65% 66%
Apr - Sep 37% 37%
2019-20
Oct - Mar 63% 63%
Apr - Sep 32% 39%
2018-19
Oct - Mar 68% 61%
Apr - Sep 25% 36%
2017-18
Oct - Mar 75% 64%
Apr - Sep 32% 38%
2016-17
Oct - Mar 68% 62%
Apr - Sep 35% 37%
2015-16
Oct - Mar 65% 63%
Apr - Sep 36% 26%
2014-15
Oct - Mar 64% 74%
Apr - Sep 30% 30%
2013-14
Oct - Mar 70% 70%
Apr - Sep 13% 35%
2012-13
Oct - Mar 87% 65%
Apr - Sep 4% 28%
2011-12
Oct - Mar 96% 72%
Apr - Sep 27% 36%
2010-11
Oct - Mar 73% 64%
Apr - Sep 21% 37%
2009-10
Oct - Mar 79% 63%
Some of the significant variations are explained below:
- In 2011-12 delivery was lower than usual with 4 per cent of starts on site and 28 per cent of
completions delivered in the first half of the year. The low percentage of starts on site was atypical
because the distribution was impacted by the closure of the National Affordable Housing
Programme, the Local Authority New Build Programme and the Kickstart Housing Delivery
Programme to new commitments in March 2011. Delivery was further impacted by the AHP 2011-
15 programme not commencing delivery of housing starts until the second half of 2011-12.
- In 2012-13, 13 per cent of starts on site and 35 per cent of completions were delivered in the first
half of the year, reflecting an increase in delivery of the AHP 2011-15.
Page 18
OFFICIAL8. Related statistics
Affordable housing starts on site and completions funded
by Homes England and the GLA
8.1 Since April 2012, the Mayor of London has had oversight of strategic housing, regeneration and
economic development in London. This means that Homes England no longer publishes affordable
housing starts on site and completions for London, except for delivery in London under the Builders
Finance Fund (now called the Home Building Fund – Short Term Fund) and Get Britain Building
programmes which are administered by Homes England on behalf of the GLA. Responsibility for
publication of other London delivery has been taken over by the GLA. In addition to its annual release,
MHCLG combines half-year data from Homes England and the GLA to publish six monthly affordable
housing starts on site and completions delivered nationally under the affordable housing programmes
of Homes England and the GLA.
8.2 The combined statistics published by MHCLG are available from the MHCLG website25 and housing
statistics published by the GLA are available from the GLA website26. MHCLG has combined the
affordable housing statistics in this release with the GLA’s affordable housing statistics to produce
Table 1012 showing total affordable housing starts on site and completions delivered nationally under
the affordable housing programmes of Homes England and the GLA27.
8.3 Delivery of affordable homes forms part of the MHCLG business plan. Homes England is responsible
for the administration of the programmes that deliver affordable housing (as described in section 2)
and report on progress in their annual report28.
Affordable housing supply
8.4 The annual Affordable Housing Supply release published by MHCLG (see paragraph 2.2), includes
delivery of affordable housing, but not market housing. Starts information was only available from
data provided by Homes England and the GLA in 2015-16. For 2016-17 data on starts was also
collected from local authorities. However, the submission of starts data by local authorities is
voluntary as some of them may be unable to provide figures. This means that starts funded directly
by local authorities or by planning agreements that are not included in the Homes England or GLA
statistics were not included in 2015-16 data and may be under reported in subsequent publications.
Delivery through Homes England (and the GLA) accounts for the majority of Affordable Housing
Supply, but the scope of the statistics reported by MHCLG is wider. It also includes delivery through
other Homes England and GLA programmes not reported here as well as affordable housing not
covered by Homes England and GLA programmes that is reported in local authority returns to the
Ministry. The MHCLG publication provides less detail about the individual Homes England
programmes and focuses more on the properties of the units delivered, such as tenure and whether
they are new build or acquisitions. The ‘Data sources’ section of the MHCLG release provides more
information about the coverage of the release29.
25 https://www.gov.uk/government/collections/affordable-housing-supply
26 https://www.london.gov.uk/what-we-do/housing-and-land/increasing-housing-supply/affordable-housing-statistics
27 https://www.gov.uk/government/statistical-data-sets/live-tables-on-affordable-housing-supply
28 https://www.gov.uk/government/publications/homes-england-annual-report-financial-statements-201920
29 Affordable housing supply - GOV.UK (www.gov.uk)
Page 19
OFFICIALHelp to Buy
8.5 The Help to Buy (Equity Loan scheme) release published by MHCLG details the number of home
purchases and the value of equity loans under the Government’s Help to Buy: Equity Loan scheme.
Homes England is responsible for all Help to Buy (Equity Loan scheme) delivery including London.
The number of home purchases delivered through Homes England is published by MHCLG together
with information about the type and price of properties purchased, purchaser deposits and applicant
incomes30.
30 https://www.gov.uk/government/collections/help-to-buy-equity-loan-and-newbuy-statistics
Page 20
OFFICIAL9. Other information
Pre-release access
9.1 Details of officials who receive pre-release access to the release up to 24 hours before publication are
available from the housing statistics page on the Homes England section of GOV.UK31.
A brief history of Homes England
9.2 Homes England was launched by the Secretary of State on 11 January 2018. Homes England is the
trading name of Homes and Communities Agency (HCA) (the legal entity). The HCA was created on
1 December 2008 by bringing together the regeneration body English Partnerships (including the
Property and Regeneration programme), the investment arm of the Housing Corporation (including
the National Affordable Housing Programme), the Academy for Sustainable Communities and a
number of housing and regeneration programmes from the MHCLG. In October 2011, the HCA took
responsibility for the land and property assets of eight of England’s nine Regional Development
Agencies, ahead of their operational closure in March 2012. On 1 April 2012, the HCA’s former London
operating area transferred to the GLA.
United Kingdom Statistics Authority
9.3 The United Kingdom Statistics Authority has designated these statistics as National Statistics, in
accordance with the Statistics and Registration Service Act 2007 and signifying compliance with the
Code of Practice for Official Statistics.
Designation can be broadly interpreted to mean that the statistics:
• meet identified user needs;
• are well explained and readily accessible;
• are produced according to sound methods; and
• are managed impartially and objectively in the public interest.
Once statistics have been designated as National Statistics it is a statutory requirement that the Code
of Practice shall continue to be observed.
Future publication dates
9.4 Our official statistics for the period 1 April 2021 to 30 September 2021 will be published in
November/December 2021.
Responsible statistician
9.5 The responsible statistician for this statistical release is Mike Shone.
31 https://www.gov.uk/government/collections/housing-statistics
Page 21
OFFICIAL10. User consultation
10.1 Users’ comments on any issues relating to this statistical release are welcomed and encouraged.
Responses should be sent to the “Statistical Enquiries” address given below:
Enquiries
Media Enquiries Email: media@homesengland.gov.uk
Tel: 020 7874 8262
Statistical Enquiries Mike Shone (c/o)
Email: housing.statistics@homesengland.gov.uk
Tel: 01234 242537
Page 22
OFFICIALAnnexe 1
Homes England’s programmes
The following table and links provide information about Homes England’s programmes which are funded by
the Ministry of Housing, Communities and Local Government except for Care and Support Specialised
Housing, Homelessness Change 2015-18 and Platform for Life which are funded by the Department of
Health:
Programme Programme Summary Tenure 1 Build
Type 2
The Accelerated Land Disposal programme was Social Rent NB
announced in the Budget 2011 to support the / AHO /
Accelerated Land additional or accelerated delivery of 3,000 housing Market
Disposal starts on site by 31 March 2015. With effect from 1
April 2015, existing commitments transferred to the
Single Land Programme.
On 6 September 2012, the Government announced its Aff. Rent / NB/A
proposal to guarantee up to £10bn of debt to help Social Rent
housing providers expand the provision of both / AHO
purpose built private rented and affordable housing.
As well as the Guarantee for the Affordable Homes
Affordable Homes element, the Government confirmed that it would
Guarantees make £225m of funding available for new affordable
housing, for use where needed alongside the
Affordable Homes Guarantee. This funding was then
doubled in the 2013 Budget to £450m, including
London, to support up to 30,000 new affordable
homes.
The Affordable Homes Programme was announced as Aff. Rent / NB/A
part of the Government’s Spending Review 2010 and Social Rent
Affordable Homes
delivered over 58,000 (excluding London) new / AHO
Programme 3
affordable homes by 31 March 2015, with rents set at
up to 80 per cent of market rent.
The Affordable Homes Programme 2015-18 replaced Aff. Rent / NB/A
the Affordable Homes Programme 2011-15 and aims to Social Rent
Affordable Homes
increase the supply of new affordable homes in / AHO
Programme 2015 -
England by March 2018. It is now closed although (Shared
18
commitments agreed under this programme will be Ownership)
delivered during the 2016-21 period.
The Build to Rent Fund was launched in December Market NB
2012 in response to the recommendations of the
Montague report to stimulate new private rented
Build to Rent
housing supply and to provide opportunities for new
institutional investment in the sector. It will support
the delivery of up to 10,000 new homes.
Page 23
OFFICIALProgramme Programme Summary Tenure 1 Build
Type 2
The £525 million Builders Finance Fund is designed to Social Rent NB/A
help restart and speed up housing developments / Int. Rent /
between 5 and 250 units that have slowed down or AHO /
stalled. Its main objective is to address difficulties in Market
Builders Finance
accessing development finance faced by some house
Fund
builders, particularly smaller developers, and to help
bring forward stalled but viable sites. With effect from
October 2016, existing commitments transferred to
the Home Building fund – Short Term Fund.
The Department of Health’s Care and Support Aff. Rent / NB/A
Specialised Housing Fund (CASSH) provides funding Social Rent
for housing for older people and adults with disabilities / AHO
(physical or sensory disabilities, mental health needs (Shared
Care and Support and learning disabilities & autism). Ownership)
Specialised Housing The fund is spilt into two phases. Phase 1 was launched
Fund in October 2012 and phase 2 was launched in February
2015. The initial budget for the programme was £160m
over five years (2013-14 to 2017-18) outside London. In
2013, this was increased by a further £80m and the
delivery time frame extended to 2020-21.
The Economic Assets programme was announced in Social Rent NB/A
the Budget 2011 and worked with partners to ensure / Int. Rent /
the effective use and disposal of more than 300 land AHO /
Economic Assets and property assets transferred from the former Market
Regional Development Agencies. With effect from 1
April 2015, existing commitments transferred to the
Single Land Programme.
The Empty Homes programme was announced as part Aff. Rent / A
of the Government’s Spending Review 2010 to bring Social Rent
back into use empty residential properties (in private / AHO
Empty Homes 3
ownership) as affordable housing. The programme
delivered 2,759 homes by 30 September 2016 outside
London.
In November 2012 a second round of funding was Aff. Rent / A
launched to bring back into use empty properties as Social Rent
affordable housing. As well as residential properties (in / AHO
Empty Homes
private ownership), the programme had an emphasis
Round Two
on the refurbishment of empty commercial and non-
residential properties. The programme delivered 868
homes by 31 March 2017 outside London.
The FirstBuy scheme was announced in the Budget AHO NB
2011 to help support 10,000 first time buyers on the
FirstBuy property ladder. The scheme was expanded in
September 2012 and from 1 April 2013 was replaced
with Help to Buy
The Get Britain Building programme was set up to Social Rent NB
unlock more than 12,000 homes on stalled sites with / Int. Rent /
Get Britain Building
planning permission through access to development AHO /
finance. Market
Page 24
OFFICIALProgramme Programme Summary Tenure 1 Build
Type 2
Help to Buy was announced in the Budget 2013 to help Market NB
purchasers struggling to buy a new build home. It
offers a maximum 20% (40% in London) equity loan
(minimum 10%) on new build properties up to a
maximum purchase price of £600,000.
Launched in April 2013 with an initial budget of £3.7bn,
the programme aspired to support 74,000 plus
homebuyers in the first 3 years. The 2015 Spending
Review confirmed £8.6bn of funding and extended the
programme to 2021 to assist an anticipated 145,000
purchases. In October 2017, the Government
Help to Buy (equity announced it will invest a further £10 billion in the Help
loan) to Buy Equity Loan programme.
More than 130,000 completions have already taken
place by people using the equity loan, which helps
people buy a new build home with only a 5% deposit.
The new funding means that the Help to Buy Equity
Loan could help around 135,000 more people to buy
homes by 2021. This would bring the total number of
households across England that would be supported
through the scheme since it began in 2013 to around
360,000.
The Homelessness Change Programme was Aff. Rent NB/A
announced as part of the Government’s Spending
Homelessness
Review 2010 and delivered 1,128 new or refurbished
Change 3
bed spaces in hostel accommodation by 31 March 2015
(outside London).
Homes England is allocating a share of up to £25 Aff. Rent NB/A
million capital funding for specialist housing providers,
on behalf of the Department of Health, to bring
forward proposals for developing and improving hostel
accommodation and facilities for the delivery of
healthcare, training or education aimed at supporting
Homelessness
rough sleepers, those at risk of sleeping rough, and
Change 2015-18
other non-statutory homeless people of specialist
housing to meet the needs of older people and adults
with disabilities or mental health problems outside of
London.
This programme was launched jointly alongside the
Platform for Life fund in March 2015.
The Kickstart Housing Delivery programme was part of Social Rent NB
Kickstart Housing the 2009 Housing Stimulus Programme investing in / Int. Rent /
Delivery restarting more than 20,000 homes on stalled sites. AHO /
The programme closed on 31 March 2013. Market
Page 25
OFFICIALYou can also read