HOUSING NEEDS ASSESSMENT - Marquette county December 2020 - Cuppad
←
→
Page content transcription
If your browser does not render page correctly, please read the page content below

HOUSING
NEEDS
ASSESSMENT
Marquette county
December 2020
EXISTING CONDITIONS REPORT                   //                           DECEMBER 2020

ABOUT THE HOUSING
NEEDS ASSESSMENT
   The Central Upper Peninsula Planning and Development Regional Commission
   (CUPPAD) is a voluntary association of local governments that coordinate regional
   planning efforts related to economic, social, and physical development and
   conservation within its six-county region of Alger, Delta, Dickinson, Marquette,
   Menominee, and Schoolcraft Counties.

   A number of housing-related challenges are present within the six-county region.
   These challenges include an increase in the amount of homes being purchased for
   seasonal residence, growth in the number of houses that are not being used for
   primary residences but rather as an investment tool through the use of Airbnb or
   Vacation Rental By Owner (VRBO), a mismatch between residential incomes and
   housing stock availability, and housing affordability. These issues are nuanced and
   differ among the six counties within CUPPAD’s planning area.

   CUPPAD has developed a multidisciplinary study to collect, organize, and review
   demographic, economic, and housing data that are influencing housing issues.
   Additionally, Focus Groups were formed to ground truth the data and to provide
   additional, real life anecdotes regarding experiences with housing issues. The data
   and community narratives inform this report. Full data sets can be available upon
   request.

MARQUETTE COUNTY
   Marquette County leaders in the public and private sector have been paying close
   attention to the housing market and how trends have shifted in recent years. One
   topic of importance to leaders is how to maintain affordability with both new
   development and redevelopment efforts given high construction costs and skilled
   labor shortages. In Ishpeming and Negaunee, residents appreciate the affordable
   cost of living, but remark that it can be challenging to spur new housing
   development efforts; more than half the housing stock in these communities is over
   50 years old and often in need of repair. In the City and Township of Marquette,
   housing prices are rising consistently and threaten displacement, particularly for
   potential younger home buyers. In addition, rent prices are at an all time high.

   The following report was developed through data collection and analysis, as well as
   through feedback from public and private sector industry leaders, such as economic
   development specialists, contractors, lenders, and landlords. Data was largely
   sourced from the American Community Survey 2012-2017 5-year surveys.
EXISTING CONDITIONS REPORT                   //                           DECEMBER 2020

A NOTE ABOUT THE
CORONAVIRUS (COVID-19)
   Please note that while this report is being released during a major global health
   pandemic, the bulk of the work including data collection, analysis, and focus group
   meetings occurred prior to the outbreak.

   Impacts from Covid-19 are unprecedented in the modern world. Social distancing,
   self-isolation and self-quarantining, and travel restrictions have led to a reduced
   workforce across all economic sectors and caused many jobs to be lost. Schools
   and childcare facilities have closed down, and the need for commodities and
   manufactured products has decreased. Further, these societal adjustments are not
   expected to change until a vaccine is produced to protect the population against
   the sometimes deadly virus. As such, there are unforeseen economic affects that
   will exacerbate hardships for certain demographics. As of November 2020 we still
   face uncertainty in many topics, such as to when a vaccine will be produced and
   exactly how long and to what extent the economy will be impacted.

   The majority of data contained in this report should be considered "pre-Covid" and
   does not reflect, for instance, impacts to wages or employment that are anticipated
   to result from the pandemic.
EXISTING CONDITIONS REPORT                       //                          DECEMBER 2020

                                 ANALYSIS IN BRIEF
 Key findings

 Trends indicate a hot housing market.                prices and the rate of change in incomes
 Since 2000, the increase in housing prices in        (see pages 11, 25).
 Marquette County ranks highest of
                                                      A housing affordability challenge
 Michigan's 83 counties.
                                                      persists for renters. Although there are
 This trend does now show itself equally              affordable housing services within the
 across the county, however - one half of             county, nearly half, 48 percent, of
 homes in Ishpeming and Negaunee are                  Marquette County renters are paying more
 valued less than $100,000, while 40 percent          than 30 percent of their income on rent,
 of homes in Marquette City and Township              compared to only 17 percent of
                                                      homeowners (see pages 32-33).
 are valued over $200,000. Per November
 2020 realtor.com data, the average listing           This impacts in particular those at the lower
 price between the three communities varies           end of the income spectrum; 76 percent of
 by as much as $160,000 (see page 26).                renters earning at the lower end of the
                                                      income spectrum - less than $20,000 per
 Local developers have referred to homes
                                                      year - are paying more than 30 percent of
 priced around $250,000 as "the sweet spot,"
                                                      their income on rent. More than 50 percent
 as trends indicate this is a comfortable
                                                      of renters in the subsequent income
 price point for prospective buyers and, for          bracket - those earning $20,000 to $35,999
 new builds, developers are able to profit            annually - are facing the same issue. The
 from the sale. Approximately one-third of            median rental price for all housing types in
 homes in Marquette are currently listed for          the City of Marquette listed in November
 sale around this price point, compared to            2020 is over $1,000 per month (see page
 less than five percent in Ishpeming and              31). This indicates that a large proportion of
 Negaunee.                                            lower income renters are impacted by rental
                                                      rates that are pushing them beyond their
 Home prices are increasing more
                                                      means.
 quickly than incomes. Median household
 incomes have risen by 36 percent between             Conversations with the focus group
 the years 2000 and 2017, while home sale             participants revealed that there are no
 prices have risen by 68 percent. Housing             vacancies and lengthy wait lists for
 affordability is threatened when there is a          subsidized housing opportunities (see page
 gap between a rate of change in housing              38).

                                                                                           p. 03
EXISTING CONDITIONS REPORT // DECEMBER 2020
ANALYSIS IN BRIEF
Key findings
One third of all households are headed homes in Marquette City and Township and
by someone of retirement age in 72 percent of homes in Ishpeming &
Marquette County. Further, those aged Negaunee were built before 1950 or pre-
45-64 comprise the largest age group in the WWII era. A look at homes listed for sale on
county. As this age group ages, the the market reveal that older homes are
retirement-aged population is projected to priced lower than those more recently built
increase by the year 2030 (see page 9). This (see pages 27-28). Older homes are less
trend has implications for housing, as older likely being maintained and may be out of
residents may look to downsize and/or may sync with housing trends. Focus group
require assisted living, in-home care, or participants expressed a desire for
healthcare linked with housing. Focus group educational resources that teach residents
participants in Ishpeming and Negaunee how to affordably care for aging homes.
noted that older people wanting to sell
Current zoning may be limiting new
often do not have an option for low
development opportunities and
maintenance living. Many want to take their
impacting affordability. In Marquette,
pets or need main floor or options with an
Focus Group participants noted that lot
elevator and don't want to leave their
sizes and setbacks are limiting infill
communities of Ishpeming, Negaunee,
opportunities, tools that could incentivize
Gwinn, or Skandia.
affordability. Participants noted that by
There is a high demand for a mix of allowing a diverse array of housing types -
housing formats. Market data shows that multi-family, accessory dwelling units,
the median list price for condos and cottage housing in more single family
townhomes are substantially higher than neighborhoods, density can increase
that of single family homes in the City of without drastically changing neighborhood
Marquette (see page 30). This, coupled with character (see page 38).
the large proportion of elderly homeowners,
Opportunities exist to link new
indicate a near-term need for housing
developments in conjunction with
options that meet the needs of this
transit. Coordinating housing
demographic.
developments with existing infrastructure is
A large proportion of homes are older the easiest target for quick and cost-
and in need of upgrades. Roughly 40 of effective antidotes to sprawl.
p. 04EXISTING CONDITIONS REPORT // DECEMBER 2020
ANALYSIS IN BRIEF
Key findings continued
The stock of rental units is notably low to work from home, mothers often are
and in high demand within portions of forced to make difficult choices between
the community. At the time this report adequate childcare and employment. Front-
was written there were no rental units listed line workers such as those in the service or
in Negaunee. In Marquette, the current healthcare industries are also
asking median rental price for any size or predominately female and have more
housing type is over $1,000, which is close interaction with the general population
to $300 more than the median rental price despite distancing requirements. Spillover
according to American Community Survey impacts of this global pandemic are broad
data in 2017. and far-reaching and will inevitably impact
housing and the ability to make ends meet
Conversion from some single family units to for some segments of the population.
multi-unit residences could benefit the
community. Communities should
review local ordinances for district regulations
that only permit single family by-right (R-1
zones) and amend those to allow more
possibilities. For further discussion of this
see page 30.
Single family households headed by
women earn the least across all family
types (see page 15). These households are
the most susceptible to suffering financial
burdens from housing costs. Further, this
reality is magnified in light of Covid-19, as
many single-parent women headed
households are disproportionately impacted
by the economic hardships caused by the
virus. For instance, distancing requirements
impact access to childcare and, without
flexibility in work schedules or the option
p. 05CONTENTS
SECTION 1
DEMOGRAPHICS - p. 8 - 9
population and household trends
age distribution
SECTION 2
SOCIOECONOMICS - p. 11-18
Median Household Incomes
by household type
by age of householder
by sex of householder
by race of householder
& housing affordability
living wage
SECTION 3
HOUSING - p. 20 - 34
tenure & occupancy
tenure over time
tenure by family type
housing price index
median home value (all housing stock)
on the market
age of housing stock
on the market
housing units by type
on the market
median rents
by income bracket
housing costs as percentage of income
affordable housing services
SECTION 4 FOCUS GROUP FEEDBACK - p. 36 - 40SECTION 1 DEMOGRAPHICS POPULATION AND HOUSEHOLD TRENDS............................P. 8 AGE DISTRIBUTION............P. 9
EXISTING CONDITIONS REPORT                                                                                        DECEMBER 2020

01 - DEMOGRAPHICS

    Population and Household Trends
    Population projections were obtained from the State of Michigan's Department of Technology, Management
    and Budget forecasts. The forecasts take into account historic rates of death, birth, immigration and out
    migration.

    >> Understanding growth and shrinkage trends help planners and policy makers anticipate for
    the changing dynamics within their communities.

     Chart 1. Marquette County Population: 2000-2017 and Projections: 2020-2045

75,000             64,600 people                    67,000 people                                                ---------------- ----------------
                                                                 --------------- --------------- ---------------                      70,500 people
                           3.7% increase
50,000
                           2000 to 2017                                                          6% projected increase
                                                                                                 2020 to 2045
25,000

    0
               2000                        2010   2017          2020           2025           2030          2035           2040           2045

     Marquette County's population has increased slightly since                       ACS-5 year estimates. 2017. S1901. Decennial Census. 2000,
                                                                                      2010. DP-1.
     the year 2000. The county experienced a population loss
                                                                                      State of Michigan Department of Technology, Management
     from 1980's to 2000, after experiencing a steady increase                        and Budget. Bureau of Labor Market Information and
     from the 1950's to 1980. The county's population is                              Strategic Initiatives. "Michigan Population Projections by
     projected to increase by six percent by 2045.                                    County through 2045." September 2019.

    Number of Housing Units and Number of Households
     The comparison of housing units to the number of households within a community is a basic measure of
     supply and demand. >> Housing units should exceed the number of households within a community
     by a small margin, in order to ensure there is an adequate supply of dwelling units to house the
     total population.

    Chart 2. Number of households compared to housing units, Marquette County, 2000-2017

   40,000                                                                        The total number of households within Marquette
                                                                                 County has grown by 1,000 households over the last
   30,000                                                                        two decades. Approximately 1,850 housing units
                           Housing Units

                                                                                 have been added to the community over the same
              Houesholds

   20,000                                                                        time period. The surplus in housing units might be
                                                                                 explained by second home units, as second homes
   10,000                                                                        add a housing unit but not a household to the
                                                                                 housing inventory.
         0
                    2000                   2010   2012        2017
                                                                                                                                     p. 08
               00

               00

               10

               10

               12

               12

               17

               17
             20

             20

             20

             20

             20

             20

             20

             20

     ACS-5 year estimates. 2017, 2012, 2010. DP04. Decennial Census. 2000,. DEC-Summary File 1.
EXISTING CONDITIONS REPORT DECEMBER 2020
01 - DEMOGRAPHICS
Age Distribution
Population and demographic data on are based on analysis of the Census Bureau’s American Community
Survey (ACS) and the age projections are sourced from the State of Michigan's Department of Technology,
Management and Budget forecasts. Estimates account for the civilian, non-institutionalized population.
>> The age structure of a population affects key socioeconomic issues. For instance, communities
with young populations (high percentage under age 15) might focus attention on schools, while
counties with older populations (high percentage ages 65 and over) should invest in health sectors.
Age Distribution Today Population Projections: Marquette County
The largest portion of the population is considered Statewide projections forecast an increase
“working age” or between the ages of 18 and 65. across all age groups. School-aged children and
The 18-34 age group is largest in Marquette, due, adults aged 20-34 are projected to increase the
in part, to the presence of Northern Michigan most, by 11 and 12 percent respectively.
University. The age group of school-aged children
is slightly larger than the age group of retirees in The 65 and older age group increases in
Negaunee and Ishpeming. number by nearly 18 percent by the year 2030,
and then subsequently levels out to today's
As the large 35 to 65 year old group ages, the population totals, increasing by only 500 more
communities should be prepared to address an people by 2045.
increase in healthcare needs and shifts in housing
demands, as well as changes to the tax base. The 35 to 65 year old age group is the largest in
the county.
Table 1. Age Distibution, 2017
Chart 3. Change in Age Distribution Projection,
Marquette County, 2020-2045
Age Marquette City & Negaunee &
Group Township Ishpeming 25,000 35-65: 2% increase
Count Percentage Count Percentage
20,000
Population
2,800 12% 2,500 23%
Under 18
15,000
Population
10,300 44% 2,300 20%
18-34 20-34: 12% increase
10,000
Under 19: 11% increase
Population
7,000 30% 4,400 39% 65+: 3% increase
35-65
5,000
Population
3,200 14% 2,100 19%
65 and over
0
2020 2025 2030 2035 2040 2045
ACS-5 year estimates. 2017. S1903, Census tracts. State of Michigan
Department of Technology, Management and Budget. "Michigan
Population Projections by County through 2045." September 2019.
p. 09SECTION 2 SOCIOECONOMICS MEDIAN HOUSEHOLD INCOMES over time .........................................p. 11 by household type ..........................p. 12 by age of householder ....................p. 14 by sex of householder ....................p. 15 by race of householder ..................p. 16 & housing affordability ...................p. 17 LIVING WAGE living wage and cost of living..........p. 18
EXISTING CONDITIONS REPORT DECEMBER 2020
02 - SOCIOECONOMICS
Median Household Income
Median household income, also referred to as the Area Median Income (AMI), is the midpoint of a region’s
income distribution – half of households in a region earn more than the median and half earn less.
In the U.S., median household incomes vary by a number of factors, such as geography, family structure, age,
race, sex, and education. The following pages will explore various median household income indicators and
how these measures relate to housing and policy.
>>Income data highlights variations among populations and can help leaders evaluate policies to
address associated challenges.
Median Household Income Over Time ----------------
Chart 4. Median household income 2000-2017,
Marquette County
The median household income in Marquette
County in 2017 is $48,500. Median household $60,000
incomes rose by 36 percent between 2000 and
2017 (see chart 4). However, when adjusted for $40,000
inflation to 2017 dollars we see that incomes
have not kept up with inflation and actually $20,000
decreased by 11 percent. Notably, incomes rose
slower between 2009 and 2017 than they did
$0
between 2000 and 2009, due to the 2008 2000 2009 2012 2017
recession and recovery period between 2010 Incomes, Marquette County
and 2014. Incomes adjusted to 2017 dollars
A 2019 study conducted by the Organization for ACS-5 year estimates. 2012, 2009, 2017. S1901. Decennial Census.
DP03. https://www.bls.gov/data/inflation_calculator.htm
Economic Cooperation and Development
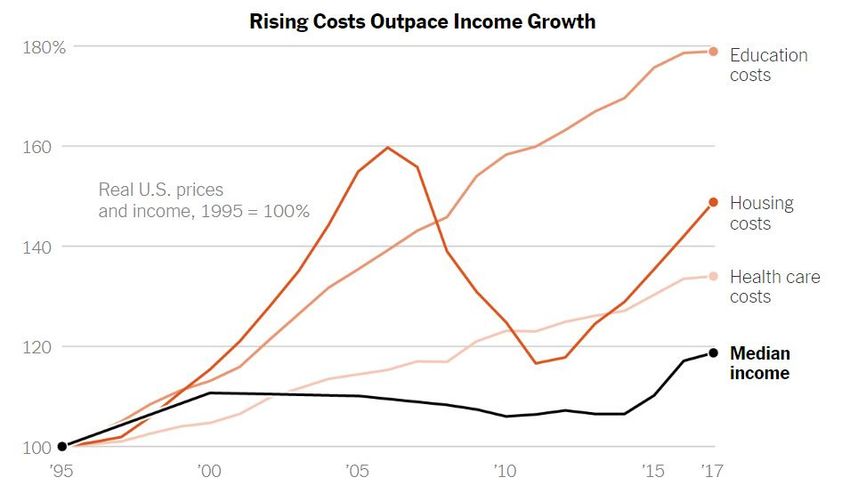
looked at rates of change in a number of Chart 5. Change in Household Expenses, 2000-2017,
indicators between 1995 and 2017 (see chart U.S.
5). While median incomes rose by 20 percent 180%
Real U.S. Prices Education
within this 22 year spread, spending on and incomes, 1995 = 100% Costs
healthcare, education, and housing rose 160%
Housing
between 30 and 80 percent (see chart 5). The Costs
study found that American households spend 140%
significantly more of their budgets on housing
Healthcare
and less on items like food than they did in Costs
120%
previous decades. Rising costs leave Median
households facing difficult choices between Income
100%
choosing to pay for more immediate needs like
'95 '00 '05 '10 '15 '17
housing and food rather than education and
NY Times. Tara Siegel Bernard and Karl Russell. October 3, 2019. "The
preventative and/or regular healthcare like
Middle-Class Crunch: A Look at 4 Family Budgets"
checkups and dentist appointments.
p. 11EXISTING CONDITIONS REPORT DECEMBER 2020
02 - SOCIOECONOMICS
Area Median Income by Household Type
The Area Median Income (AMI) is the midpoint of a region’s income distribution – half of families in a region
earn more than the median and half earn less. Households are broken into two groups: families and non-
families. A family household is two or more people (one of whom is the householder) related by birth,
marriage, or adoption residing in the same home. A non-family household may consist of a person living alone
or multiple unrelated individuals living together. These two household groups are further divided into
subgroups: families (1) with (2) without children, (3) married couple families, (4) single parent households, etc.
and non-families (1) female householder and (2) male householder. Family and non-family numbers contain
the universe of family and non-family types in their counts.
>> U.S. ACS data shows that median incomes vary depending on the type of household described.
Sixty percent of all households in Marquette Chart 6. Household composition: families & non
County are families (see chart 6), with married- families, Marquette County
couple families accounting for 80 percent of
Non-Families
total families and 48 percent of total 40%
households in the county (see chart 7). Non Familes
married and/or single parent households 60%
account for approximately 20 percent of
familial households in the county. There are Chart 7. Estimated number of households by type,
Marquette County
three times the amount of female single parent
families than male single parent families in the 30,000
county.
20,000
More than half of the households in the City
10,000
and Township of Marquette are non-families,
likely due to the presence of Northern
0
Michigan University. In Ishpeming and
Fa lds
m ple ed tho hil s
M ho am up chil n
ho eho s w Fam en
c ies
-F r w ch en
Fe ily h c ren
M Ho eh n
e se ds
ho r
er
se de
Fe ou arri wi th c ilie
e
s e
Negaunee, 53 percent of households are
ld
al u ol
dr
al us ilie le dr
r
al ou r
ho
us ld ith il
N hold wit hild
am it ild
m H hild
ou hol
s wi m
se
families and 47 percent are non family
ou
e F Co ut
on e h
lH
H
households (see chart 8).
Al
s
e er
e
e
am ili
-
m
d- M e i
Fa
il
F
e
al
C
Chart 8. Household composition: families & non
rie
families, City & Township of Marquette (left),
ar
M
Ishpeming & Negaunee (right)
City & Township of Ishpeming & Negaunee
Non-Families Marquette
Familes
42% Non-Families
Familes 47%
53%
58%
p. 12
ACS-5 year estimates. 2017. S1901.EXISTING CONDITIONS REPORT DECEMBER 2020
02 - SOCIOECONOMICS
Area Median Income by Household Type, cont.
The Area Median Income (AMI) is the midpoint of a region’s income distribution – half of families in a region
earn more than the median and half earn less. Households are broken into two groups: families and non-
families. A family household is two or more people (one of whom is the householder) related by birth,
marriage, or adoption residing in the same home. A non-family household may consist of a person living alone
or multiple unrelated individuals living together. These two household groups are further divided into
subgroups: families (1) with (2) without children, (3) married couple families, (4) single parent households, etc.
and non-families (1) female householder and (2) male householder. Family and non-family numbers contain
the universe of family and non-family types in their counts.
>> U.S. ACS data shows that median incomes vary depending on the type of household described.
Married couples with children are the highest Chart 9. Median household income by household type,
earners across household types (see chart 9). Marquette County
Married-couple families with children earn
$100,000
approximately $20,000 more than the county-
$75,000 median income
wide median household income.
all households
$50,000
Non-family households earn approximately $25,000
$20,000 less than the median household.
$0
d- M ilie s w Fam ds
m ple ied tho hi s
M ho am up chi n
ho eho s w Fa en
N hold wit hild s
-F r w ch ren
Fe ily th c ren
M Ho seh n
e se ds
ho r
er
se de
Fe ou rr wi th c ilie
c ie
e F -Co ut dre
e
Single male householders with children (3
ld
l
al u ol
r
al ou dr
ho
us ld ith mil
al us ilie le ld
ild
ou hol
l
m H hil
se
percent of families) earn approximately $7,000
ou
on e h
lH
i
am i
H
less than the median household income
Al
e er
e
e
am ili
s
($41,700), but $19,000 more than single female
m
Fa
a
householder homes with children (8 percent of
F
e
families; $22,800 annually).
al
C
rie
ar
M
Females earn approximately $12,000-$19,000
less annually than their male counterparts
across all single earner household types.
p. 13
ACS-5 year estimates. 2017. S1901.EXISTING CONDITIONS REPORT DECEMBER 2020
02 - SOCIOECONOMICS
Area Median Income by Age of Householder
Age can make a significant difference when comparing financial resources. Some who have been in the
workforce for a number of years will earn more than those who are just starting out; retirement-aged residents
tend to earn less than those that are active in the workforce, as these populations are likely living on a fixed
income of social security or retirement savings.
Important to keep in mind is the share of the population in each age bracket, and how this will change in
upcoming years. According to the U.S. Department of Housing and Urban Development, by 2050 the
population of individuals who are 65 and older in the United States is projected to double, growing faster than
any other age group.
Chart 10. Median household income by age
Householder Aged 15-24 The majority of households in Marquette
County are headed by someone aged 45 to 64
Householder Aged 25-44
(see chart 10); these households also earn the
Householder Aged 45-64
most of all age groups.
Householder Aged 65+
There are a nearly equivalent number of
$0 $20,000 $40,000 $60,000
households that are aged 65+ as those
between the ages of 25 and 44. Earnings are
Chart 11. Number of households by age group
Householder Aged 15-24 quite different between these two groups,
Householder
ouseholder Aged Aged 65+
65 and older --Householder Aged 15-24
7%
--
however, with retirees earning approximately
7,200 households
27% 1,900 households $18,000 less than the younger cohort. This is
Householder Aged 25-44
an important statistic to keep in mind when
27%
----Householder considering providing housing amenities and
Aged 25-44 the associated costs for elderly populations.
Householder Aged 45-64 7,000
Householders aged 15 to 24 or older
10,000 households households
Householder Aged 45-64 comprise 7 percent of the total households in
39% the county and are the lowest income earners.
ACS-5 year estimates. 2017. S1903, S2301. Marquette County
Age and Housing
Today, one in four households is headed by someone of retirement age in Marquette
County. The largest age group in the county is nearing retirement, those aged 45-64.
It is common for elderly populations to require a smaller home, less maintenance, ground-level or
elevator accessible units, transportation services, nursing homes, assisted living and/or in-home
care.
To assist these populations, housing should be ADA accessible, can be linked with healthcare, and
amenities should be matched to meet resident needs.
p. 14EXISTING CONDITIONS REPORT DECEMBER 2020
02 - SOCIOECONOMICS
Area Median Income by Sex
Area median incomes may also vary by sex, with women earning less than their male counterparts. There are a
few factors contributing to this, such as the types of jobs prevalent in a community, workforce policies that fail
to address the gender wage gap and/or support women with children, and familial roles that trend toward
women staying home for some duration of time to care for children.
On average, women earn approximately
63 cents to every dollar a man earns in
Marquette County. This is much lower than
the national and statewide average of 80 and
77 cents, respectively.
The wage disparity between males and
females can exist for several reasons,
including discriminatory practices and gender
Chart 12. Median earnings by sex
roles within a family: gender biases can occur
Median earnings: in hiring and pay decisions, there may be a
full-time, year-round $51,391 difference in performance bonuses between
employed males women and men, and women are more likely
to have to balance their careers with home
duties, resulting in mothers taking more time
Median earnings:
full-time, year-round off work for family-related reasons. Strategies
$32,536 to increase female earnings in the county will
employed females
help to raise household incomes more broadly
0 20,000 40,000 60,000 and make the region more attractive for
ACS-5 year estimates. 2017. S2414. Marquette County, Michigan & employment.
United States.
Addressing the Wage Gap
Single family households headed by women earn the engage in higher wage (traditionally male-
least across all family types, making these households dominated) industries;
the most susceptible to suffering financial burdens from diversifying the economic base to provide
housing costs. When housing costs are high, one must additional opportunities;
choose between spending their limited incomes on enhancing growth in sectors of which women
housing versus other necessities. Spillover impacts of might more often be employed;
this scenario are broad, ranging from childhood hunger offering flexible, "family friendly" work schedules
and learning and behavioral challenges to family that allow employees to balance household
displacement and homelessness. duties with employment;
supporting families during childbirth with paid
Strategies to increase women's earnings might include: maternity leave;
offering opportunities for remote work options.
Removing barriers and/or supporting women to
p. 15EXISTING CONDITIONS REPORT DECEMBER 2020
02 - SOCIOECONOMICS
Per Capita Income by Race
Incomes can vary by race and ethnicity in the U.S. While education is widely viewed as the key to upward
mobility for all races, a 2016 analysis from the Pew Research Center found that the benefits of schooling do
not manifest in equal upward mobility. For example, among those with a bachelor’s degree, Black or African
American people earn significantly less than whites ($82,300 for Black householders vs. $106,600 for whites).
In fact, the study found that the income of Black or African American people at all levels of educational
attainment lags behind that of their white counterparts. Despite decades of understanding that racial
disparities exist, the wealth gap continues to widen among racial groups.
Chart 13. Per capita earnings by race
Total Population
One Race - White
One Race - Black or African American
One Race - American Indian or Alaska Native
One Race - Asian
One Race - Native Hawaiian and Other Pacific Islander
One Race - Some other race
Total Population - Two or more races
Hispanic or Latino (of any race)
White Alone (not Hispanic or Latino)
$0 $10,000 $20,000 $30,000
The per capita income of Black or African While people of color comprise a small
American, American Indian or Alaska Native, proportion of the population, the per capita
and Hispanic or Latino residents is notably less income differences between these racial
than that of white and Asian residents in groups is stark.
Marquette County.
“On Views of Race and Inequality, Blacks and Whites Are Worlds Apart.” Pew Research Center's Social & Demographic Trends Project, 27
June 2016, www.pewsocialtrends.org/2016/06/27/1-demographic-trends-and-economic-well-being/.
Implications for Home Ownership
Home ownership rates generally rise for all wealth, the white-Black gap in home ownership
Americans who have higher incomes and more is also widening somewhat; in 1976, the home
education, but the differences between home ownership rate among Blacks was 44 percent
ownership rates for Black and white vs. 69 percent for whites. The same is true
households persist. As of 2016 in the U.S., 72 despite educational attainment – 58 percent of
percent of white householders own their own Black householders with a college degree own
home, compared with 43 percent of Black their home, compared with 76 percent of
householders. As is the case with household Whites.
p. 16EXISTING CONDITIONS REPORT DECEMBER 2020
02 - SOCIOECONOMICS
Area Median Income & Housing Affordability
The Area Median Income (AMI) is the midpoint of a region’s income distribution – half of families in a region
earn more than the median and half earn less.
>> For housing policy, income thresholds set relative to the area median income—such as 50% of
the area median income—identify households eligible to live in income-restricted housing units
and the affordability of housing units to low-income households.
The U.S. Department of Housing and Urban Chart 14. Distribution of Median Household Incomes of
Development (HUD) calculates different levels of Families and Non-Families, as Percentage of Total
AMI by household size. Households
For Marquette County, with an area median family 40
income of $62,900 in 2018, HUD defines housing
affordability assistance thresholds for various 30
household sizes as:
1 person: $35,250 or less 20
2 people: $40,250 or less
3 people: $45,300 or less
10
4 people: $50,300 or less
Those living below the income listed above could 0
qualify for federal housing assistance programs.
00 $1 0
00 $2 9
99
0, to $ 99
$1 ,00 $74 9
$1 00 $99 9
$1 99
00 19 9
or 9
e
0
9
9
9
$2 to $ ,99
00 ,99
or
$1 0 t 0,0
$2 0 t 4,9
,9
,9
$7 0 t 9,9
,9
,9
m
4
34
49
9
Approximately 60 percent or 6,400 non-family
00 $1
4
$
n
o
o
o
o
o
households earn less than $34,999 annually, which
$1 tha
$3 0 t
00 0 t
to
,0
0
00
00
00
is roughly the affordability assistance threshold for
ss
0,
5,
5,
5,
,0
,0
5
Le
$5
50
a one person household.
Non-families Families
Forty-six percent or 7,000 familial households earn
less than $49,999, the approximate affordability ACS-5 year estimates. 2017. S1901.
assistance threshold for households up to four
people.
Ensuring housing affordability for all households
Approximately 13,000 households are living at or understand the match between household incomes and
below the HUD threshold for housing affordability the spectrum of housing price points that is available
assistance in Marquette County. Further, 25 percent within the community and, if needed, develop policies to
or 2,800 non-family households and 16 percent or meet the needs of residents.
2,500 family households earn less than $24,999
annually. These metrics indicates a need for housing Further discussion of existing affordable housing
choice amongst the spectrum of incomes, including programs in the county can be found on page 34.
those living on a limited budget. Local leaders should p. 17EXISTING CONDITIONS REPORT DECEMBER 2020
02 - SOCIOECONOMICS
Living Wage
Another affordability indicator is the “living wage calculator," a metric developed by researchers at the
Massachusetts Institute of Technology. The living wage calculator depicts the annual salary or hourly rate that
an individual in a household must earn to support his or herself and their family. The measure accounts for
typical household expenses including housing, food, medical expenses, childcare, and transportation within
the local area. The estimate assumes the sole provider is working full-time (40-hour work week or 2080 hours
per year). Similar to the HUD AMI measure, the living wage differs between household types, as factors such
as household size and the presence of children impact the assumptions that form the “living wage” estimate.
This data is calibrated to Marquette County.
>>The living wage calculator goes beyond measuring how much one earns, depicting how incomes
compare to the local cost of living.
The orange dotted line depicts Chart 15. "Living Wage" Income needs by household type
household types that require incomes that
are above or below Marquette County's
median household income. Households 1 adult $21,923
that are not earning this living wage are 2 adults $36,691
those that would most benefit from social
programs and access to affordable and 1 adult, 1 child $47,548
deeply affordable housing. 1 adult, 2 children $59,051
The income required for 2 adult 1 adult, 3 children $73,486
households with children is less than that
required of 1 adult households with 2 adults, 1 child $44,512
children, as childcare is presumably 2 adults, 2 children $49,732
needed in a 1 adult household. This is
opposite of reality, as married couple 2 adults, 3 children $55,328
families earn substantially more than single Michigan Minimum Wage $20,072
parent homes in Marquette County.
M.Co. Median Household Income $48,491
The state minimum wage, shown in the
$0 $25,000 $50,000 $75,000
gray dotted line, is lower than the area’s
living wage for all household types.
1. Glasmeier, Amy. Massachusetts Institute of Technology. “Living Wage Calculation
for Dickinson County, Michigan” https://livingwage.mit.edu/counties/26043. 2.
ACS-5 year estimates. 2017. S1903. Marquette County
This translates to
$22,000 75% 13 percent of families and
44 percent of non-families
(approximately 2,000
considered baseline for cost of households earn more
families and 4,700 non-
of living needs for one than $23,000 annually.
families) earning less
person in Marquette County
than the lowest "living
wage" threshold.SECTION 3 HOUSING TENURE tenure & occupancy .......................p. 20 tenure over time ............................p. 22 tenure by family type .....................p. 23 HOUSING PRICE INDEX statewide comparisons ..................p. 24 MEDIAN HOME VALUE all housing stock .............................p. 25 owner-occupied & on the market ...p. 26 HOUSING AGE all housing stock .............................p. 27 on the market .................................p. 28 HOUSING BY TYPE all housing stock .............................p. 29 on the market .................................p. 30 MEDIAN RENTS all housing stock & on the market..p. 31 as percentage of income ................p. 32 HOUSING COSTS as percentage of income ................p. 33 AFFORDABLE HOUSING affordable housing services ...........p. 34
EXISTING CONDITIONS REPORT                                                                              DECEMBER 2020

    03 - HOUSING

              Housing Tenure & Occupancy
              In the most basic terms, housing tenure describes two forms of housing occupancy: renters and owners. There
              are degrees of variation within these classifications, from owning a home outright (mortgage-free) to
              mortgaged, renting publicly or privately, subleasing, short term vacation rentals, etc. Housing tenure does not
              define the type of home; for instance, renters may live in single family homes and home owners may live in
              multi-family condominiums.

              >>Housing policy should offer a range of tenure options in order to support the diversity of the
              community. One form of tenure may work for a household at one point in life, but not another.

          Chart 16. Housing occupancy, Marquette County
                                                                                 >> Average home ownership rates: 70%
                  Owner Occupied With Mortgage                                   Home ownership rates in Marquette County
                              10,500 units                                       are typical of what they are nationally and
ortgage             57% of owner-occupied units                                  throughout broader Michigan; approximately
                  40% of total occupied housing stock                            68 percent of occupied homes are owner-
                                                                                 occupied in the United States and 71 percent
                                                                                 in Michigan.

                Owner Occupied Without Mortgage                                  >> Proportion of homeowners living
                              7,900 units                                        mortgage-free: 43%
ortgage
                   43% of owner-occupied units
                                                                                 Approximately 43 percent of homeowners are
                 30% of total occupied housing stock
                                                                                 living free and clear of a mortgage. These
                                                                                 households are likely older residents that have
                                Rentals                                          lived in the same home 20-30 years, or long
                               7,900 units                                       enough to pay off their mortgage. This trend is
ccupied           30% of total occupied housing stock                            seen nationally; 41 percent of homes owned by
                                                                                 Baby Boomers were mortgage-free in 2017.
                                              occupied units                     This could be a population that is eventually
              ---------------------------------------
                                     non-occupied units
                                                                                 looking to downsize in order to lessen the load
                                                                                 of maintaining their home. Units such as
                                Vacant                                           condos and townhouses could be appealing
Vacant                         2,800 units                                       formats for this large group of homeowners.
                        8% of total housing stock
                                                                                 >> Many homes used as secondary
                                                                                 residences, camps, and/or seasonal rental
                                                                                 homes: 17% of total housing stock
                       Seasonal, Recreational                                    Seasonal, recreational & occasional use are not
nal Use                   & Occasional Use                                       occupied year-round nor the primary residence
                              5,700 units                                        of the homeowner. Vacation rentals, such as
                       17% of total housing stock                                those listed on AirBnB or VRBO, would fall in this
                                                                                 category, as would “camps” or cottages.
          0         2,500     5,000       7,500      10,000      12,500
                                                                                                                              p. 20
          ACS-5 year estimates. 2017. S1901, S1903. Marquette County, Michigan & U.S.
EXISTING CONDITIONS REPORT DECEMBER 2020
03 - HOUSING
Housing Tenure & Occupancy, cont.
Same information as previous page; focus on city-level data.
>> High rental rates in Marquette City & While there are approximately 4,000 more
Township (46%), low in Ishpeming & occupied housing units in Marquette than in
Negaunee (25%) Ishpeming & Negaunee, there is a similar
Housing tenure looks drastically different when number of mortgage holders in the two areas
zoomed in to city-level data. Rental units (2,500 in MQT; 2,000 in I&N). This could indicate
comprise almost half of all occupied units in a more approachable home ownership market in
Marquette City & Township, and only a quarter Ishpeming and Negaunee than in Marquette.
of occupied units in Ishpeming & Negaunee.
>> Majority of seasonal homes in county
There are more rental units in Marquette than
rather than city area.
there are owner occupied units with a
mortgage in both areas combined. There are nearly 6,000 units considered seasonal
within Marquette County (see chart x), but less
>> Nearly equivalent units with a mortgage than 500 of them are within the city areas.
in Ishpeming & Negaunee and Marquette.
6,000
Chart 17. Housing occupancy, Marquette City & Township (bottom); Ishpeming & Negaunee (top)
-------------------------------
occupied units non-occupied units
1,200 units
25% of total occupied
housing stock
4,000 2,000 units
57% of owner-
occupied units
Ishpeming 1,500 units
43% of total occupied
43% of owner-occupied
& units
housing stock
Negaunee 32% of total occupied
housing stock
2,000
2,100 units 2,500 units 4,600 unitsEXISTING CONDITIONS REPORT DECEMBER 2020
03 - HOUSING
Housing Tenure Over Time
Many factors may impact housing tenure, such as community demographics, incomes, levels of housing prices,
finance interest rates, down payment requirements, and housing availability.
>>It is important to observe changes in tenure over time, so that policy may adjust as needed to
continue to support a range of tenure options.
The amount of owner-occupied units decreased 2000 (gen x-ers); home ownership rates in 2015
slightly and the amount of renter-occupied for this age group are approximately 7 percent
units increased between 2010 and 2017 (see lower than in previous generations.
chart 18). This recent decline in
Factors (of statistical significance) that are
homeownership could be the start of a
influencing decreased home ownership rates
downward shift and is consistent with
among younger generations:
nationwide trends.
delayed marriage,
Chart 18. Number of owner- and renter-
occupied homes, 2000 - 2017, Marquette County increased racial diversity,
levels of education debt.
20,000
owner-occupied Contrary to popular belief, the report found that
15,000
attitudes toward home ownership have not
10,000 renter-occupied changed among people in this generation --
5,000 broadly speaking, millennials would like to own
their own homes but many are experiencing
0
2000 2010 2012 2017 economic barriers that are preventing them
Declining Home Ownership Among from doing so.
Younger Generations Interestingly, the report also states that
According to a report from the Urban Institute, millennials are opting to live in more expensive,
a research-oriented institution that focuses on metro areas. For millennials not seeking an
economic and social policy, home ownership urban lifestyle, the lower cost of living and
for the millennial-aged population (people born affordable housing prices may help boost home
between 1981 and 1997) in particular has ownership rates for younger people choosing to
decreased when compared to previous put down roots in Marquette County.
generations. The report cites census data that Retaining this population is critical to the future
looks at home ownership rates for people aged of Marquette County and its workforce. It is less
25-37 in 2015 (millennials today) compared to likely that employers can attract outsiders than
those same rates in 1990 (baby boomers) and keep or bring back those who have left. It is
imperative to make an effort to understand
Data Source: ACS 5-year Estimates. DP04. 2017 & 2012.
Census 10-year Estimates. H004. 2010 & 2000. Marquette these housing challenges before this population
County. Choi, Jung Hyun, et al. “The State of Millennial is lost.
Homeownership.” Urban Institute, 18 July 2018,
www.urban.org/urban-wire/state-millennial-homeownership.
p. 22EXISTING CONDITIONS REPORT DECEMBER 2020
03 - HOUSING
Housing Tenure by Family Type
Housing tenure by family type provides information about the number and type of households that rent
versus own their homes. This provides insights into specific needs such as housing size and amenities, and
when paired with zoning and location data, can provide information as to the need for public services such as
schools, healthcare facilities, and parks.
In the City & Township of Marquette, there is a higher likelihood of owner-occupied housing units having
children than that of renter-occupied units, which points to the impact of the university on the rental housing
market. Approximately 400 of the 3,500 rental units house children in these communities. College-aged
renters are often younger and likely to cohabitate with unrelated roommates. >>Affordability likely plays a
critical factor in housing decision-making for this demographic, and will impact their ability to
stay and work within the community post-graduation.
Chart 19. Proportion of households with or without children by tenure, Marquette City & Township
6 out of 7 renters in Children 1 in 4
Marquette do not have 12% homeowners in
Children
children living at home. >> Marquette have
24%
children living
with them. >>
Home
Renters
Owners
No Children
No Children 76%
88%
In Ishpeming & Negaunee, approximately 1,000 of the 3,500 owner-occupied housing units house children.
Approximately 300 of 1,200 rentals have children living in them. >>These numbers suggest again that
homeownership is more attainable for young families in Ishpeming and Negaunee.
Chart 20. Proportion of households with or without children by tenure, Ishpeming & Negaunee
Approximately 25-30 percent of all renters and homeowners live with children in Ishpeming & Negaunee.
Children Children
29% 25%
Home
Renters
Owners
No Children
No Children
71%
75%
p. 23
ACS-5 year estimates. 2017. S1903.Census tracts of Marquette City & Township, Ishpeming & NegauneeEXISTING CONDITIONS REPORT DECEMBER 2020
03 - HOUSING
Comparison of Housing Price Index
The Housing Price Index is derived from the change in the housing price index published by the Federal
Housing Finance Agency. The housing price indexes are calibrated using appraisal values and sales prices for
mortgages bought or guaranteed by Fannie Mae and Freddie Mac and are reported quarterly.
>> The index reflects a change in home values over time.
Since 2000 the increase in housing prices in Chart 21. Percent Change in Housing Price Index by
Marquette County ranks highest of Michigan's County – Purchase Only, 2000 to first quarter 2018
83 counties. (The top 15 counties in the state
for this indicator shown in chart xx.)
Marquette County
According to the Federal Housing Finance
Agency's housing price index, housing prices
have increased at a 3.1 average annual Grand Traverse County
growth rate over this time period. The annual
growth was derived from the change in the Leelanau County
housing price index (2000 = 100) published
by the Federal Housing Finance Agency. Ottawa County
The highest year of growth, 10.35 percent,
Houghton County
was between 2003 and 2004. Reflective of the
U.S. Housing Crisis, housing prices saw slight
declines in the county between 2008 and Kent County
2010.
Mason County
Note that other Upper Peninsula counties -
Dickinson and Alger - have also experienced Alger County
similarly high rates of change in their housing
prices over the same period.
Benzie County
Cass County
Federal Housing Finance Agency. Housing Price Index.
Monthly Report. April 2019.. Michigan. Van Buren County
Allegan County
>> Since 2000 the positive
percent change in housing Washtenaw County
prices in Marquette
Dickinson County
County ranks highest of
Michigan's 83 counties. Kalkaska County
0 50 100 150 200
p. 24EXISTING CONDITIONS REPORT DECEMBER 2020
03 - HOUSING
Median Home Value
The median value in the Census data includes all owner occupied units: single family, townhome, twin home,
and condominium units.
>> The median home value provides a snapshot of housing prices in the county. Comparing home
values with other counties in the state provides context as to whether this price is high or low.
The median price of an owner occupied unit in >> 85 percent increase in median
Marquette County in 2017 was $142,900. The
home values between 2000 and 2017;
county ranked 19th in the state for the median
value of an owner occupied unit in 2017 and has 2x faster than median incomes.
the highest median home price within the six
Recall the median household income has risen by
counties that comprise the central Upper
approximately 36 percent over the same 17 year
Peninsula region (see table x). The median home
time period, indicating that home values and
price is higher in the county than in the state. As
therefore household costs are rising at a faster
seen in chart xx, home sale prices have risen
rate than incomes. This can raise housing
substantially -- from $77,200 to $142,900 --
affordability concerns, especially among younger
between 2000 and 2017.
and older demographics whose incomes are
Table 2. Central U.P. Counties Ranked by Median generally lower than middle aged households.
Sales Price, Statewide, 2017
This rise in value can also present itself as equity
Rank County Median Home Price upon sale of the home, thereby increasing the
buying or renting potential for these potential new
home seekers.
19 Marquette County $142,900
Chart 22. Median Home Values, Marquette County
(Dollars, 2017)
33 Alger County $119,000
$150,000 +13%
+62% +EXISTING CONDITIONS REPORT DECEMBER 2020
03 - HOUSING
Home Values: Owner-Occupied and For Sale
The graphs below show the price distribution of all owner-occupied units within the community as they are
captured by 2017 American Community Survey data, as well as homes that are currently for sale and listed
on realtor.com as of November 2020.
The distribution of home values of owner-occupied homes (not on the market) within the two communities is
depicted in chart xx, while the distribution of homes prices as they are listed on the market in "real time" is
shown in chart xx.
Chart 23. Number of Owner-Occupied Housing Units by Estimated Value
Ishpeming &
Negaunee
1,500 A little more than half the housing stock is valued
below $100,000 in Ishpeming & Negaunee.
1,000 Most homes valued between $100,000 and
$299,999 in Marquette City & Township;
Marquette 40% of housing valued above $200,000.
500
0
Less than $50,000 - $100,000 - $150,000 - $200,000 - $300,000 - $500,000 - More than
0
9
99
99
99
99
e
99
or
00
99
$50,000 $99,999 $149,999 $199,999 $299,999 $499,999 $999,999 $1,000,000
,9
,9
,9
,9
,9
m
0,
9,
49
99
99
99
99
$5
$9
or
$1
$1
$2
$9
$4
an
to
00
to
to
to
to
to
96 percent of homes are
th
,0
0
Chart 24. Number of homes for sale by list price
00
00
00
00
00
00
00
ss
listed for less than $150,000
0,
,0
,0
,0
,0
,0
,0
Le
$5
00
50
00
00
$1
00
in Ishpeming, compared to 55
$1
$1
$2
$5
$3
40
percent in Negaunee and 22
Median List Price
Marquette: $ 389,900
percent in Marquette.
Ishpeming: $ 92,200 60 percent of homes listed in
30 Negaunee: $ 173,950 Marquette are priced over
$300,000; 2 percent of homes
are listed within this range in
20 Ishpeming and 23 percent in
Ishpeming
Negaunee.
Local developers have
10 Negaunee referred to homes priced at
Marquette
$250,000 as "the sweet spot."
18, 2, and 23 percent of
0 homes are listed around this
Less than $50,000 - $100,000 - $150,000 - $200,000 - $300,000 - $500,000 - More than range in Marquette,
0
99
99
99
$50,000 $99,999 $149,999 $199,999 $299,999 $499,999 $999,999 $1,000,000 Ishpeming, and Negaunee,
00
,9
,9
,9
0,
49
99
99
respectively.
$5
$1
$2
$9
an
to
to
to
th
00
00
00
p. 26
ss
,0
,0
,0
Le
http://realtor.com April 1, 2021. Marquette, Ishpeming, Negaunee.
00
00
00
$1
$2
$5EXISTING CONDITIONS REPORT DECEMBER 2020
03 - HOUSING
Age of Housing Stock
The age of housing stock data includes all owner and renter-occupied homes as well as all housing types.
>>The age distribution of housing stock provides a history of home building in the county.
Homes built pre-WWII likely have a
Chart 25. Number of homes by year built smaller footprint and lot size and are
likely located within city limits.
Only 1% of housing built Roughly 40% in
2,500 since the year 2000 in Marquette and 72% in
Ishpeming & Negaunee; Ishpeming & Negaunee
2,000 11% in Marquette. built before 1950 or
pre-WWII era.
-------------------
1,500 Ishpeming &
Negaunee
1,000
Marquette
500
0
7
9
9
9
9
9
9
9
er
01
00
99
98
97
96
95
94
rli
ea
-2
-2
-1
-1
-1
-1
-1
-1
10
00
90
80
70
60
50
40
or
20
20
19
19
19
19
19
19
39
ilt
ilt
ilt
ilt
ilt
ilt
ilt
ilt
19
Bu
Bu
Bu
Bu
Bu
Bu
Bu
Bu
ilt
Bu
Housing preferences shift post-WWII The program also developed design guidelines
that were used for evaluating whether or not the
Housing preferences shifted post-WWII, when mortgage would be insured. The design guidelines
suburban style homes were desirable housing were built upon the morales of the time, and
formats nationwide, and supported by the newly fundamentally reshaped housing and
implemented Federal Housing Authority’s 1934 development patterns in America.
program that provided insurance on private home
mortgages for the first time in American history. New homes with a larger footprint were given a
While lenders had been spooked by the Great higher score, as they would spur demand for labor
Depression which saw a doubling of home and materials. Points were given for the presence
foreclosures, the FHA program required low of garage, thereby incentivizing use of the private
interest rates in exchange for a guaranteed automobile. Consideration was given as to the “fit
payment upon default of a loan, giving lenders within the neighborhood,” which had implications
confidence to provide loans to the average home for the segregation of both race and economic
buyer. The FHA program revolutionized home class. This development pattern was supported by
ownership in America, helping three out of five the rise of private automobile use and
Americans purchase a home by 1959. industrialization, which made it easier to spread
out and cheaper to build.
1. ACS-5 year estimates. 2017. DP04. Census tracts, Marquette County. 2. Zuegel, Devon Marisa. Financing Suburbia: “How government
mortgage policy determined where you live.” Strong Towns. August 16, 2017. 3. ederal Housing Administration Underwriting Manual. 1934.EXISTING CONDITIONS REPORT DECEMBER 2020
03 - HOUSING
Home Values for Sale by Age
The home values for sale by age data was derived by calculating the median value of homes for sale on the
market (collected November 2020) grouped by decade according to the year they were built.
>> Overall, asking home prices tend to decrease by age, revealing that newer homes are valued
slightly more than historic properties in Marquette County. The story is slightly more nuanced
when honing in at the city level.
Chart 26. Median asking sale price by year built
Marquette
$600,000
Negaunee
$400,000
Ishpeming
$200,000
$0
Built 2010- Built 2000 - Built 1990 - Built 1980 - Built 1970 - Built 1960 - Built 1950 - Built 1940 - Built 1939 or
7
9
9
9
9
9
9
9
er
01
00
99
98
97
96
95
94
2020 2009 1999 1989 1979 1969 1959 1949 earlier
rli
-2
-2
-1
-1
-1
-1
-1
-1
ea
10
00
90
80
70
60
50
40
or
20
20
19
19
19
19
19
19
39
Chart 27. Number of homes listed on market by
ilt
ilt
ilt
ilt
ilt
ilt
ilt
ilt
19
Bu
Bu
Bu
Bu
Bu
Bu
Bu
Bu
In Marquette, the median sale price for
ilt
year built
Bu
homes on the market are higher the more
recently they were built, as seen in chart xx. Built 2010-2020 Marquette
Ishpeming
The median list price for homes built within the Negaunee
Built 2000-2009
last five decades (before 1970) is over
$300,000. Approximately a quarter of all Built 1990-1999
properties listed were built between 2000 and
2020, indicating growth and/or redevelopment. Built 1980-1989
The median home price does not vary much
Built 1970-1979
between decades in Ishpeming - median
prices are below $200,000 with the exception Built 1960-1969
of 1940s homes. Given the small number of
Built 1950-1959
homes listed that were built in this decade, this
is likely one home price skewing the data. Built 1940-1949
Median home prices increase with age
Built 1939 or earlier
between 2020 and 1990 in Negaunee, and
then fluctuate only slightly between decades.
0 10 20 30
In all three cities the majority of homes listed
are built pre-1940 (see chart xx). http://realtor.com November 2020. Marquette, Ishpeming,
Negaunee.
p. 28You can also read