Housing Needs Assessment and Unit Mix Analysis for Dublin City and Clonliffe Road
←
→
Page content transcription
If your browser does not render page correctly, please read the page content below
Prepared for:
                                                           CWTC Multi Family ICAV
                                                           acting on behalf of its
                                                           sub fund DBTR DR1 FUND

  Housing Needs Assessment
  and Unit Mix Analysis for Dublin
  City and Clonliffe Road
  Rationale for proposed apartment mix, having regard to, National
  and Local planning policy, the site’s context, including a quantitative
  assessment of composition, occupancy, supply, and affordability
  within the housing market, and the demand for residential
  development in Dublin over the next decade.

April 2021
Housing Needs Assessment
and Unit Mix Analysis for Dublin
City and Clonliffe Road
Rationale for proposed apartment mix, having regard to, National
and Local planning policy, the site’s context, including a quantitative
assessment of composition, occupancy, supply, and affordability
within the housing market, and the demand for residential
development in Dublin over the next decade.
Executive Summary
Section   01

Introduction
Section   02

Policy Context
Section   03

Demographics & Changing Demands
Section   04

The Supply of Housing
Section   05

Future Demand for Housing & Unit Mix
Section   06

Clonliffe Road: A Local Area Assessment
Section   08

Conclusion

HOUSING MARKET ASSESSMENT - DUBLIN CITY & CLONLIFFE ROAD

           /
          EXECUTIVE SUMMARY
          The following report has been prepared by KPMG Future Analytics on behalf of CWTC Multi Family ICAV
          acting on behalf of its sub fund DBTR DR1 FUND to quantify the level of demand for residential
          development across Dublin, with a particular focus on Dublin City, the subject site on Clonliffe Road and
          the proposed development, comprising of 1,614 no. apartment units (540 studios, 602 no. 1 bed units, 419
          no. 2 bed units and 53 no. 3 bed units). The report provides a 10-year outlook, in particular, aiming to
          address the size and composition of the housing market, how it will change over the next 10 years, and
          what the implications are for unit size/mix demand.

          Given the important economic role Dublin City plays in Ireland, and its influence on the wider Eastern and
          Midland Region, following the publication of the National Planning Framework (NPF) and the EMRA
          Regional Spatial and Economic Strategy, this study recognises the need for a high-level strategic
          document to present the compositional changes in households over the past decades and to identify how
          the demand for units is changing, and if the current supply (and pipeline of supply) will meet this demand.

          With the continued high levels of population growth, it is imperative that future urban development occurs
          in a sustainable manner, which makes most efficient use of the limited land available. This will ensure that
          future communities are connected and integrated within Dublin’s urban form and are well placed to avail
          of existing and proposed services and infrastructure. The National Planning Framework recognises the
          inherent dangers in continuing to push development outside pre-existing settlements to greenfield
          locations, acknowledging that “meeting Ireland’s development needs in housing, employment, services
          and amenities on mainly greenfield locations will cost at least twice that of a compact growth-based
          approach”.

          The assessment uses a number of demand models to establish population growth and housing needs into
          the future. Specifically, the recent National Planning Framework and ESRI housing demand outputs have
          been paired with a custom projection from KPMG on population growth and housing requirements to
          quantify unit demand across the county, as well as what the optimal unit mix to accommodate the
          changing demographic profile. Following this, a review of affordability is carried out for the market to
          determine the levels to which households can afford now and how that affordability is likely to change into
          the future.

          It is with this strategic approach in mind that the study has considered how different drivers of
          demographic change has influenced demand over the past decade, and how housing and land-use policy
          can best synergize to sustainably meet demand going forward. The report has sought to utilise the best
          available data on population growth, socio-economic changes, income, market analysis and awareness of
          stock and a range of other inputs to create the outlook.

          Key Findings
          Population growth in Dublin will generate an additional housing demand of over 101,171 units (projected
          by ESRI) 99,062 units (projected by KPMG) by 2030. A strong increase in units completions will be required
          annually to meet demand. This completions pipeline has not been reflected in recent years despite a large
          planning pipeline, with an average of just 4,000 units being completed per annum between 2011-2020 in
          the county.

          The largest demand will be from Dublin City which will have a cumulative need for 42,878 units over the
          next 10 years (4,200 per annum). Unit completion will need to significantly ramp up from current levels to
          meet demand given that a total of just 11,672 units were completed in the period 2011-2020. This demand
          will be predominantly for smaller unit types, with 1- and 2-person households accounting for over 73.3% of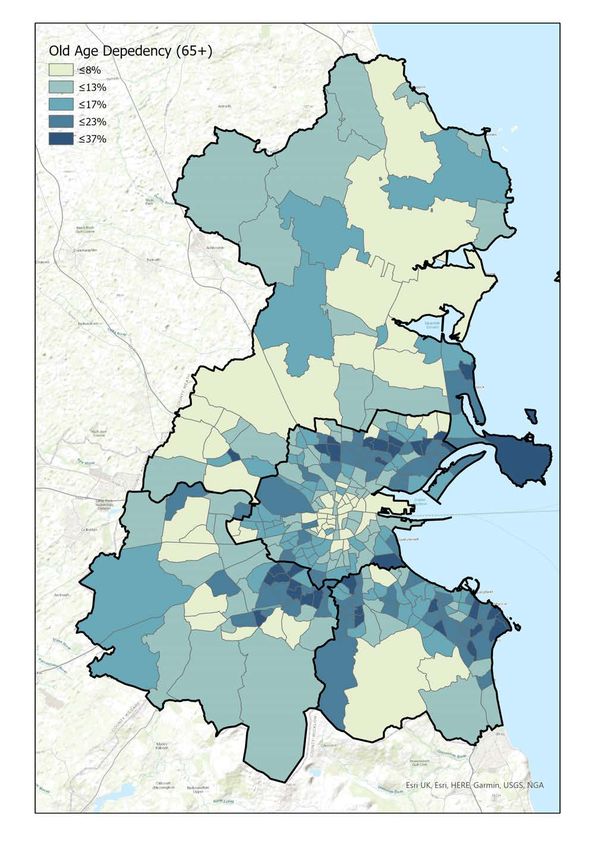
HOUSING MARKET ASSESSMENT - DUBLIN CITY & CLONLIFFE ROAD
unit demand. Moreover, there will be no additional need for units accommodating 5-persons or more by
2030 with the existing unit composition in the market able to account for all future demand. Given the
current relationship between supply, demand, forecast income growth and rent/price growth in the
market, it is likely that the levels of affordability will continue to decrease in the Dublin City market to 2030
until such as time that the demand for housing is met.
The results of this analysis indicate that both the scale of the development and the unit mix at the
proposed site on Clonliffe Road would align with the requirements for Dublin City, greatly assist in
meeting the substantial shortfall that exists in the wider market, and be an optimal use for the
subject site given its strategic location in the city.
Population Growth in Dublin
1,55m 2,000,000
1,48m 1,53m
1,500,000
Population
1,42m 1,47m
1,000,000
1,40m 500,000
2021 2025 2030
-
2020 2021 2022 2023 2024 2025 2026 2027 2028 2029 2030
+8.3% (117,065 persons) (KPMG)
DCC DLR Fingal SDCC
+10.5% (146,687 persons) (ESRI)
Cumulative Housing Shortfall in Dublin
2020 2021 2022 2023 2024 2025 2026 2027 2028 2029 2030
101k -
63k
99k -20,000
18k -40,000
Units
57k -60,000
15k
2021 2025 2030 -80,000
-100,000
Annual Shortfall of 7,075 units (KPMG)
DCC DLR Fingal SDCC
Annual Shortfall of 7,226 units (ESRI)
Area Units 1 Bed 2 Bed 3 Bed 4 Bed 5 Bed 5 Bed+
Planning Permission Pipeline DCC 22,009 38.7% 49.5% 9.5% 1.1% 0.3% 0.0%
DLR 14,526 22.1% 46.8% 19.5% 9.9% 1.3% 0.0%
+66,160 units in the Dublin Region Fingal 18,111 16.5% 40.9% 25.7% 14.4% 2.1% 0.0%
+22,009 units in Dublin City SDCC 11,514 19.6% 36.6% 33.2% 8.7% 0.1% 0.0%
Dublin Overall 66,160 25.7% 44.3% 20.3% 8.0% 1.0% 0.0%
7,746
9,000
Unit Completions in Dublin
7,024
Dublin City
6,678
8,000
City 2011-2020 7,000
5,348
6,000
4,530
4,285
2011-2020
4,124
4,125
3,777
5,000
3,427
3,370
+11,672 units
3,091
2,804
4,000
2,397
2,362
2,259
1,826
1,818
1,582
3,000
1,040
Per Annum 2,000
914
911
667
+1,167 units
557
507
502
1,000
-
1995 1996 1997 1998 1999 2000 2001 2002 2003 2004 2005 2006 2007 2008 2009 2010 2011 2012 2013 2014 2015 2016 2017 2018 2019 2020
50.0% 46.9%
Unit Demands in Dublin City by 44.0%
2025 2030
2025-2030 (KPMG Model) 40.0%
(Per-person household (pph)) 30.0% 27.0% 26.4%
2021-2025 20.0% 17.7% 18.5%
+24,581 units
Units
9.6% 9.8%
10.0%
1.7%
2021-2030 0.0%
-1.6%
+42,878 units
1 pph 2 pph 3 pph 4 pph 5+ pph
-10.0%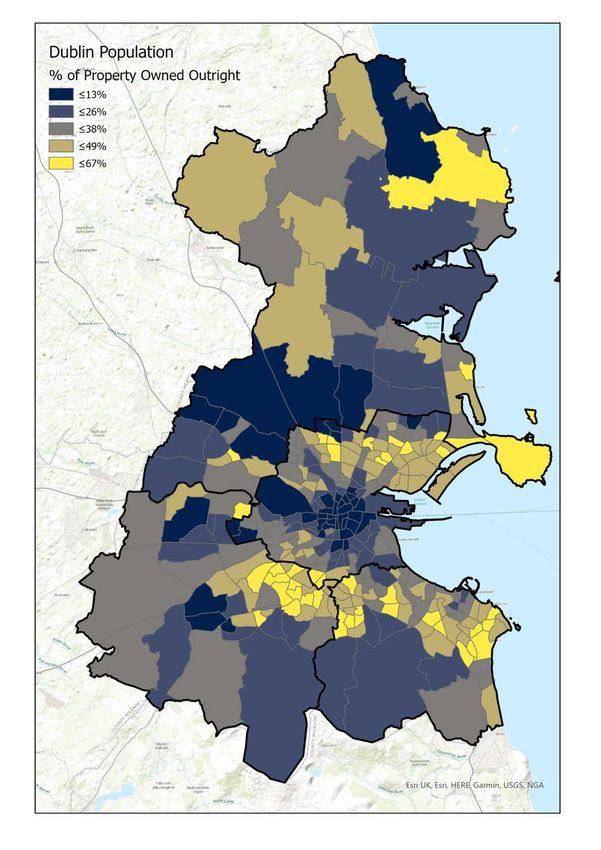
HOUSING MARKET ASSESSMENT - DUBLIN CITY & CLONLIFFE ROAD

           /
          DESCRIPTION OF DEVELOPMENT
          The development will consist of the construction of a Build To Rent residential development set out in 12
          no. blocks, ranging in height from 2 to 18 storeys, to accommodate 1614 no. apartments including a retail
          unit, a café unit, a crèche, and residential tenant amenity spaces. The development will include a single
          level basement under Blocks B2, B3 & C1, a single level basement under Block D2 and a podium level and
          single level basement under Block A1 to accommodate car parking spaces, bicycle parking, storage,
          services and plant areas. To facilitate the proposed development the scheme will involve the demolition of
          a number of existing structures on the site.

          The proposed development sits as part of a wider Site Masterplan for the entire Holy Cross College lands
          which includes a permitted hotel development and future proposed GAA pitches and clubhouse.

          The site contains a number of Protected Structures including The Seminary Building, Holy Cross Chapel,
          South Link Building, The Assembly Hall and The Ambulatory. The application proposes the renovation and
          extension of the Seminary Building to accommodate residential units and the renovation of the existing
          Holy Cross Chapel and Assembly Hall buildings for use as residential tenant amenity. The wider Holy Cross
          College lands also includes Protected Structures including The Red House and the Archbishop’s House (no
          works are proposed to these Structures).

          The residential buildings are arranged around a number of proposed public open spaces and routes
          throughout the site with extensive landscaping and tree planting proposed. Communal amenity spaces
          will be located adjacent to residential buildings and at roof level throughout the scheme. To facilitate the
          proposed development the scheme will involve the removal of some existing trees on the site.

          The site is proposed to be accessed by vehicles, cyclists and pedestrians from a widened entrance on
          Clonliffe Road, at the junction with Jones’s Road and through the opening up of an unused access point
          on Drumcondra Road Lower at the junction with Hollybank Rd. An additional cyclist and pedestrian access
          is proposed through an existing access point on Holy Cross Avenue. Access from the Clonliffe Road
          entrance will also facilitate vehicular access to future proposed GAA pitches and clubhouse to the north of
          the site and to a permitted hotel on Clonliffe Road.

          The proposed application includes all site landscaping works, green roofs, boundary treatments, PV
          panels at roof level, ESB Substations, lighting, servicing and utilities, signage, and associated and ancillary
          works, including site development works above and below ground.
Section 01
INTRODUCTION
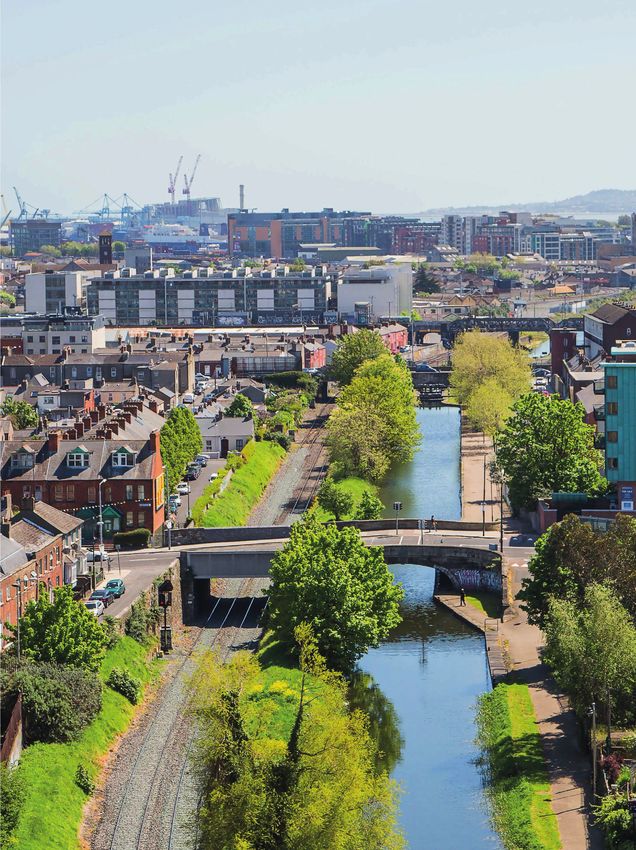
Dublin’s population continues to expand robustly, despite net
outward migration during the economic downturn. In the ten years
to 2016, it grew by 13.5% to 1.35 million. The composition of Dublin
households is also changing rapidly.
Despite the economic recession, Ireland’s population has
grown by +12.3% over the past decade from 4.24m to 4.76m INSIGHTS
in 2016. The population living in urban areas has also Dublin’s population growth has been
increased by +16% from 2.57m to 2.98m. Over the same robust, increasing by 13.5% to nearly 1.35
period, the population of Dublin increased from 1.19 to 1.35 million in the ten years to 2016. Between
million (13.5%); An average population growth rate of 1.3% the last two censuses in 2011 and 2016, the
per annum. Dublin’s population is set to continue expanding population grew by 5.8%.
due to natural growth and net inward migration. In 2020, it is
estimated at over 1.40 million. This recent increase in Dublin was greater
than the state-wide growth of 3.8% during
Alongside the growth in population, there has been a shift in the same period and may be seen as
household occupancy and composition within existing and evidence of the city’s draw as an economic
new households. This situation represents something of a centre, with workers coming to seek out
‘paradigm shift’ as different housing profiles and needs have improved employment opportunities and
developed that were not historically present. The availing of the fall in property prices during
characteristics of households, including their size and the economic downturn.
composition, are closely associated to a wide range of
societal changes that impact demography and preference. Changes to Dublin’s age structure have
The primary driver of this shift is lower fertility rates. The closely aligned with national trends since
fertility rate in Ireland and Dublin has dropped significantly 2002 (Table 1). The 15–24 years of age
over the past 50 years our replacement rate is now below cohort fell by 4% nationally and by 5% in
the rate of two children per woman. Most countries have Dublin. However, while the core working
seen a decline in the fertility rate over the past three age group – 25–44 years – fell by 1%
decades. Today almost no OECD country has a total fertility nationally, it grew by 1% in Dublin.
rate above the population replacement rate of two children
per women. This reduction in fertility has decreased the
Type of Percentage
average size of families and as a consequence, the demand Absolute Change
Change Change
for larger unit sizes. The average household size in Dublin
was 2.73 persons per household in 2016. This is down from Age
State Dublin State Dublin
Group
2.99 in 1996 and 3.94 in 1971.
0-14 179,124 44,761 22% 21%
In line with this pattern, residential stock in Dublin has -65,070 -28,536 -10% -14%
15-24
grown by approximately 14.0% since 2006. The share of
25-44 226,032 88,611 19% 24%
semi-detached houses of total has remained in and around
35% of stock, increasing in absolute terms by 7.8% on 2006 45-64 303,010 68,690 36% 30%
figures by 2016. Apartments were the highest growing
65+ 201,566 51,012 46% 45%
housing type in that same period though, seeing an almost
39% increase on 2006 figures. They are presently just under Total 844,662 224,538 22% 20%
24.9% of the total residential stock share and are reflective
of the new demands of the resident population.HOUSING MARKET ASSESSMENT - DUBLIN CITY & CLONLIFFE ROAD
INSIGHTS
Dublin’s housing stock has grown by
approximately 26% between 2002 and
2016, reaching nearly 480,000
residential units. In 2002, apartments
Occupancy within the housing market also shifted significantly in comprised 16.7% of the stock.
the last number of years, evidenced by the relative growth of the However, the share of apartment's
private rental sector which has more than doubled in size between increased markedly to 24.9% in 2016.
2006 and 2016, with approximately one in five households (24%) in
Dublin now renting their home. The lack of housing supply, In Dublin, property prices have been
affordability constraints, and increase in property prices all increasing since 2012, with the average
combined to see a transition away from the well-established sale price at €514,480 in Dublin in 2020,
owner-occupier market. 76.2% higher than the bottom of the
market.
In addition to fertility, trends in household size are influenced by
trends in: health, longevity and migration; cultural patterns Rents have also gone through a
surrounding intergenerational co-residence, home leaving, considerable period of change since
cohabitation, marriage and divorce, lower mortality; and the mid-2000s and now exceed peak
socioeconomic factors that shape trends in education, employment pre-economic crisis levels. For Dublin,
and housing markets. For example, in 2016 there were 40,271 2020’s average asking market rent has
persons living alone in Dublin over the age of 65, accounting for been €2,023; 102% higher than the
over 1-in-4 (26.8%) of all persons over 65. This rate increases to lowest point in 2012 and 43.5% higher
46.8% for persons over 80 years old. Taken as a whole, these trends than the previous peak in 2008
mean that there is a need to plan for more homes, particularly to (Daft.ie).
meet the accommodation needs of smaller families and single
person households (including older people), both of which are Supply’s failure to meet the
likely to increase in number. requirement or demand for housing is
resulting in an annual accumulation of
In parallel with these social changes, the residential development pent-up, unmet demand and an
sector has not functioned correctly over the past 10 years. In ‘inflation’ in prices. The speed with
Dublin, the completion of just 40,043 units in 10 years between 2011 which supply increases and its
and 2020 (average at 4,004 units per year) was not sufficient to (in)ability to stabilise at or around the
meet the needs of a growing/changing population and created a demand rate will play a vital role in
significant ‘pent-up’ demand for new units in the capital (Figure determining changes in rents.
1.1). Population continued to grow year-on-year from 1.26 million
in 2010 to 1.40 million in 2020 adding 140,000 additional persons in
the Dublin Region over the period.
40,000 1.6
1.37 1.40
1.32 1.35
35,000 1.29 1.4
1.26 1.39
1.20 1.22 1.36
30,000 1.11 1.14 1.15 1.17 1.19 1.30
1.33
1.2
1.07 1.09 1.24 1.27
1.05
19,470
25,000 1.08 1.10 1.12 1.0
18,019
17,725
1.06
16,810
Completions Population (m)
14,394
20,000 0.8
12,623
11,342
10,035
9,605
9,446
9,405
9,325
15,000 0.6
8,957
8,823
5,576
6,857
6,939
6,081
5,288
3,573
1,708
10,000 0.4
2,117
2,240
964
829
584
5,000 0.2
- 0.0
1995 1996 1997 1998 1999 2000 2001 2002 2003 2004 2005 2006 2007 2008 2009 2010 2011 2012 2013 2014 2015 2016 2017 2018 2019 2020
Figure 1.1: Population Growth and Housing Completions 1995 - 2020 (Dublin)HOUSING MARKET ASSESSMENT - DUBLIN CITY & CLONLIFFE ROAD
When housing completions are viewed by local authority area across the Dublin region, Dublin City and
Fingal have the highest concentrations of completions (61.1% of total completions) accounting for 32.6%
(10,685 units) and 28.5% (9,358 units) of completions respectively. This percentage breakdown
year-on-year varies, but broadly follows this same pattern (Figure 1.2). The lowest level of completions has
been in Dun Laoghaire Rathdown with 6,328 units completed since 2010 or approx. 632 units per annum.
100%
90% 22.9% 25.0% 26.5% 26.3%
31.6% 35.5% 32.0% 28.4%
80% 40.7% 39.9% 37.9%
70% 14.5% 13.3%
60% 12.7% 14.0% 17.6% 24.1% 24.0%
17.1% 19.2%
50% 18.1% 22.1%
34.5%
40% 26.8% 48.7% 32.7%
42.2% 22.3% 30.6% 33.2%
30% 24.1% 22.4% 27.8%
20%
10% 25.1% 27.3% 27.3% 21.3%
17.1% 13.5% 15.6% 13.9% 18.7% 16.5% 15.1%
0%
2010 2011 2012 2013 2014 2015 2016 2017 2018 2019 2020
Dún Laoghaire-Rathdown Fingal South Dublin Dublin City
Figure 1.2: Proportion of Housing Completions By Local Authority 2010-2020
This dysfunction within the housing market over the past decade is now impacting on the quality of life
of large sections of society. This is best illustrated by the fact that for the first time since the foundation
of the State, average household size increased in the last census. Many thousands of people can no
longer choose their desired living arrangements and must remain remain living with family or in a house
share for longer than planned in sub-optimal situations or in many cases have no home at all.
The outlook is relatively positive from a housing supply capacity perspective. Granted residential
planning permissions in Dublin total of 66,160 residential units (in schemes of 10+ units). While a
significant quantum of housing units awaits the commencement of construction, there are 18,160 units
currently classified as commenced. This accounts for 27.4% of total extant permissions currently in the
pipeline. Although this is a significant quantum of new units, the level of consent will need to continue at
a similar pace to ensure a constant supply of new units. In the period between 2012 and 2020 in Dublin,
consents for 6,243 units across 109 schemes of 9 units or more elapsed/expired with no unit completion.
Based on available information, it is envisaged that a shortfall in supply will persist in Dublin in the face
of strong, sustainable demand, until such time as unit delivery dramatically increases or population
restructuring occurs.
“ Population growth and a return to economic performance
have increased the need to deliver housing. However, supply
has failed to increase accordingly, exemplified by completions
of just 13,020 units combined for 2019 and 2020 and has led
”
to the further increases in property price and rent.
3Section 02
POLICY CONTEXT
Key national policy documents informing the planning and
development of housing and unit mix in Dublin City are set out in
this section.
This section provides an overview of the key planning and development policy documents that guide the
evolution of housing strategy for each Local Authority. Ultimately, it illustrates the viability of a proposed
housing development and its adherence to, and consistency with, specified planning policy principles and
objectives.
National Planning Framework: Ireland 2040 Our Plan
The National Planning Framework (NPF) is the Government’s high-level strategic plan for shaping the
future growth and development of the country to the year 2040. The core principles that run through the
framework are that of sustainable development and the creation of sustainable high-quality communities.
A key theme and recognised National Strategic Outcome of the NPF is Compact Growth, and it is
recognised that carefully managing the sustainable growth of compact cities, towns and villages will
require the consolidation of development within the footprints of existing urban settlements.
It is clear that the NPF will drive increasing levels of forthcoming population growth and residential
development into urban areas as the most sustainable and resilient locations. The proposed development
aligns with the National Policy Objectives (NPOs) and the broader principles of the NPF, redeveloping an
urban brownfield site with significant potential to secure additional sustainable housing capacity and
employment.
Key NPOs are detailed below and it is firmly considered that the proposed development is consistent with
them and their principles. The scheme is a progressive and proactive proposition to secure additional
population growth and employment opportunities within the existing urban envelope of Dublin, thereby
supporting more sustainable residential densities and land-use intensities (NPOs 1b, 2a, 3a, 3b, 33 and 35).
This supports the bolstering of critical mass to justify the provision of services and at a central location
close to public transport, employment opportunities and a host of services, amenities and facilities.
Importantly, the sustainable use and densification of urban land will have environmental benefits by
protecting undeveloped lands, promoting active and public modes of transport, reducing greenhouse gas
emission and improving air quality (NPOs 52 and 64).
NPO 1b: “Eastern and Midland Region: 490,000-540,000 additional people i.e. a population of
around 2.85 million.“
• NPO 2a: “A target of half (50%) of future population and employment growth will be focused in
the existing five cities and their suburbs.”
• NPO 3a: “Deliver at least 40% of all new homes nationally, within the built-up footprint of
existing settlements.”
• NPO 3b: “Deliver at least half (50%) of all new homes that are targeted in the five Cities and
suburbs of Dublin, Cork, Limerick, Galway and Waterford, within their existing built-up
footprints.”
• NPO 33: “Prioritise the provision of new homes at locations that can support sustainable
development and at an appropriate scale of provision relative to location.”
• NPO 35: “Increase residential density in settlements, through a range of measures including
reductions in vacancy, reuse of existing buildings, infill development schemes, area or
site-based regeneration and increased building heights.”HOUSING MARKET ASSESSMENT - DUBLIN CITY & CLONLIFFE ROAD
• NPO 52: “The planning system will be responsive to our national environmental challenges and
ensure that development occurs within environmental limits, having regard to the requirements
of all relevant environmental legislation and the sustainable management of our natural
capital.”
• NPO 64: “Improve air quality and help prevent people being exposed to unacceptable levels of
pollution in our urban and rural areas through integrated land use and spatial planning that
supports public transport, walking and cycling as more favourable modes of transport to the
private car, the promotion of energy efficient buildings and homes, heating systems with zero
local emissions, green infrastructure planning and innovative design solutions.”
The NPF recognises the inherent dangers in continuing to push development outside pre-existing
settlements to greenfield locations, acknowledging that “meeting Ireland’s development needs in
housing, employment, services and amenities on mainly greenfield locations will cost at least twice that of
a compact growth-based approach” (NPF, p. 28). The NPF strongly encourages infill development as a
sustainable alternative to greenfield development and determines that the ‘extent to which we prioritise
brownfield over greenfield use, encourage the use and reuse of buildings in urban and rural areas, and
reduce sprawl, will all help to increase the efficiency of land use… (NPF, p.118).
The acceleration of the delivery of new housing is imperative in order to combat the current shortage of
affordable housing which is currently distorting Dublin’s housing market. This must be delivered in
sufficient densities in order to make efficient use of available land in urban built up areas and must be
supported by suitable services and public transport.
Eastern and Midland Regional Assembly-Regional Spatial and Economic Strategy
The Regional Spatial and Economic Strategy (RSES) for the Eastern and Midland region was agreed in
May 2019 and came into force in June 2019. It is a high-level strategic plan and investment framework
that seeks to shape the development of the Eastern and Midland region up to 2031 and beyond,
supporting the implementation of the NPF by providing a long-term strategic planning and economic
framework for the development of the regions.
The RSES translates the NPOs of the NPF to key Regional Policy Objectives (RPOs) to inform and guide
the relevant local authorities with respect to the preparation of the City and County Development Plans,
Local Area Plan and other plans and in their assessment of planning applications.
2.1 ‘Growth Strategy’
Regional Policy Objective 3.2: “Local authorities, in their core strategies shall set out measures to achieve
compact urban development targets of at least 50% of all new homes within or contiguous to the built up
area of Dublin city and suburbs and a target of at least 30% for other urban areas.”
The principle of compact growth is a key priority for the EMRA region over the next 10 years. Focusing
development within the existing built-up area of Dublin will need to be a cornerstone for future housing
strategy at a local authority level. The subject site at Clonliffe Road provides opportunity to follow this
principle at a location that is accessible, with ample amenities, economic activity and well served on
public transportation routes.HOUSING MARKET ASSESSMENT - DUBLIN CITY & CLONLIFFE ROAD
2.2 ‘People and Place’
Regional Policy Objective 4.3: “Support the consolidation and re-intensification of infill/brownfield sites to
provide high density and people intensive uses within the existing built up area of Dublin city and suburbs
and ensure that the development of future development areas is co-ordinated with the delivery of key water
infrastructure and public transport projects.”
The proposed development, comprising of 1,614 no. apartment units (540 studios, 602 no. 1 bed units,
419 no. 2 bed units and 53 no. 3 bed units) at Clonliffe Road will serve to increase the density of housing
in an area within walking distance of Dublin City urban core. Higher density infill developments on good
public transport links next to significant employment opportunities would make better use of existing
infrastructure and provide housing to a market with chronic undersupply.
2.3 ‘Dublin Metropolitan Area Strategic Plan (MASP)’
Regional Policy Objective 5.5: “Future residential development supporting the right housing and tenure mix
within the Dublin Metropolitan Area shall follow a clear sequential approach, with a primary focus on the
consolidation of Dublin and suburbs, and the development of Key Metropolitan Towns, as set out in the
Metropolitan Area Strategic Plan (MASP) and in line with the overall Settlement Strategy for the RSES.
Identification of suitable residential development sites shall be supported by a quality site selection process
that addresses environmental concerns.”
The proposed development follows the logical sequential approach set out by RPO 5.5, seeking the
redevelopment of the underutilised subject site within Dublin’s existing built-up area, which is within
reach of employment opportunities, services and public transport.
2.4 ‘Connectivity’
Regional Policy Objective 8.1: “The integration of transport and land use planning in the Region shall be
consistent with the guiding principles expressed in the transport strategy of the RSES.”
The proposed development seeks to achieve a sustainable and appropriate mix of uses, residential
density and land-use intensity at the subject site, within walking distance of neighbourhood services, the
Royal Canal and Drumcondra train station stops and several bus stops.
2.5 ‘Quality of Life’
Regional Policy Objective 9.4: “Design standards for new apartment developments should encourage a
wider demographic profile which actively includes families and an ageing population.”
The proposed development has been designed to cater for individuals and households from varying
demographic and socio-economic backgrounds. The inclusion of the Part V social housing units within the
scheme will add diversity to the tenure type and social background. The mix of units (studio, 1-beds,
2-beds and 3-beds) will cater to individuals and families of various demographic backgrounds and stages
of the life cycle.HOUSING MARKET ASSESSMENT - DUBLIN CITY & CLONLIFFE ROAD
Guidelines for Planning Authorities on Sustainable Urban Housing: Design
Standards for New Apartments
The Sustainable Urban Housing: Design Standards for New Apartments Guidelines for Planning Authorities
(Apartment Design Guidelines) were published in December 2020 as an update to the Guidelines issued by
the Department in 2007 and 2015. The Guidelines aim to: (1) uphold proper standards for apartment design
to meet the accommodation needs of various household types and sizes, (2) reduce construction costs and
increase development viability, (3) increase housing supply, (4) improve affordability for buyers and (5)
improve sustainability and resilience.
Specific Planning Policy Requirement 1: “Apartment developments may include up to 50% one-bedroom or
studio type units (with no more than 20-25% of the total proposed development as studios) and there shall be
no minimum requirement for apartments with three or more bedrooms. Statutory development plans may
specify a mix for apartment and other housing developments, but only further to an evidence-based Housing
Need and Demand Assessment (HNDA), that has been agreed on an area, county, city or metropolitan area
basis and incorporated into the relevant development plan(s).”
A breakdown of the proposed development, comprising of 1,614 no. apartment units (540 studios, 602 no.
1 bed units, 419 no. 2 bed units and 53 no. 3 bed units) at Clonliffe Road is stated in Table 2.1. SPPR 8(i)
provides flexibility to provide a greater number of 1-bed units noting that, “no restrictions on dwelling mix
and all other requirements of these Guidelines shall apply, unless specified otherwise.” for proposals that
qualify as BTR developments.
Unit Type No. Units Percentage
Figure 2.1 Proposed residential unit mix
Studio 540 33.5%
at subject site
1 Bed 602 37.3%
2 Bed 419 26.0%
3 Bed 53 3.3%
Total 1614 100.0%
A detailed HNDA was prepared by KPMG as part of this study to identify housing need across the county
over the next decade. The outputs of this HNDA are discussed in Section 5 of the report, but indicate that
Dublin City has a significant need for new unit completions over the next 10 years. Moreover, that the
demand in Dublin City will be predominantly in the 1 and 2 person household types, representing over 73%
of total demand. The composition and density of this scheme fits with the projected housing needs for the
city up to 2030.
Dublin City Development Plan 2016–2022
The following sections details the relevant policies and objectives relating to the proposed development
specified by An Bord Pleanala. These policies and objectives are outlined below and are responded to as
necessary.
Sustainable Communities and Neighbourhoods
Policy SN1: “To promote good urban neighbourhoods throughout the city which are well designed, safe and
suitable for a variety of age groups and tenures, which are robust, adaptable, well served by local facilities
and public transport, and which contribute to the structure and identity of the city, consistent with standards
set out in this plan.”HOUSING MARKET ASSESSMENT - DUBLIN CITY & CLONLIFFE ROAD
The proposed scheme promotes the creation of a new urban development, the design and layout of
which is safe and suitable for a variety of age groups, family units and incomes. The proposed
development includes 1,614 no. units on-site with external and internal communal area and support
facilities to meet their needs and enhance residential amenity. The proposed development is located in a
well-established public transport corridor that is defined by the Drumcondra train station and Dublin Bus
stops on Drumcondra Road Lower. The provision of this development will contribute to the structure and
identity of the surrounding area by bringing an underutilised area back into beneficial use. The proposed
development is consistent with national and local development management standards.
Policy QH6: “To encourage and foster the creation of attractive mixed-use sustainable neighbourhoods
which contain a variety of housing types and tenures with supporting community facilities, public realm
and residential amenities, and which are socially mixed in order to achieve a socially inclusive city.”
The proposed development is consistent with national development management standards for new
residential developments contained in the Delivering Homes Sustaining Communities – Statement on
Housing Policy, Sustainable Urban Housing: Design Standards for New Apartments, and Sustainable
Residential Development in Urban Areas and the accompanying Urban Design Manual: A Best Practice
Guide.
Consistent with the core strategy for Dublin City, the proposed development provides for the
regeneration of an underutilised site to provide for a suitable and sustainable residential density of
development at a site which enjoys close proximity to existing public transport infrastructure services
and community services. The proposed development, by building at higher densities, making more
efficient use of land and energy resources, will serve to consolidate urban form and foster the
development of compact neighbourhoods at a critical mass which contributes to the viability of
economic, social, and transport infrastructure. Varied housing typologies have been applied for in order
to encourage a more diverse choice of housing options in terms of tenure, unit size, and building design
in the local area. The proposed development provides a combination of studio and 1-, 2- and 3-bed
apartment units to cater for the needs of a variety of homeowners and households, both now and in the
future.
The development will provide apartment units of different types and sizes, thereby catering for
individuals and families of different sizes, stage in life and incomes. The inclusion of the Part V social
housing on-site will support the mix in tenures and household incomes.Section 03
DEMOGRAPHICS AND CHANGING DEMANDS
The population of Dublin grew by 27.3% between 1996-2016. The
pattern of growth varied significantly between Local Authority areas,
with highest proportional growth occurring in Fingal.
Ireland experienced a population increase of +12.3% over the past decade from 4,239,848 in 2006 to 4,761,865
in 2016. Population living in urban areas has increased by +16% from 2,574,313 to 2,985,781. Over the same
period the population of Dublin increased from 1.18 to 1.27 million between 2006 and 2011 (7.2%), and a
further 5.8% growth from 1.27 to 1.34 from 2011 to 2016. A summary of this growth can be seen in Figure 3.1
below. Dublin City in 2016 accounted for 41.5% of the total population in the county with 554,554 residents,
with the remaining 58.5% roughly split evenly across the other local authority areas. Growth over the past 20
years has not occurred proportionally, and Fingal and South Dublin county council areas have experienced
higher growth rates at 76.5% and 27.4% respectively.
Changes to Dublin’s age structure have closely aligned with the national trend since 2002. The 15–24 years of
age cohort fell by 4% nationally and by 5% in Dublin. However, while the core working age group (25–44
years) fell by 1% nationally, it grew by 1% in Dublin. Ireland has the youngest population in Europe with a
third of the population under 25 years old and almost half the population under the age of 34. 282,300
persons in Dublin were aged between 15-29 (21% of total) in 2016.
While the overall population is still very young, one of the most notable features of Ireland’s changing
demographics is the pace at which the population is ageing, particularly the rate of growth in the older age
cohorts. Age dependency is defined as people outside of the typical working age categories (i.e. 0-14, 65
years+). Data released from the Census 2016 indicates that Ireland’s population of older people (defined here
as those being 65+) is now 637,567. This is an increase of 36% over the past decade. Older people now
account for 13% of the national population (up from 11% in 2006).
The CSO’s Population and Labour Force Projections 2016 – 2046 estimate the likely changes to population
and this trend over the next two decades. It is projected that the population within the 65+ age cohorts will
increase by 223,033 (or 35%) to 860,600 persons over the next 10 years. This will see the age dependency rate
rise again from 13% to 16% of the total population.
% of
Popula�on Popula�on Popula�on Popula�on Popula�on
Popula�on Popula�on Popula�on Popula�on Popula�on Dublin
Area Change 96- Change 96- Change 02- Change 06- Change 11-
1996 2002 2006 2011 2016 Popula�on
2016 02 06 11 16
in LA
Dublin City 481,854 495,781 506,211 527,612 554,554 15.1% 2.9% 2.1% 4.2% 5.1% 41.2%
Dún Laoghaire-Rathdown 189,999 191,792 194,038 206,261 218,018 14.7% 0.9% 1.2% 6.3% 5.7% 16.2%
Fingal 167,683 196,413 239,992 273,991 296,020 76.5% 17.1% 22.2% 14.2% 8.0% 22.0%
South Dublin 218,728 238,835 246,935 265,205 278,767 27.4% 9.2% 3.4% 7.4% 5.1% 20.7%
Dublin (All LAs) 1,058,264 1,122,821 1,187,176 1,273,069 1,347,359 27.3% 6.1% 5.7% 7.2% 5.8% -
Figure 3.1: Population Growth in Dublin (By Local Authority), 1996-2016
Dublin’s population reached 1.35 million at the time of the census in 2016 and it is expected to continue
growing robustly to 1.55 million by 2030. The rate of growth (Figure 3.2) which is based on the National
Planning Framework projections for population in the Dublin region, will generate an ever-increasing housing
requirement, which will not likely be sufficiently catered for based on current planning consents.HOUSING MARKET ASSESSMENT - DUBLIN CITY & CLONLIFFE ROAD
Population in Dublin City will surpass 600,000 in 2024 and reach 637,446 by 2030, an increase of +60,374
persons in the next 10 years. The remaining Local Authorities in Dublin are projected to experience similar
levels of growth with an average growth rate of 9.4% up to 2030.
Area 2020 2021 2022 2023 2024 2025 2026 2027 2028 2029 2030
Dublin City 577,071 582,842 588,670 594,557 600,503 606,508 612,573 618,698 624,885 631,134 637,446
Dún Laoghaire-Rathdown 226,870 229,139 231,431 233,745 236,082 238,443 240,828 243,236 245,668 248,125 250,606
Fingal 308,040 311,120 314,231 317,374 320,547 323,753 326,990 330,260 333,563 336,898 340,267
South Dublin 290,086 292,987 295,917 298,876 301,865 304,883 307,932 311,012 314,122 317,263 320,435
Dublin (All LAs) 1,402,067 1,416,088 1,430,249 1,444,551 1,458,997 1,473,587 1,488,323 1,503,206 1,518,238 1,533,420 1,548,754
Figure 3.2 Future Population Growth in Dublin (By Local Authority), 2020-2030
The fertility rate in Ireland, measuring the average number of children per female, is lower amongst the
current cohort than it has been in previous generations. This implies families are, on average, smaller
households than they have been in the past and also that there are more households without children. In
Dublin, the proportion of 4-and 5-person households is reducing, while 1-and 2-person households are
becoming the norm. The Dublin City local authority area is home to the largest cohort of 1 and 2-person
households. Dublin City also retains the largest cohort of 3-person households, mostly due to its existing
suburbs - inter-mixed with newer constructed housing types. The surrounding local authorities are home to a
large mix of 3, 4 and 5+ person households, though each has a sizable cohort of 1 and 2-person households as
well. Much of the housing in Dún Laoghaire-Rathdown, is being occupied by 1, 2 and 3-person households.
With family households likely to be smaller than in the past, there is a valid contention that such households
are likely to demand smaller dwellings.
Coupled with changing fertility rates, Ireland is experiencing many of the social changes that are identical to
that happening globally in developed western economies. These changing demands are having a significant
impact on housing demand, occupancy and unit preference, and are magnified in major metropolitan areas,
such as Dublin. The key trends are:
- Higher proportions of people living alone
- Reduced rates of marriage and higher divorce rates
- An aging population in a developed economy where life expectancy is increasing
- Cities having much higher concentrations of young professionals
- Delayed household formation and less children
- Increased social mobility (higher income, educational attainment)
Tenure preference has also shifted significantly in the last number of years. The private rented sector has
more than doubled in size between 2006 and 2016, with approximately one in five households (24%) now
renting their home in the private rented sector in Dublin. Increasingly the sector is providing housing for a
wide range of households, including; those who have postponed house purchase due to a variety of reasons;
and others who have lost their homes during the recession; and students, and individuals and households
who choose to rent by choice. The sector also provides homes for those whose rents are paid for by the State
through the Rent Supplement and Rental Accommodation schemes. The latest data from the social
housing waitlist for Dublin City also confirms that this demand will be largely for 1 bed units with
55.4% (9,154 applications) of the current RAS demand (August 2020) for 1-person households.Fastest
Historic Per
Popula�on Popula�on Growth 1996-Annum
Looking at historic growth at # Electoral Division LA 1996 2016 2016 Growth
a sub-county level, the 1 Airport Fingal 308 5,018 1529% 76.5%
principal areas where 2 Dubber Fingal 577 7,372 1178% 58.9%
3 The Ward Fingal 806 9,602 1091% 54.6%
population gain has been
4 Balgriffin Fingal 603 3,113 416% 20.8%
highest have been around 5 Cabinteely-Loughlinstown DLR 880 4,280 386% 19.3%
Dublin Airport, 6 Balbriggan Rural Fingal 3,454 16,495 378% 18.9%
Blanchardstown, Stepaside, 7 Ushers A Dublin City 845 3,930 365% 18.3%
8 Lucan-Esker South Dublin 7,451 32,236 333% 16.6%
and many parts of Dublin City
9 Lucan North Fingal 340 1,436 322% 16.1%
centre. These top 25 areas 10 Blanchardstown-Abbotstown Fingal 1,531 6,195 305% 15.2%
account for 163,341 11 Blanchardstown-Mulhuddart Fingal 1,245 4,123 231% 11.6%
additional persons since 1996 12 Saggart South Dublin 1,408 4,640 230% 11.5%
13 Swords-Lissenhall Fingal 3,222 10,447 224% 11.2%
and amount to 56.5% of total
14 Kinsaley Fingal 3,282 9,621 193% 9.7%
growth in the county over the 15 Ballymun A Dublin City 1,766 4,765 170% 8.5%
period. 54.8% of this growth 16 Lusk Fingal 3,740 9,623 157% 7.9%
has occurred in Fingal, 23.6% 17 Blanchardstown-Blakestown Fingal 15,131 38,894 157% 7.9%
18 Glencullen DLR 8,063 19,773 145% 7.3%
in South Dublin, and the
19 Tallaght-Jobstown South Dublin 7,294 17,824 144% 7.2%
remainder in DLR and Dublin 20 Rotunda A Dublin City 2,522 5,965 137% 6.8%
City. The spatial distribution 21 North City Dublin City 2,391 5,654 136% 6.8%
of this growth pattern from 22 Arran Quay C Dublin City 1,914 4,471 134% 6.7%
23 Cherry Orchard A Dublin City 1,398 3,254 133% 6.6%
1996 to 2016 is visualised
24 Grange B Dublin City 2,329 5,326 129% 6.4%
below by Electoral Division. 25 Blanchardstown-Tyrrelstown Fingal 1,473 3,257 121% 6.1%
Figure 3.3 Top 25 Popula�on Growth areas in Dublin (By Local Authority), 1996-2016
Legend
Population Change 1996-2016
≤0%
≤25%
≤50%
≤100%
≤1529%
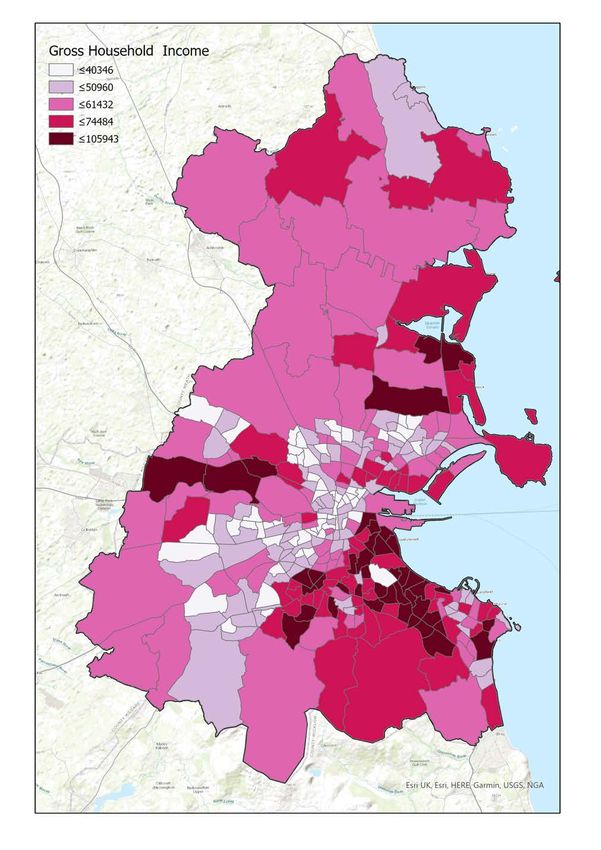
Site LocationThe Electoral Division maps below provide further breakdown of selected socio-economic variables looking at
income distribution, age dependency, owner-occupancy, household type. For example, the Dublin City area
has higher than average income than the Dublin Region or Nationally, a comparatively lower average age, and
a very low proportion of elderly, retired or empty nest household types. Renting is the dominant tenure with
low levels of owner-occupancy existing across the city centre.
Figure 3.4 Key demographic variables for Dublin (By Electoral Division), 2016CHANGING TRENDS IN PROPERTY
Over the past few decades there has been marked changes in the size, composition and occupancy
of households in Dublin. These changes are partly because of social trends, the nature of highly
developed countries, and our demographic composition
New House Types
The proportion of all existing housing types has shrunk over the past 10 years in Dublin with the
exception of apartment units. The proportion of apartments has increased by 39.0% over this period.
Dublin City
2016 23.1% 35.2% 3 4 .3 %
2006
24.0% 36.9% 2 8 .4 %
Dublin Suburbs*
2016 16.7% 44.1% 20.2% 1 7 .5 %
2006 17.6% 47.6% 20.7% 1 1 .4 %
D etached house Semi- d etached house Terraced house Flat or apartment Other/Not Stated
Dublin City Dublin Suburbs
Household Size
The shift in demand for unit types
2.99 2.73 2.73
has been as a result of a shrinking
3.94 3.59 2.67 2.50 2.48
average household size and larger 3.31 2.92 2.92
increases in smaller per person
households (ph) over the period.
In 2016, the average household size 1971 1981 1996 2006 2016
in Dublin was 2.73 persons per
household. This is down from 2.99
in 1996 and 3.94 in 1971.
1 Person 2 Person 3 Person 4 Person 5+ Person
Households Households Households Households Households
Dublin City is home to the largest
cohort of 1 and 2-ph. In 2016, the
combined 1 and 2 ph accounts for
22.0% 15.3% 13.4% 14.7%
15.5%
60.3% of all households.
17.7% 20.9%
Dublin Suburbs are home to a large 23.9%
26.2%
30.4%
mix of 3, 4 and 5+ ph, though the
largest growth has been in 1 and Dublin City
1996 Dublin Suburbs 2016
2-ph (2 ph have grown by 6.1%
since 1996). While 3 ph has also 1 Person 2 Person 3 Person 4 Person 5+ Person
seen growth over the past 20 years, Households Households Households Households Households
both 4 and 5+ ph have shrunk.
Both the city and suburban areas 18.1% 28.1% 17.1% 13.2% 9.4%
have seen significant contraction in
household of sizes 5 persons and
15.0%
over since 1996. 28.3%
19.1% 19.7%
32.0%
*Dublin Suburbs referring to the combined administrative areas of Fingal, South Dublin, and Dun Laoghaire Rathdown.Housing Occupancy Housing Composition
The housing market has also shifted significantly, The proportion of adults living alone in Dublin has
evidenced by the relative growth of the private increased to 23.9% between 1996 and 2016. Dublin
rental sector, the lack of housing supply, all City consistently ranks highest, due to its highly
combined with a shifting household composition
stemming from shifting socio-economic norms accommodation suited to the needs of a one
and demographic change. person household.
Dublin City Dublin Suburbs
The private rented sector has more than doubled
100%
in size between 2006 and 2016, with
5.9%
approximately one in five households (24%) in 8.2%
11.8%
Dublin now renting their home. 15.9%
90%
Dublin City
80%
Owned
Owned -7.6% 30.4% 23.7%
41.0%
70%
Private Rented +9.7% 57% 51.3%
Social Rented -7.2% 50%
60%
2006 2016 60.4%
57.9%
20%
20%
13%
30% 50% 14.7% 20.2%
50.8%
Private Rented Social Rented
42.8% 20.4%
40%
12.8%
11.9% 15.6%
Dublin Suburbs
1 or 2 person households
Greater requirement for
30%
Owned
12.3%
79%
Owned -10.6% 20%
11.7%
Private Rented +9.6% 68%
Social Rented -2.9% 30.4%
28.3%
10%
18.1%
2006 2016 15.5%
10% 11%
19% 9%
0%
1 99 6 2 01 6 1 99 6 2 01 6
Private Rented Social Rented Living Alone Single Parent
C ouple without C hildren C ouple with Children Other
+4.4%
2006
Marriage, Civil Partnerships and Divorce 2016
474,065
The rate of marriage and civil partnerships in Dublin has been decreasing over the
past two decades. While there has been an increase in total numbers the growth
has diminished. 400,035 +21.8%
61,299
Divorce was legalised in Ireland in 1996. In 2006, the rate of divorce and
50,321
separation in Dublin was 42.4 per 1,000 population. This figure increased to 45.5
per 1,000 population in 2016 which constitutes a 21.8% increase in the number of Marriage Divorce
persons divorced or separated in Dublin.Section 04
THE SUPPLY OF HOUSING
A persistent under-supply of housing over the past 10 years since
the economic recession has created significant unmet demand for
new accommodation in Dublin.
Historic Supply
Residential stock in Dublin has grown by approximately 26% since 2002. The share of semi-detached
houses of total has remained in and around 35-40% of stock, increasing in absolute terms by 12.1% on
2002 figures by 2016. Flats and apartments were the highest growing housing type in that same period
though, seeing an almost 89% increase on 2002 figures. They are presently just under 24.9% of the total
residential stock share.
The annual volume of building completions fell significantly across the country and in Dublin when
compared with the annual volume recorded in 2006. Over a 90% decline from peak in 2006 to trough in
2013 (Figure 4.1). While there has been significant growth in completions in recent years, it has still not
recovered to near the level’s pre-crash. For the past 10 years there has been an average of 4,004 units
completed per annum in Dublin with a cumulative total of just 40,043 units being completed over the
period. These unit completions number are relatively even spread across the 4 local authority areas and
not concentrated in any one area. Fingal County experienced the largest growth adding 12,668 new units
to the market from 2010-2020.
25,000
2010-2020
+11,672units 20,000
2010-2020
+8,095units 15,000
2010-2020
+7,608units 10,000
2010-2020
+12,668units 5,000
-
1999200020012002200320042005200620072008200920102011201220132014201520162017201820192020
Dún Laoghaire-Rathdown Fingal South Dublin Dublin City
Figure 4.1: CSO/ESB Residential Completions 1999-2020 in Dublin By Local Authority
Of the 40,043 units completed in Dublin, 36.5% of those units (14,601 units) were apartments, while 63.4%
or 25,442 units were houses. The scale of development has clearly ramped up in recent years with the
average level of annual completions for the county now at 6,626. A similar profile of completions existed
in South Dublin which has completed 8,095 units in the past 10 years, or an average of 809 units per
annum, with just 20.3% or 1,641 units classified as apartments (164 units per annum). By contrast, in the
past three years, apartments have comprised the bulk of completed units in both Dublin City and Dún
Laoghaire-Rathdown (Figure 4.2 overleaf). In the past three years, apartments have comprised the bulk of
completed units in both Dublin City and Dún Laoghaire-Rathdown comprising 63.0% of all units or 5,766
units. By comparison, just 12.3% of units completed in South Dublin were apartments (608 units).HOUSING MARKET ASSESSMENT - DUBLIN CITY & CLONLIFFE ROAD
During this period of chronic housing undersupply, population has continued to grow strongly across Dublin
(over 13% between 2006 and 2016). This type of dysfunction within the housing market is impacting on the
quality of life of large sections of society. This is best illustrated by the fact that for the first time since the
foundation of the State, average household size increased in the last census. Many thousands of people can
no longer choose their desired living arrangements and must remain living with family for longer than
planned or in many cases have no home at all.
A further two markers of this undersupply can be viewed in data relating to group housing. The proliferation
of shared occupancy is now a very common feature of the Dublin housing market. This is especially
concentrated in the private rental sector. The latest 2016 Census statistics indicate that this phenomenon
is pervasive and accounts for 30.0% of all rented units in Dublin where multiple unrelated households
and choosing to live together in a single unit. Equally, it can be seen in the proportion of adults (over 21
years old) living at home with their parents , which has increased nationally from 168,001 persons in 2011 to
178,441 persons in 2016 indicating a 6.2% growth in this figure in just 5 years.
While undersupply in any given market can be difficult to quantify exactly, there is an abundance of markers
to indicate that the Dublin housing market is not functioning correctly and is in urgent need of increasing
housing supply to meet demands.
Comple�ons: House, Dublin by LA
6,000
5,000
4,000
3,000
2,000
1,932
1,386 1,384 1,782
1,000 1,142 1162
711
468 272 327
-
2011 2012 2013 2014 2015 2016 2017 2018 2019 2020
Dún Laoghaire-Rathdown (House) Fingal (House) South Dublin (House) Dublin City (House)
Comple�ons: Apartment, Dublin by LA
3,500
3,000
2,500
2,000 1,229 1901
1,500 657 707
927
1,000 535
438 322
500
213 234
-
2011 2012 2013 2014 2015 2016 2017 2018 2019 2020
Dún Laoghaire-Rathdown (Apartment) Fingal (Apartment)
South Dublin (Apartment) Dublin City (Apartment)
Figure 4.2: Housing Completions 2011-2020 By Apartment and House TypeHOUSING MARKET ASSESSMENT - DUBLIN CITY & CLONLIFFE ROAD
Supply Pipeline
An analysis of planning consents data indicates a relatively strong pipeline for granted and commenced
applications in Dublin providing a cumulative 66,160 units across 455 schemes* as of 2021. 29.2% of all
applications are for major schemes of 150 units or more, they constitute 74.9% of the unit pipeline.
Equally, minor schemes of under 25 units, account for 22.0% of the permissions but just 2.1% of units.
Dublin City accounts for 22,009 units (33.3%) of this pipeline across 155 schemes. While this pipeline to be
completed over the next 5 years is strong, based on historic data, the completion rate from this figure is
likely to be significantly less. For example, in the period between 2012 and 2020 in Dublin, consents for
6,243 units across 109 schemes of 9 units or more elapsed/expired with no unit completion. Moreover, the
level of consents will need to continue over the next number of years to meet demand from 2025-2030.
The trend in Dublin has been to seek smaller unit sizes with 69.9% of all granted units for 1 or 2 bedrooms
which aligns significantly with the changing demographic profile. This composition varies across local
authorities with South Dublin having the highest concentration of schemes with units of 3-bed or more at
42.0%, compared to the Dublin Region average of 29.3%.
The current pipeline has shifted from
the previous 10 years focusing on
Major Residential Medium Residential Minor Residential
house units, to a more 60/40 split (more than 150 (between 25 and (10+, less than 25
between apartments and houses. residential units) 150 residential units) residential units)
This will provide a greater mix of Area Schemes Units Schemes Units Schemes Units
DCC 27.1% 76.1% 43.9% 20.6% 29.0% 3.3%
units and cater better to reducing DLR 24.3% 67.6% 57.4% 30.2% 18.3% 2.2%
household size and shifting Fingal 29.2% 73.6% 53.3% 24.5% 17.5% 2.0%
occupancy demands in Dublin. SDCC 43.1% 83.6% 36.9% 14.3% 20.0% 2.1%
Dublin Overall 29.2% 74.9% 48.8% 22.7% 22.0% 2.5%
Planning Application Pipeline By Scheme Size in Dublin By Local Authority (2021)
While this pipeline to be completed
over the next 5 years is healthy,
based on historic data, the resultant Area Units 1 Bed 2 Bed 3 Bed 4 Bed 5 Bed 5 Bed+
completion rate from this figure is DCC 22,009 38.7% 49.5% 9.5% 1.1% 0.3% 0.0%
likely to be significantly less. DLR 14,526 22.1% 46.8% 19.5% 9.9% 1.3% 0.0%
Fingal 18,111 16.5% 40.9% 25.7% 14.4% 2.1% 0.0%
Moreover, the level of consents will
SDCC 11,514 19.6% 36.6% 33.2% 8.7% 0.1% 0.0%
need to continue over the next Dublin Overall 66,160 25.7% 44.3% 20.3% 8.0% 1.0% 0.0%
number of years to meet ESRI Planning Application Pipeline By Unit Size in Dublin By Local Authority (2021)
projected demand from 2025-2030.
Presently, the current supply
Apartments Houses Mixed Development
pipeline, assuming 100% is Area Schemes Units Schemes Units Schemes Units
developed” will still be insufficient DCC 74.8% 73.9% 4.5% 0.7% 18.1% 24.0%
DLR 45.2% 35.5% 12.2% 3.2% 41.7% 59.9%
units to meet the minimum housing
Fingal 24.2% 31.9% 47.5% 21.7% 27.5% 45.3%
requirement to 2030 and indicates a SDCC 40.0% 42.6% 24.6% 8.2% 35.4% 49.2%
shortfall of -34.6% (or a cumulative Dublin Overall 49.0% 48.5% 20.7% 8.3% 29.0% 42.1%
requirement of 35,011 additional Planning Application Pipeline By Type in Dublin By Local Authority (2021)
units).
*Consents data refers to all applications granted or
partially commenced for schemes above 9 units.You can also read