Haim Israel Equity Strategist - Timestamp: 18 May 2021 11:39AM EDT
←
→
Page content transcription
If your browser does not render page correctly, please read the page content below
Unauthorized redistribution of this report is prohibited. This report is intended for dafna.sholomovich@bofa.com

1
Timestamp: 18 May 2021 11:39AM EDT
                                                                                                                                                        Haim Israel >>
                                                                                                                                                        Equity Strategist
A Transforming World as 100 People
    What if our planet was a village of a hundred?

    Source: BofA Global Research, Worldmeter, World Bank, The Insider, World Economic Forum, United Nations
                                                                                                              BofA GLOBAL RESEARCH

2
D&ID You Know? The bad news….
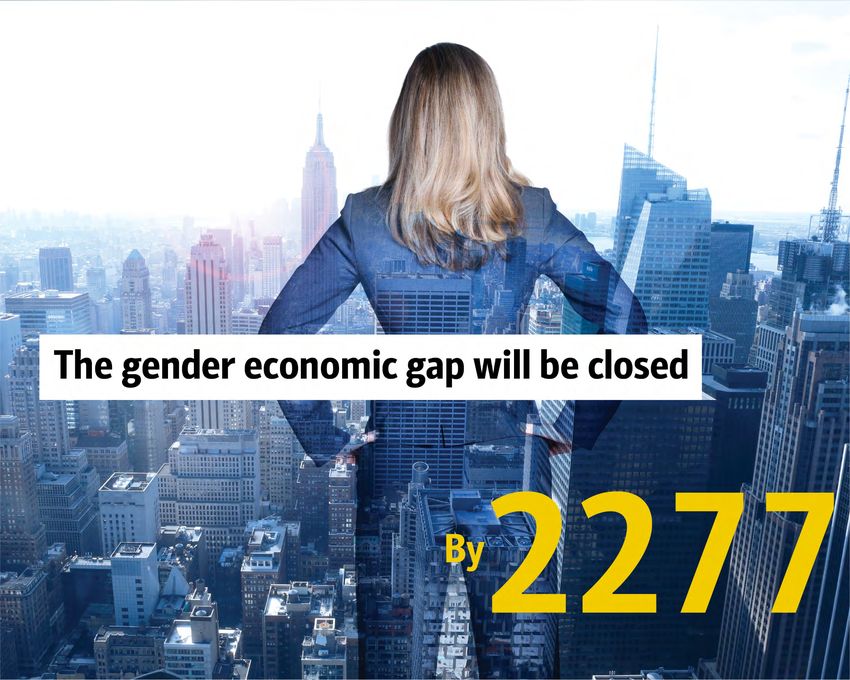
• At the current rate, it will take 257 years for the economic gender gap to close
• There are more men called ‘Dave’ in the UK financial industry than women managing funds…
• … and more CEOs in Australia called ‘Andy’ than female chief executives
• For the first time in six years in 2020 there were no black chairs, CEOs or CFOs in the FTSE 100
• Around 70 countries still criminalise homosexuality. Some with the death penalty
• 90% of children with disabilities in EMs do not attend school
3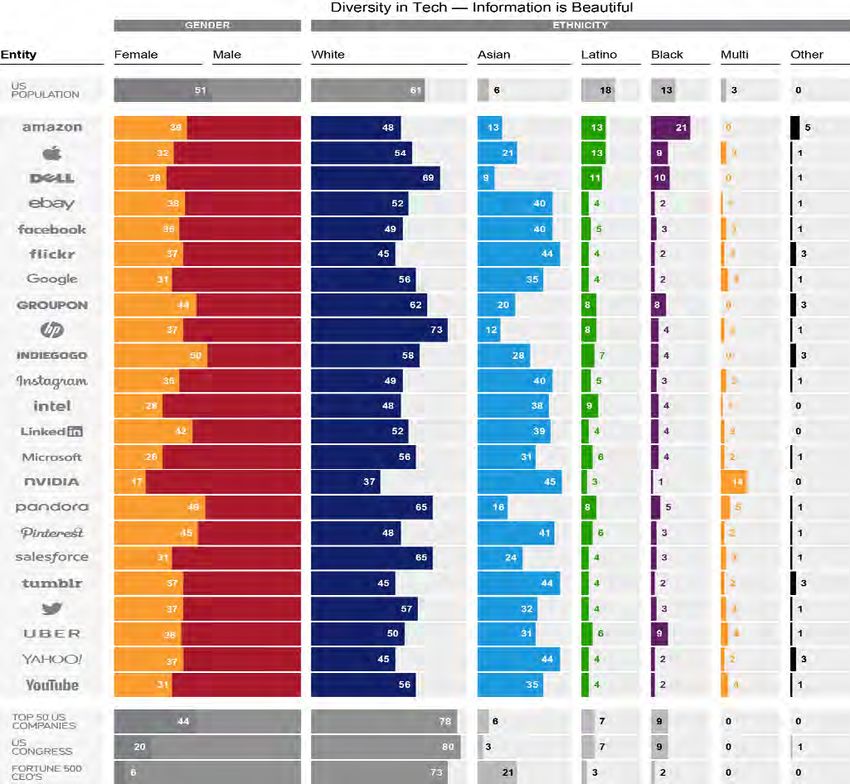
COVID’s long-term economic impact will be diverse
    • COVID’s hit to women’s jobs could cost the world US$1tn by 2030

     Job finding rate by gender (%, 12-month moving average)                                Job separation rate by gender (12-month moving average)
     Share of unemployed workers finding jobs                                               Share of employed workers losing their jobs
                                                                                              8%
    40%
                 Men                                                                          6%
    30%
                                                                                                        Women
    20%                                                                                       4%
               Women                                                                                     Men
    10%                                                                                       2%

    0%                                                                                        0%
      1991               1996             2001      2006    2011     2016         2021          1991            1996             2001     2006   2011     2016       2021

     Source: Bureau of Labor Statistics                                                     Source: Bureau of Labor Statistics
                                                                    BofA GLOBAL RESEARCH                                                                BofA GLOBAL RESEARCH

     Job finding rate by race (%, 12-month moving average)                                  Job separation rate by race (%, 12-month moving average)
     Share of unemployed workers finding jobs                                               Share of employed workers losing their jobs
     40%                                                                                   10%
                White
                                                                                           8%
     30%                                                                                             Black
                  Hispanic                                                                 6%
     20%                                                                                           Hispanic
                 Black                                                                     4%
                                                                                                     White
     10%                                                                                   2%
                                                                                           0%
       0%
                                                                                             1997         2000        2003         2006   2009   2012   2015     2018
         1997          2000        2003      2006    2009   2012   2015    2018
     Source: Bureau of Labor Statistics                                                     Source: Bureau of Labor Statistics
4                                                                   BofA GLOBAL RESEARCH                                                                BofA GLOBAL RESEARCH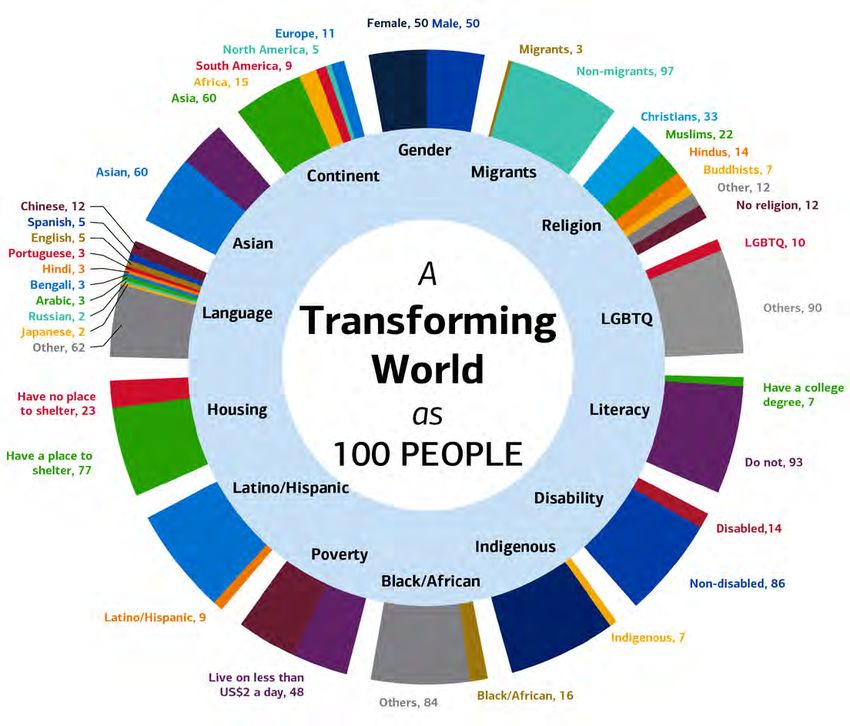
US population by race/ ethnicity

        Diversity is set to increase in coming decades
        By 2045, White-Caucasian Americans will be the minority group

       90%
                           12.5%                        12.8%                        13.0%                 13.3%                  13.6%
                           18.7%
                                                        21.1%
                                                                                     23.5%
       60%                                                                                                 25.7%
                                                                                                                                  27.5%

       30%                 59.7%                        55.8%                        51.7%                 47.8%                  44.3%

        0%
                            2020                        2030                         2040                   2050                  2060

              White                Hispanic or Latino    Black or African American           Asian   Two or more races   Native or Indigenous

        Source: US Census Bureau

                                                                                                                             BofA GLOBAL RESEARCH

5
US large-cap diversity report card

• Slow progress, all S&P 500 boards have at least 1 woman for the first time in over 20 years

      Average % of Women on board for S&P 500 companies                                                     Only c5% of S&P 500 companies have a female CEO
      2020 or latest year                                                                                   2020 or latest year

     30%                                                                                                   6.0%
                                                                                                                                                      5.2%                      5.2%
                                                                                             26% 27%                                                           4.9% 5.1%                                 4.8%
     25%
                                                                                      25%                                                                                               4.4% 4.6%
                                                                              22%                          4.0%                              3.8%
                                                                       20%
                                                                19%                                                                  2.9%
     20%
                                                         18%
                                                 17%                                                                        1.9%
                                          16%                                                              2.0% 1.5%
                                   15%
     15% 14% 14% 14%

     10%                                                                                                   0.0%
             2008          2010           2012          2014           2016          2018           2020            2010             2012             2014             2016             2018             2020

      Source: Bloomberg, BofA US Equity & US Quant Strategy                                                 Source: Bloomberg, BofA US Equity & US Quant Strategy
      Note: Based on current constituents of the S&P 500. 2020 is latest year if available or else prior    Note: Based on current constituents of the S&P 500. 2020 is latest year if available or else prior
      year if not yet available                                                                             year if not yet available

                                                                                 BofA GLOBAL RESEARCH                                                                                  BofA GLOBAL RESEARCH

6
SMID caps lead in gender diversity at senior management level
• 5.3% of SMID caps in Europe have a female CEO or equivalent vs 3.3% of large caps
Roughly one in five S&P 500 board members is a PoC Average % of companies with female CEO : SMID leading
% people of colour (PoC) on the board MSCI Large vs SMID
7.0%
50%
MSCI Europe Large Cap MSCI Europe SMID Cap
40%
40%
5.5%
30% 28%
25%
22% 23% 23%
20% 20% 21%
20% 16% 4.0%
10%
10%
2.5%
0%
1.0%
2008
2009
2010
2011
2012
2013
2014
2015
2016
2017
2018
2019
2020
Source: Bloomberg, BofA EMEA ESG Research
Source: ICE Data Services, BofA US Equity & Quant Strategy Note: Based on current constituents. 2020 is latest year available or else prior year if not yet
Note: People of colour includes Black, Hispanic, Asian, Native American, and Pacific Islander. , 2020 available.
or latest year of data where disclosed
BofA GLOBAL RESEARCH BofA GLOBAL RESEARCH
7Disclosure of D&I data is a major issue beyond gender
• Less than half (45%) of S&P 500 companies disclose detailed workforce diversity metrics
around ethnicity and race
Workforce diversity policies - disclosure by sector
% of S&P 500 companies that report having diversity and discrimination policies
Diversity and Discrimination Diversity and Discrimination Diversity and Discrimination Diversity and Discrimination Diversity and Discrimination
Policy Policy - Women Policy - PoC Policy - Veterans Policy - LGBTQ
Communication Services 88% 69% 65% 69% 69%
Consumer Discretionary 98% 57% 49% 43% 51%
Consumer Staples 88% 55% 55% 45% 58%
Energy 100% 70% 43% 43% 35%
Financials 82% 63% 63% 55% 63%
Health Care 98% 66% 55% 55% 58%
Industrials 97% 68% 62% 59% 52%
Information Technology 93% 75% 59% 59% 61%
Materials 36% 18% 14% 14% 7%
Real Estate 97% 23% 13% 10% 13%
Utilities 100% 68% 68% 64% 71%
Total 91% 61% 53% 50% 52%
Source: ICE Data Services, BofA US Equity & Quant Strategy
BofA GLOBAL RESEARCH
8Big Tech: excels in Innovation….average at best in Diversity & Inclusion…
Diversity in Tech
Employee breakdown in technology companies compared with the wider US population/economy
Source: Visual Capitalist, Information is Beautiful
BofA GLOBAL RESEARCH
9Tech case study: low D&I leads to “discriminating” products?
AI algorithm bias news headlines
Robots are not free of discrimination
Source: Towards Data Science
BofA GLOBAL RESEARCH
10D&ID You Know? The potential is:
• Around 45% of Fortune 500 companies have been founded by immigrants or the children of
immigrants: e.g. Steve Jobs (Syria), Jeff Bezos, (Cuba), Elon Musk (South Africa)
• If we had fully harnessed D&I since 1990 we could have boosted US GDP by US$70tn
• If the US Latino economy were a country, it would be the 8th largest economy in the world…
• … and If LGBTQ+ were a nation, it would be the 4th largest economy in the world at US$3.9tn
• For the first time in 20 years, all S&P 500 boards have at least 1 woman
11Diversity and inclusion potential in numbers
US$160tn of human capital wealth loss wealth loss on gender equality, US$70tn of racial and gender gap cost since 1990….
Examples of how much was lost, and what is the potential of gains form D&I implementation (US$tn)
180
160
120
70
60
28
10 13
2.8 3.9
0
US Latino economy LGBTQ economy Increase in wages Gain to global GDP Full gender equality Race and gender Loss of human
GDP (8th largest GDP (4th largest and benefits from from proactive addition to global gap US cost since capital wealth from
globally) globally) gender equality gender equality GDP 1990 gender equality
since 2000
Source: Glassdoor.com, BofA Global Research, World Bank, OECD, UN
BofA GLOBAL RESEARCH
12Wealth management: welcome to the US$72tn opportunity
Women’s wealth is growing at 1.5x the rate of men’s Women’s wealth is already at c.US$72tn
Total private wealth held by gender (US$tn) Total private wealth held by women (US$tn)
180 90
Women's CAGR = 9%
Men's CAGR = 6% 72
120 60
51
34
60 30
0 0
2010 2015 2020 2010 2015 2020
Source: BCG Female-controlled Male-controlled Source: BCG
BofA GLOBAL RESEARCH BofA GLOBAL RESEARCH
13Leadership: D&I improves performance indicators….
Inclusive Leadership and Team Performance
What is the top-down effect from inclusive leaders/management?
Source: Deloitte
BofA GLOBAL RESEARCH
14….leads to culture satisfaction….
Culture is critical, and hard to game
Culture & Values score is the biggest determinant of overall job satisfaction
65%
59%
56%
55%
47%
46%
45%
39%
35%
25%
Culture & Values Senior Management Career Opportunities Work Life Balance Compensation & Benefits
Source: Glassdoor.com, BofA Global ESG Research, US Equity & Quantitive Strategy
BofA GLOBAL RESEARCH
15…Which = higher ROE, lower EPS risk
Workforce diversity was an effective signal of future ROE in
Gender diversity correlates with higher future ROE almost all sectors
Median forward 1yr ROE based on % of women on board and Median spread in 1-yr ROE between companies with above
% of women managers (2005-20) vs. below sector median workforce diversity
17.0 Consumer Staples 10.0
Communication Services 5.7
Forward 1yr ROE (median)
16.0 15.6
Health Care 4.4
15.0
Materials 3.5
14.0 13.4 Energy 2.9
13.0
Information Technology 2.5
12.0
12.0 11.6 Real Estate 1.7
11.0 Financials 0.1
10.0 Utilities -0.2
% Women on Board % Women Managers Consumer Discretionary -1.8
High % Low % Industrials -4.2
Source: Refinitiv, BofA US Equity & Quant Strategy -8.00 -4.00 0.00 4.00 8.00 12.00
Note: High (Low) % of Women on Board defined as above (below) the universe median; High (Low) % of
Women Managers defined as above (below) 30%
Source: Refinitiv, BofA US Equity & Quant Strategy; based on BofA-covered US companies
BofA GLOBAL RESEARCH BofA GLOBAL RESEARCH
16Ethnic & racial diversity also signals better results
…and lower EPS risk
More ethnic & racial workforce diversity = higher ROE… Median forward 1-yr EPS volatility based on the % of
Median forward 1-yr ROE based on the % of people of color people of color in the workforce for S&P 500 companies
in the workforce for S&P 500 companies (2008-20) (2008-20)
0.26
15.5
15.3
15
0.25
14.5
14.2
14
13.5 0.24
Above median diversity Below median diversity Above median diversity Below median diversity
Source: Revelio Labs, BofA US Equity & Quant Strategy Source: Revelio Labs, BofA US Equity & Quant Strategy
Note: People of color is defined as Black, Hispanic, and Asian Note: People of color is defined as Black, Hispanic, and Asian
BofA GLOBAL RESEARCH BofA GLOBAL RESEARCH
17Ray of hope Source: BofA Merrill Lynch Global Research: “The New Kid On The Block” 18
New approach to D&I policies driven by COVID

         Covid has led to the implementation of D&I policies
         One-size-fits-all approach doesn’t work for D&I: different groups value differentiated interventions

         Source:BCG UK Diversity Study, Q4 2018 Note: BAME=Black, Asian, and Minority Ethnic
                                                                                                                BofA GLOBAL RESEARCH

19
Diversity-focused AUM is surging and have generated above-market returns
Women/Gender/Diversity-focused funds saw US$1.3bn inflows
Women/Gender/Diversity-focused funds AUM rose over 3x over
over the past 3 years
the past 3 years
Cumulative flows into Women/Gender/Diversity funds
Total AUM of Women/Gender/Diversity-focused funds (US$bn)
1.6
3.0
1.4
1.2
1.0 2.0
0.8
0.6
1.0
0.4
0.2
0.0 0.0
2018 2019 2020 2021 2018 2019 2020 2021
Source: EPFR Global, BofA European Equity Quant Strategy
Source: EPFR Global, BofA European Equity Quant Strategy
BofA GLOBAL RESEARCH
BofA GLOBAL RESEARCH
Top 20 largest global equities ESG ETFs have over US$90bn AUM Women/Gender/Diversity-focused funds have shown higher risk-
AUM of top 20 Global ESG/SRI ETFs (US$bn) adjusted return over the past 5 years
100 Women/Gender/Diversity funds risk-adjusted return annualised
90 over past 5 years
80
70 0.87
60
50 0.66
40
30
20
10
0
2019 2020 2021 Women/Gender/Diversity Funds MSCI All Country World Index
Source: BofA European Equity Quant Strategy; EPFR Global
Source: BofA European Equity Quant Strategy, EPFR Global, Bloomberg, Refinitiv
20 BofA GLOBAL RESEARCH BofA GLOBAL RESEARCHGen Z: Social warrior, the “Clicktivists” generation
• 72% of Gen Z believe they can be part of a social movement
Gen Z are citizens of the world
“Do you consider yourself to be a citizen of the world or a Gen Z expects social unrest
citizen of your own country?” “Which of these are you most concerned about?”
100% 40%
30%
20%
50%
10%
0%
0% Climate change Economic The next War or social
Gen Z Millennials Gen X Baby Boomer crisis/recession pandemic unrest
Citizen of my country Citizen of the world Neither Gen Z Millennials Gen X Baby Boomer
Source: BofA Thematic Proprietary Survey n=14,592, conducted Aug 2020 “Which of these are you most
Source:BofA Thematic Proprietary Survey n=14,592, conducted Aug 2020 concerned about?”
BofA GLOBAL RESEARCH BofA GLOBAL RESEARCH
21AUM in gender- or diversity-focused funds has tripled in the past three years
• US$4 of every US$10 invested is in ESG, YTD
ESG is important to Millennials and women in their investment decisions
Percentage who agree on the importance of ESG in their investment process
100%
87%
65% 64%
50% 48% 46%
39%
0%
Millennials Gen X Boomers Silent Women Men
Source: U.S. Trust Wealthy and Worth Survey
BofA GLOBAL RESEARCH
22Gen Z global income to grow nearly 5x in the 2020s
• Gen Z share of global income will grow from $7tn (10%) in 2020 to $33tn (27%) in 2030
Gen Z income will exceed Millennials income by the early 2030s
Global income for Gen Z and Millennials (US$tn)
90
Gen Z Millennials
60
30
0
2015 2020 2025 2030 2035 2040
Source: Euromonitor
BofA GLOBAL RESEARCH
23Public discourse around D&I is increasing
• The number of articles mentioning ‘diversity & inclusion’ is skyrocketing
# of news articles mentioning 'Diversity & Inclusion‘ # of news articles mentioning 'Social Justice‘
Number of articles has consistently increased since 2004 Number of articles has drastically increased since 2014
15000 800
600
10000
400
5000
200
0 0
1980
1982
1984
1986
1988
1990
1992
1994
1996
1998
2000
2002
2004
2006
2008
2010
2012
2014
2016
2018
Source: LexisNexis, NYT
Source: LexisNexis, NYT
BofA GLOBAL RESEARCH
BofA GLOBAL RESEARCH
24Awareness comes with a price tag
• #MeToo scandals wiped out c.US$10bn of market capital in 3 companies
MeToo controversies can weigh on stock price performance
Average peak-to-trough performance of sexual harassment controversy stocks relative to the S&P 500
105
100
95
90
85
80
75
70
-30 -15 0 15 30 45 60 75 90 105 120 135 150 165 180 195 210 225 240 255 270 285 300 315 330 345 360
# of days before/after controversies
Source: LexisNexis, NYT
BofA GLOBAL RESEARCH
25“S” is the new “E” Source: BofA Merrill Lynch Global Research: “The New Kid On The Block” 26
D&I will be for the 2020s what Climate action was for the 2010s

        The solution will come from…Wall Street!
        (Assets in US$tn)

         90                                                                                                                                                3.0x S&P 500

         80

         70

         60

         50

         40                                                                                                                                                     82
                                                                                                                             1.0x S&P 500

         30
                                                                             0.7x S&P 500

         20
                                                                                                                                  31
         10                   0.2x S&P 500                                           20

                                     3.5
           0
                assets investing in climate change                     assets investing in ESG                  assets investing in sustainability   TCFD investors' signatures

        Source: BofA Securities global research , US SIF Foundation, visual capitalist, S&P value, as of December 20, 2020
                                                                                                                                                                            BofA GLOBAL RESEARCH

27
source: 28 BNEF, BofA Securities global research
source:
 29     WEF
Thank you

18 Ma y 2021

>> Employed by a non-US affiliate of MLPF&Sand is not registered/qualified as a research analyst under the FINRA rules.
Refer to "Other Important Disclosures" for information on certain BofA Merrill Lynch entities that take responsibilityfor this report in particular jurisdictions.
BofA Merrill Lynch does and seeks to do business with issuers covered in its research reports. As a result, investors should be aware that the firm may have a conflict of interest that could affect the objectivity of this report.
Investors should consider this report as only a single factor in making their investment decision.
Refer to important disclosures on page 32-37.
Analyst Certification

     I, Ha i m Israel, hereby certify that the vi ews expressed in this research report a ccurately reflect my personal vi ews about the subject securities and issuers. I a lso certify that no part of my
     compensation was, is, or will be, directly or i ndirectly, related to the specific recommendations or vi ew expressed i n this research report.

31
Important Disclosures
FUNDAMENTAL EQUITY OPINION KEY: Opinions include a Volatility Risk Rating, an Investment Rating and an Income Rating. VOLATILITY RISK RATINGS, indicators of potential price fluctuation, are: A - Low,
B - Medium and C - High. INVESTMENT RATINGS reflect the analyst’s assessment of both a stock’s: absolute total return potential as well as its attractiveness for investment relative to other stocks within its
Coverage Cluster (defined below). There are three investment ratings: 1 - Buy stocks are expected to have a total return of at least 10% and are the most attractive stocks in the coverage cluster; 2 - Neutral
stocks are expected to remain flat or increase in value and are less attractive than Buy rated stocks and 3 - Underperform stocks are the least attractive stocks in a coverage cluster. Analysts assign investment
ratings considering, among other things, the 0-12 month total return expectation for a stock and the firm’s guidelines for ratings dispersions (shown in the table below). The current price objective for a stock
should be referenced to better understand the total return expectation at any given time. The price objective reflects the analyst’s view of the potential price appreciation (depreciation).
Investment rating Total return expectation (within 12-month period of date of initial rating) Ratings dispersion guidelines for coverage cluster*
Buy ≥ 10% ≤ 70%
Neutral ≥ 0% ≤ 30%
Underperform N/A ≥ 20%
* Ratings dispersions may vary from time to time where BofA Global Research believes it better reflects the investment prospects of stocks in a Coverage Cluster.
INCOME RATINGS, indicators of potential cash dividends, are: 7 - same/higher (dividend considered to be secure), 8 - same/lower (dividend not considered to be secure) and 9 - pays no cash dividend. Coverage
Cluster is comprised of stocks covered by a single analyst or two or more analysts sharing a common industry, sector, region or other classification(s). A stock’s coverage cluster is included in the most recent
BofA Global Research report referencing the stock.
32Important Disclosures
Due to the nature of s trategic analysis, the issuers or securities recommended or discussed i n this report a re not continuously followed. Accordingly, i nvestors must regard this report as provi ding
s ta nd-alone analysis and should not expect continuing a nalysis or a dditional reports relating to such issuers and/or securities.
BofA Gl obal Research personnel (including the analyst(s) responsible for this report) receive compensation based upon, a mong other factors, the overall profitability of Bank of America
Corpora tion, including profits derived from investment banking. The analyst(s) responsible for this report ma y also receive compensation based upon, a mong other factors, the overall profitability
of the Ba nk’s sales and trading businesses relating to the class of securities or financial i nstruments for which s uch a nalys t is responsible.
33Other Important Disclosures
Pri ces are i ndicative a nd for i nformation purposes only. Except as otherwise stated in the report, for the purpose of any recommendation i n relation to: 1) a n equity s ecurity, the price referenced is
the publicly tra ded price of the security a s of close of business on the day pri or to the date of the report or, i f the report is published during i ntraday tra ding, the price referenced is indicative of the
tra ded price as of the date and time of the report; or 2) a debt security (i ncluding equity preferred and CDS), prices are i ndicative as of the date and time of the report a nd a re from va rious s ources
i ncl uding BofA Securities trading desks.
Offi cers of BofAS or one or more of i ts affiliates (other than research analysts) may have a financial i nterest i n securities of the issuer(s) or i n related investments.
Refer to BofA Global Research policies relating to conflicts of interest.
"BofA Securities" includes BofA Securities, Inc. ("BofAS") and its affiliates. Investors should contact their BofA Securities representative or Merrill Global Wealth Management financial advisor
if they have questions concerning this report or concerning the appropriateness of any investment idea described herein for such investor. "BofA Securities" is a global brand for BofA Global
Research.
Information relating to Non-US a ffiliates of BofA Securities and Distribution of Affiliate Research Reports:
BofAS a nd/or Merrill Lynch, Pierce, Fenner & Smi th Incorporated ("MLPF&S") may i n the future distribute, information of the following non-US affiliates i n the US (short name: l egal name,
regul ator): Merrill Lynch (South Afri ca): Merrill Lynch South Africa (Pty) Ltd., regulated by The Financial Service Board; MLI (UK): Merrill Lynch International, regulated by the Financial Conduct
Authori ty (FCA) a nd the Prudential Regulation Authority (PRA); BofASE (France): BofA Securities Europe SA is a uthorized by the Autorité de Contrôle Prudentiel et de Résolution (ACPR) and
regul ated by the ACPR a nd the Autorité des Ma rchés Financiers (AMF); BofA Europe (Milan): Bank of America Europe Designated Acti vity Company, Mi lan Branch, regulated by the Bank of Italy, the
European Central Bank (ECB) a nd the Central Bank of Ireland (CBI); BofA Europe (Frankfurt): Bank of America Europe Designated Acti vity Company, Fra nkfurt Bra nch regulated by BaFin, the ECB a nd
the CBI; Merri ll Lynch (Australia): Merrill Lynch Equities (Australia) Li mited, regulated by the Australian Securities and Investments Commission; Merrill Lynch (Hong Kong): Merrill Lynch (Asia
Pa ci fic) Limited, regulated by the Hong Kong Securities and Futures Commission (HKSFC); Merrill Lynch (Singapore): Merrill Lynch (Singapore) Pte Ltd, regulated by the Monetary Authority of
Si ngapore (MAS); Merrill Lynch (Ca nada): Merri ll Lynch Ca nada Inc, regulated by the Investment Industry Regulatory Orga nization of Canada; Merri ll Lynch (Mexico): Merrill Lynch Mexico, SA de CV,
Ca s a de Bolsa, regulated by the Comisión Nacional Bancaria y de Valores; Merrill Lynch (Argentina): Merrill Lynch Argentina SA, regulated by Comisión Nacional de Valores; BofAS Japan: BofA
Securi ties Japan Co., Ltd., regulated by the Financial Servi ces Agency; Merri ll Lynch (Seoul): Merrill Lynch International, LLC Seoul Branch, regulated by the Financial Supervisory Service; Merrill
Lynch (Ta i wan): Merrill Lynch Securities (Taiwan) Ltd., regulated by the Securities and Futures Bureau; BofAS India: BofA Securities India Limited, regulated by the Securities a nd Exchange Board of
India (SEBI); Merrill Lynch (Indonesia): PT Merri ll Lynch Sekuritas Indonesia, regulated by Otoritas Jasa Keuangan (OJK); Merrill Lynch (Israel): Merrill Lynch Israel Li mited, regulated by Israel
Securi ties Authority; Merri ll Lynch (Russia): OOO Merri ll Lynch Securities, Moscow, regulated by the Central Bank of the Russian Federation; Merrill Lynch (DIFC): Merrill Lynch International (DIFC
Bra nch), regulated by the Dubai Financial Services Authority (DFSA); Merri ll Lynch (Spain): Merrill Lynch Capital Ma rkets Espana, S.A.S.V., regulated by Comisión Nacional del Mercado De Valores;
Merri l l Lynch (Brazil): Merrill Lynch S.A. Corretora de Títulos e Valores Mobiliários, regulated by Comissão de Valores Mobiliários; Merrill Lynch KSA Company: Merri ll Lynch Kingdom of Saudi Arabia
Compa ny, regulated by the Ca pital Market Authority.
Thi s information: has been a pproved for publication and is distributed in the United Ki ngdom (UK) to professional clients and eligible counterparties (as each is defined i n the rules of the FCA a nd
the PRA) by MLI (UK), whi ch is a uthorized by the PRA a nd regulated by the FCA a nd the PRA - details about the extent of our regulation by the FCA a nd PRA a re a vailable from us on request; has
been approved for publication a nd is distributed in the European Economic Area (EEA) by BofASE (France), which is authorized by the ACPR a nd regulated by the ACPR a nd the AMF; has been
cons idered and distributed i n Japan by BofAS Japan, a registered s ecurities dealer under the Financial Instruments a nd Exchange Act i n Japan, or i ts permitted a ffiliates; is issued and distributed i n
Hong Kong by Merrill Lynch (Hong Kong) which is regulated by HKSFC; i s issued and distributed i n Taiwan by Merri ll Lynch (Taiwan); i s issued a nd distributed in India by BofAS India; a nd is issued
a nd distributed in Singapore to i nstitutional investors and/or accredited i nvestors (each as defined under the Financial Advisers Regulations) by Merrill Lynch (Singapore) (Company Registration No
198602883D). Merri l l Lynch (Singapore) i s regulated by MAS. Merri ll Lynch Equities (Australia) Limited (ABN 65 006 276 795), AFS Li cense 235132 (MLEA) distributes this i nformation in Australia
onl y to 'Wholesale' cl ients as defined by s .761G of the Corporations Act 2001. Wi th the exception of Bank of America N.A., Australia Branch, neither MLEA nor a ny of its affiliates i nvolved in
preparing this information is an Authorised Deposit-Taking Institution under the Banking Act 1959 nor regulated by the Australian Prudential Regulation Authority. No approval is required for
publ ication or distribution of this information in Brazil and its local distribution is by Merri ll Lynch (Brazil) in accordance with a pplicable regulations. Merrill Lynch (DIFC) is a uthorized and regulated
by the DFSA. Information prepared a nd i ssued by Merrill Lynch (DIFC) is done so in accordance with the requirements of the DFSA conduct of business rules. BofA Europe (Frankfurt) distributes this
i nformation i n Germany a nd i s regulated by Ba Fin, the ECB a nd the CBI. BofA Securities entities, including BofA Europe and BofASE (France), may outsource/delegate the marketing and/or provision
of certa in research s ervices or aspects of research s ervices to other branches or members of the BofA Securities group. You may be contacted by a different BofA Securities entity acting for and on
behalf of your s ervice provider where permitted by a pplicable law. This does not change your s ervice provider. Pl ease refer to the Electronic Communications Disclaimers for further i nformation.
34Other Important Disclosures
Thi s information has been prepared and issued by BofAS a nd/or one or more of its non-US a ffiliates. The author(s) of this i nformation may not be licensed to carry on regulated activities in your
juri s diction a nd, i f not licensed, do not hold themselves out as being a ble to do so. BofAS a nd/or MLPF&S i s the distributor of this information in the US a nd a ccepts full responsibility for
i nformation distributed to BofAS a nd/or MLPF&S cl ients i n the US by i ts non-US affiliates. Any US person receiving this information and wishing to effect a ny tra nsaction i n any s ecurity discussed
herein should do s o through BofAS and/or MLPF&S and not s uch foreign affiliates. Hong Kong recipients of this i nformation should contact Merrill Lynch (Asia Pacific) Li mited in respect of any
ma tters relating to dealing in s ecurities or provision of s pecific a dvice on securities or any other matters arising from, or i n connection with, this information. Singapore recipients of this
i nformation should contact Merrill Lynch (Singapore) Pte Ltd in respect of a ny matters a rising from, or in connection with, this information.
General Investment Related Disclosures:
Ta i wan Readers: Neither the information nor any opinion expressed herein constitutes a n offer or a solicitation of an offer to tra nsact i n any s ecurities or other financial instrument. No part of this
report ma y be used or reproduced or quoted i n a ny manner whatsoever i n Taiwan by the press or a ny other person without the express wri tten consent of BofA Securities.
Thi s document provides general i nformation only, a nd has been prepared for, and is i ntended for general distribution to, BofA Securities clients. Neither the i nformation nor a ny opinion expressed
cons titutes an offer or a n i nvitation to make an offer, to buy or s ell any s ecurities or other financial instrument or any derivative related to s uch s ecurities or instruments (e.g., options, futures,
wa rra nts, and contracts for differences). This document is not i ntended to provide personal i nvestment a dvice a nd i t does not take into account the s pecific i nvestment objectives, financial
s i tuation and the particular needs of, a nd is not directed to, any s pecific person(s). This document and its content do not constitute, a nd s hould not be considered to constitute, i nvestment advice
for purposes of ERISA, the US tax code, the Investment Advisers Act or otherwise. Investors should seek fi nancial a dvice regarding the appropriateness of investing i n financial i nstruments and
i mpl ementing i nvestment s trategies discussed or recommended in this document and should understand that statements regarding future prospects may not be realized. Any decision to purchase
or s ubscribe for s ecurities i n a ny offering must be based solely on existing public i nformation on such security or the information in the prospectus or other offering document issued i n connection
wi th s uch offering, and not on this document.
Securi ties a nd other financial instruments referred to herein, or recommended, offered or s old by BofA Securities, are not insured by the Federal Deposit Insurance Corporation and are not
deposits or other obligations of any i nsured depository i nstitution (including, Bank of America, N.A.). Investments in general and, derivatives, i n particular, i nvolve numerous risks, including, among
others, market risk, counterparty default risk and liquidity ri sk. No security, fi nancial instrument or derivative i s suitable for all investors. In some cases, securities and other fi nancial i nstruments
ma y be di fficult to va lue or sell and reliable i nformation a bout the value or risks related to the security or financial i nstrument may be difficult to obtain. Investors s hould note that income from
s uch s ecurities a nd other financial instruments, i f any, ma y fluctuate and that price or va lue of s uch s ecurities a nd i nstruments may ri se or fall and, in some cases, investors may l ose their entire
pri ncipal i nvestment. Past performance i s not necessarily a guide to future performance. Levels a nd basis for taxation may change.
Thi s report may contain a s hort-term trading idea or recommendation, which highlights a specific near-term catalyst or event impacting the issuer or the market that is anticipated to have a short-
term pri ce impact on the equity s ecurities of the issuer. Short-term trading i deas a nd recommendations a re different from and do not affect a stock's fundamental equity ra ting, which reflects both
a l onger term total return expectation and attractiveness for i nvestment relative to other stocks within i ts Coverage Cluster. Short-term tra ding ideas and recommendations may be more or l ess
pos itive than a stock's fundamental equity ra ting.
BofA Securities i s aware that the implementation of the i deas expressed i n this report may depend upon an i nvestor's a bility to "s hort" securities or other fi nancial i nstruments and that such action
ma y be l imited by regulations prohibiting or restricting "shortselling" i n many jurisdictions. Investors are urged to seek a dvice regarding the applicability of s uch regulations prior to executing a ny
s hort i dea contained i n this report.
Forei gn currency ra tes of exchange may adversely a ffect the va lue, price or i ncome of any s ecurity or financial i nstrument mentioned herein. Investors i n such securities a nd i nstruments, including
ADRs , effectively assume currency ri sk.
35Other Important Disclosures
UK Rea ders: The protections provided by the U.K. regulatory regime, i ncluding the Financial Servi ces Scheme, do not a pply i n general to business coordinated by BofA Securities entities l ocated
outs ide of the United Ki ngdom.
BofAS or one of i ts a ffiliates is a regular issuer of traded financial instruments l inked to securities that may have been recommended i n this report. BofAS or one of i ts a ffiliates may, a t any ti me,
hol d a tra ding position (long or short) in the s ecurities and financial i nstruments discussed in this report.
BofA Securities, through business units other than BofA Global Research, may ha ve issued and may i n the future issue tra ding ideas or recommendations that are i nconsistent with, and reach
di fferent conclusions from, the information presented herein. Such i deas or recommendations may reflect different ti me frames, assumptions, vi ews and analyti cal methods of the persons who
prepared them, and BofA Securities is under no obligation to ensure that such other tra ding ideas or recommendations a re brought to the attention of a ny recipient of this information.
In the event that the recipient received this information pursuant to a contract between the recipient a nd BofAS for the provision of research s ervices for a separate fee, a nd i n connection
therewith BofAS may be deemed to be a cting as a n i nvestment adviser, such status relates, if at a ll, s olely to the person with whom BofAS has contracted directly a nd does not extend beyond the
del ivery of this report (unless otherwise agreed specifically i n writing by BofAS If s uch recipient uses the servi ces of BofAS in connection with the sale or purchase of a security referred to herein,
BofAS ma y a ct as principal for i ts own account or as agent for a nother person. BofAS is and continues to act solely a s a broker-dealer in connection with the execution of any tra nsactions, i ncluding
tra nsactions in a ny s ecurities referred to herein.
Copyri ght a nd General Information:
Copyri ght 2021 Ba nk of America Corporation. All ri ghts reserved. i Qprofile℠, i Qmethod℠ are s ervice marks of Bank of America Corporation. i Qdatabase® is a registered servi ce mark of Bank of
Ameri ca Corporation. This i nformation is prepared for the use of BofA Securities clients a nd may not be redistributed, retransmitted or disclosed, i n whole or in part, or i n any form or manner,
wi thout the express written consent of BofA Securities. BofA Global Research information is distributed s imultaneously to i nternal and client websites a nd other portals by BofA Securities and is not
publ icly-available material. Any unauthorized use or disclosure is prohibited. Receipt a nd review of this i nformation constitutes your agreement not to redistribute, retransmit, or disclose to others
the contents, opinions, conclusion, or i nformation contained herein (including any i nvestment recommendations, estimates or price targets) without first obtaining express permission from a n
a uthorized officer of BofA Securities.
Ma teri als prepared by BofA Global Research personnel a re based on public i nformation. Facts a nd vi ews presented i n this material have not been reviewed by, a nd may not reflect i nformation
known to, professionals i n other business areas of BofA Securities, including investment banking personnel. BofA Securities has established information barriers between BofA Global Research a nd
certa i n business groups. As a result, BofA Securities does not disclose certain cl ient relationships with, or compensation received from, s uch i ssuers. To the extent this material discusses a ny l egal
proceeding or issues, it has not been prepared as nor i s it i ntended to express any l egal conclusion, opinion or a dvice. Investors should consult their own l egal advisers as to i ssues of law relating to
the s ubject matter of this material. BofA Global Research personnel’s knowledge of l egal proceedings i n which any BofA Securities entity a nd/or its directors, officers and employees may be
pl a intiffs, defendants, co-defendants or co-plaintiffs with or involvi ng issuers mentioned i n this material is based on public information. Facts and vi ews presented in this material that relate to a ny
s uch proceedings have not been revi ewed by, discussed with, and may not reflect information known to, professionals in other business a reas of BofA Securities i n connection with the l egal
proceedings or matters relevant to such proceedings.
36Other Important Disclosures
Thi s information has been prepared independently of a ny i ssuer of s ecurities mentioned herein a nd not in connection with any proposed offering of s ecurities or as agent of any i ssuer of any
s ecurities. None of BofAS any of i ts affiliates or their research analysts has a ny a uthority whatsoever to make any representation or warranty on behalf of the issuer(s). BofA Global Research policy
prohi bits research personnel from disclosing a recommendation, i nvestment ra ting, or investment thesis for review by an issuer prior to the publication of a research report containing s uch ra ting,
recommendation or investment thesis.
Any i nformation relating to the tax s tatus of financial instruments discussed herein is not intended to provide tax a dvice or to be used by a nyone to provi de tax a dvice. Investors are urged to s eek
ta x a dvi ce based on their particular ci rcumstances from an independent tax professional.
The i nformation herein (other than disclosure i nformation relating to BofA Securities a nd i ts affiliates) was obtained from va rious s ources a nd we do not guarantee its accuracy. This i nformation
ma y conta in links to third-party websites. BofA Securities is not responsible for the content of any third-party website or any l inked content contained in a third-party website. Content contained on
s uch third-party websites is not part of this i nformation and is not i ncorporated by reference. The inclusion of a link does not imply a ny endorsement by or a ny a ffiliation with BofA Securities.
Acces s to a ny third-party website is a t your own ri sk, a nd you should always review the terms and privacy policies at third-party websites before submitting a ny personal i nformation to them. BofA
Securi ties is not responsible for such terms and privacy policies and expressly disclaims a ny l iability for them.
Al l opinions, projections and estimates constitute the judgment of the author as of the date of publication and are subject to change without notice. Pri ces also a re subject to change without notice.
BofA Securities i s under no obligation to update this i nformation a nd BofA Securities a bility to publish i nformation on the subject i ssuer(s) in the future is subject to applicable quiet periods. You
s hould therefore assume that BofA Securities will not update any fact, ci rcumstance or opinion contained herein.
Certa i n outstanding reports or investment opinions relating to securities, financial instruments a nd/or i ssuers may no l onger be current. Al ways refer to the most recent research report relating to
a n i ssuer prior to making an investment decision.
In s ome cases, a n issuer may be classified as Restricted or may be Under Review or Extended Review. In each case, i nvestors should consider a ny i nvestment opinion relating to such issuer (or its
s ecurity a nd/or fi nancial i nstruments) to be suspended or wi thdrawn and should not rely on the a nalys es a nd i nvestment opinion(s) pertaining to such issuer (or i ts s ecurities and/or financial
i ns truments) nor should the analyses or opinion(s) be considered a solicitation of any ki nd. Sales persons and financial advisors affiliated with BofAS or any of its affiliates may not s olicit purchases
of s ecurities or financial i nstruments that a re Restricted or Under Review a nd may only s olicit securities under Extended Review i n a ccordance with firm policies.
Nei ther BofA Securities nor a ny officer or employee of BofA Securities a ccepts any l iability whatsoever for any direct, i ndirect or consequential damages or l osses arising from a ny use of this
i nformation.
37You can also read