H1 FY22 : RESULTS PRESENTATION | February 2022 - DREW BREES GLOBAL BRAND AMBASSADOR
←
→
Page content transcription
If your browser does not render page correctly, please read the page content below

H1 FY22 : RESULTS PRESENTATION   | February 2022

DREW BREES
GLOBAL BRAND AMBASSADOR
1H 22 RESULTS PRESENTATION FEB 2022

IMPORTANT NOTICE
AND DISCLAIMER
This document and any oral presentation accompanying it has been              Therefore, there can be no assurance that such forecasts, forward            Disclosures in this document, the accompanying presentation or any
prepared in good faith, however, no express or implied representation         looking statements or statements as to future affairs will be realised or    Other Materials are not investment advice and are not intended to be
or warranty is given as to the accuracy or completeness of the                that the Company’s actual or future results, or subsequent forecasts, will   relied upon as advice to investors or potential investors and do not take
information in this document, in any accompanying presentation                not vary significantly from such forecasts, forward looking statements       into account the investment objectives, financial situation or needs of
or in any other written or oral communication transmitted or made             and statements as to future affairs. The actual results may vary from        any particular investor. These should be considered, with independent
available to any investor or potential investor (collectively, the            the anticipated results and such variations may be material. Any             professional advice when deciding if an investment is appropriate.
“Other Materials”). Nothing in this document, in any accompanying             and all forecasts and financial information in this document, in any
presentation or in any Other Materials is, or shall be relied upon as, a      accompanying presentation and in any Other Materials are not, and            The information contained in this document (including tables) has not
promise or representation. All statutory representations and warranties       shall not be relied upon as, a promise or representation as to future        been audited in accordance with the Australian Auditing Standards.
are excluded, and any liability in negligence is excluded, in both cases to   matters. The Company accepts no responsibility or liability in relation
                                                                                                                                                           This document remains the property of the Company and the Company
the fullest extent permitted by law. No responsibility is assumed for any     to the accuracy or completeness of any forecasts, forward looking
                                                                                                                                                           reserves the right to require the return of this document (and any copies
reliance on this document or the accompanying presentation or any             statements or statements as to future affairs, or whether they are
                                                                                                                                                           or extracts hereof) at any time.
Other Materials.                                                              achievable. The Company does not assume any obligation to revise
                                                                              or update this document, any accompanying presentation, any                  The receipt of this document by any investor or potential investor shall
This document does not constitute an offer to sell, or a solicitation of an   Other Materials or any of the estimates, assumptions or expectations         constitute such investor’s or potential investor’s acceptance of the
offer to buy, any securities in any jurisdiction.                             underlying such forecasts, forward looking statements and statements         foregoing terms and conditions.
                                                                              as to future affairs. No representations or warranties are made as to
Without limiting the above, this document, any accompanying
                                                                              the accuracy or reasonableness of such estimates, assumptions or             All amounts disclosed in this document are presented in Australian
presentation and any Other Materials may contain forecasts, forward
                                                                              expectations or the forecasts, forward looking statements or statements      dollars unless otherwise noted.
looking statements or statements as to future affairs which are based
                                                                              as to future affairs based thereon. Certain data included herein has
on estimates, assumptions and expectations of PointsBet Holdings
                                                                              been obtained from alternative external sources and as such may be
Limited or its subsidiaries (collectively, the “Company”) (some or all
                                                                              inconsistent given differing underlying assumptions and sources.
of which may not be satisfied or may not occur) that, while used in
good faith, necessarily involve (i) subjective judgments; (ii) inherent       Any discrepancies between totals and sums of components in tables
uncertainties; and (iii) significant contingencies, many of which are         and figures contained in this presentation are due to rounding. Tables
beyond the Company’s control or reflect future business decisions             and figures contained in this presentation have not been amended by
which are subject to change. Any forecast or financial information            the Company to correct immaterial summation differences that may
presented in this presentation any accompanying presentation and              arise from this rounding convention.
any Other Materials must not be taken as a representation as to future
matters.

                                                                                                                                                                                                                                       2
1H 22 RESULTS PRESENTATION FEB 2022

AGENDA

HALF YEAR HIGHLIGHTS
GROUP FINANCIAL RESULTS
AUSTRALIAN BUSINESS REVIEW
US BUSINESS REVIEW
OPPORTUNITY
TECHNOLOGY
OUR PEOPLE
BUILDING BLOCKS ARE IN PLACE
Q&A
APPENDIX

1H 22 RESULTS PRESENTATION FEB 2022

     KEY OPERATIONAL HIGHLIGHTS H1’22

                                       19 AUGUST 2021
                                       ANNOUNCED AS AN
      23 JULY 2021                     APPROVED SPORTSBOOK
      LAUNCHED IGAMING                 OPERATOR BY THE                                                                                                   16 DECEMBER 2021
      IN NEW JERSEY,                   NATIONAL FOOTBALL         16 SEPTEMBER 2021                           2 NOVEMBER 2021         8 DECEMBER 2021     LAUNCH OF MOBILE
      representing the                 LEAGUE (NFL)              MAJOR PARTNER OF THE                        RECORD MELBOURNE        PARTNERSHIP         SPORTS WAGERING IN
      company’s second US              beginning with the 2021   MANLY SEA EAGLES NATIONAL                   CUP DAY BETS: 683,000   WITH UNIVERSITY     VIRGINIA -8TH STATE OF
      iGaming operation                season                    RUGBY LEAGUE (NRL) TEAM                     +BETS TAKEN             OF MARYLAND         OPERATION IN THE US

N           JUL                          AUG                       SEP                       OCT                       NOV                        DEC                         JA
21        2021                          2021                     2021                        2021                     2021                      2021                         20

                            13 AUGUST 2021     26 AUGUST 2021      16 SEPTEMBER 2021         13 OCTOBER 2021            15 NOVEMBER 2021       22 NOVEMBER 2021
                            LAUNCHED ONLINE    SUCCESSFULLY        AGREEMENT WITH            OFFICIAL AND EXCLUSIVE     FIRST BANACH           LAUNCH OF LIVE
                            SPORTS BETTING     COMPLETED           AUSTIN FC (AFC) OF        SPORTS BETTING PARTNER     UPGRADE FOR NFL        DEALER IN MICHIGAN
                            OPERATIONS         A$400M              MAJOR LEAGUE              OF CURLING CANADA          IN-PLAY, ACROSS
                            IN WEST VIRGINIA   CAPITAL RAISE       SOCCER (MLS),                                        ALL LIVE STATES
                                                                   appointing PointsBet
                                                                   as AFC’s Exclusive
                                                                   Sportsbook Partner

                                                                                                                                                                             4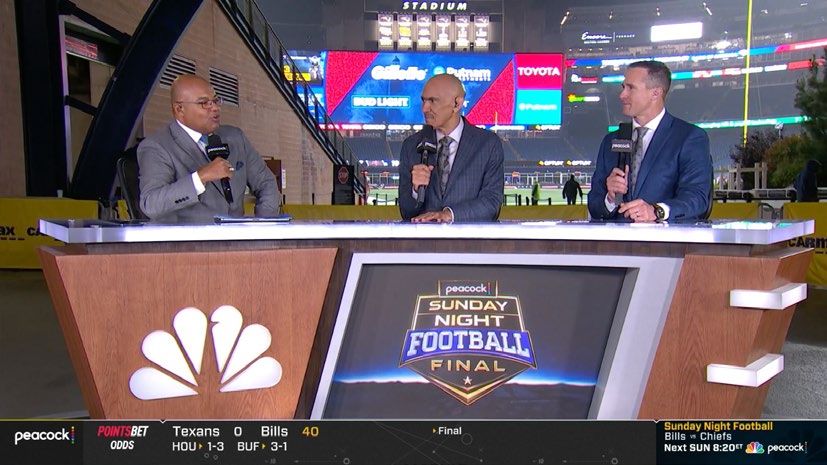
1H 22 RESULTS PRESENTATION FEB 2022

KEY OPERATIONAL HIGHLIGHTS CALENDAR YEAR TO DATE
                                                                                                                 MARCH 2022
                                                                                                                 EXPECTED LAUNCH OF
                                                                                                                 iGAMING IN PENNSYLVANIA

              11 JANUARY 2022                              27 JANUARY 2022                     4 FEBRUARY 2022                             APRIL 2022
              ANNOUNCED AS EXCLUSIVE SPORTS BETTING        LAUNCH OF IGAMING IN WEST           APPROVED AS A LICENCED                      EXPECTED LAUNCH OF SPORTS
              PARTNER OF THE NHL ALUMNI ASSOCIATION        VIRGINIA, marking the third         SPORTSBOOK IN ONTARIO,                      WAGERING AND iGAMING in
              IN CANADA AND OFFICIAL PARTNER IN THE        US State where PointsBet has        launch expected in early                    ONTARIO CANADA
              UNITED STATES                                iGaming operations                  April

NOV             DEC                        JAN                                 FEB                                MAR                            APR
2021           2021                      2022                              2022                                  2022                          2022

              20 JANUARY 2022                   25 JANUARY 2022                8 FEBRUARY 2022                              MARCH 2022
              AWARDED                           LAUNCHED ONLINE                FIRST BET IN PENNSYLVANIA,                   EXPECTED TO LAUNCH B2B
              SPORTS                            AND MOBILE SPORTS              representing the groups 10th                 SERVICES FOR RESORTSWORLD
              WAGERING AND                      BETTING OPERATIONS             online sports book operation                 BET IN NEW YORK
              IGAMING LICENCE                   IN NEW YORK.                   in the United States
              in Pennsylvania

                                                                                                                                                                5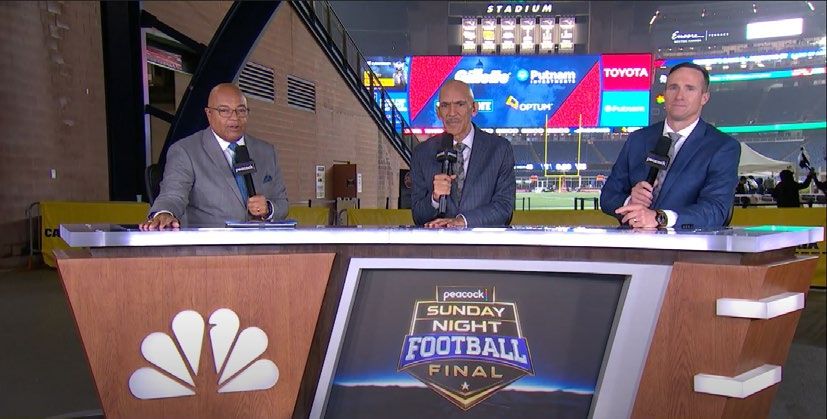
1H 22 RESULTS PRESENTATION FEB 2022

     H1 FY22
     TRADING METRICS

                                                                                                       GROUP                                                         AUSTRALIA                                                                          US1

                                       All figures in A$                                H1 FY21             H1 FY22                 PCP                      H1 FY21             H2 FY22                PCP                     H1 FY21              H2 FY22                PCP

                                       Turnover / Handle                              $1,890.0m           $2,305.9m                +22%                    $1071.0m            $1358.4m                +27%                     $819.1m             $947.5m                 +16%

                                       Gross Win %                                         8.1%                10.9%              +2.7pp                      12.7%                13.3%              +0.6pp                      2.2%                 7.5%               +5.3pp
             SPORTS
             BETTING
                                       Gross Win                                       $153.8m              $250.9m                +63%                     $136.1m              $180.1m                +32%                     $17.7m              $70.8m                +299%

                                       Net Win %                                          4.4%                 6.0%               +1.7pp                      7.9%                 7.9%               +0.0pp                     (0.2%)                3.3%               +3.5pp

                                       Net Win                                          $82.8m              $139.2m                +68%                    $84.8m               $107.9m                 +27%                   ($2.0m)               $31.3m                 n.m.

             iGAMING                   Net Win                                              —                 $7.6m                   —                          —                   —                    —                          —                $7.6m                   —

               TOTAL                   Total Net Win                                    $82.8m              $146.7m                +77%                    $84.8m               $107.9m                 +27%                   ($2.0m)               $38.8m                 n.m.

1. Average AUD / USD FX rate 0.7319 for 1H FY22 and 0.7230 for 1H FY21.

Turnover / Handle is the dollar amount wagered by clients before any winnings are paid out or losses incurred. Gross Win is the dollar amount received from clients who placed losing bets less the dollar amount paid to clients who placed winning bets, excluding the cost of
pricing promotions. Net Win is the dollar amount received from clients who placed losing bets less the dollar amount paid to clients who placed winning bets, less client promotional costs (the costs incurred to acquire and retain clients through bonus bets, money back
offers, early payouts and enhanced pricing initiatives).

                                                                                                                                                                                                                                                                                            6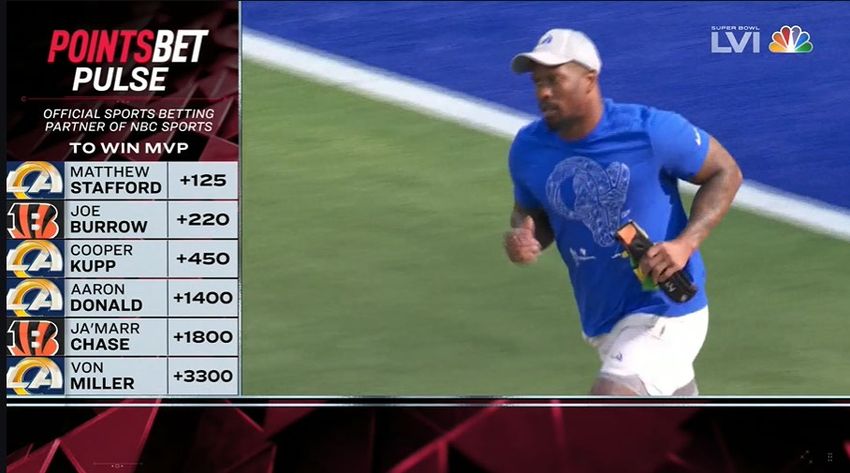
1H 22 RESULTS PRESENTATION FEB 2022

AGENDA

HALF YEAR HIGHLIGHTS
GROUP FINANCIAL RESULTS
AUSTRALIAN BUSINESS REVIEW
US BUSINESS REVIEW
OPPORTUNITY
TECHNOLOGY
OUR PEOPLE
BUILDING BLOCKS ARE IN PLACE
Q&A
APPENDIX
1H 22 RESULTS PRESENTATION FEB 2022

GROUP RESULTS
NORMALISED

                                                                                  Normalised
                                                                                                          NET REVENUE5                       US MARKETING EXPENSE
All amounts in A$m1                                                              H1 FY21       H1 FY22
                                                                                                          Net Revenue comprises Net          –A$78.2 million (US$57.2 million),
Net revenue                                                                         75.1          139.1   Win from sports betting and         an increase versus the PCP due
Cost of sales                                                                    (49.5)         (84.4)    iGaming of $146.7M adjusted         to increase number of operating
                                                                                                          for Australian goods and            jurisdictions4 quarterbacked by
Gross profit                                                                       25.6          54.7     services tax, fair value            NBC Sports
Other income2                                                                        0.4            0.1   adjustments and revenue
                                                                                                                                             –Strategy consistent with new
                                                                                                          received from B2B and ADW
                                                                                                                                              market entries, upfront
Sales and marketing expense                                                      (62.9)         (124.1)   operations.
                                                                                                                                              investment to establish market
Employee benefits expense                                                         (19.2)        (37.8)                                        share and drive revenue growth
Product and technology expense                                                     (6.0)          (9.1)   EMPLOYEE BENEFITS EXPENSE          –US marketing expense expected
                                                                                                          Expenses have increased as          to increase as footprint expands
Administrative and other expenses                                                  (7.0)         (9.8)
                                                                                                          the Group continues to build
Total operating expenses                                                          (95.1)       (180.8)    a world class team across
                                                                                                          all areas of the business.         PRODUCT AND TECHNOLOGY
EBITDA                                                                           (69.0)        (126.0)
                                                                                                          Employees as at                    EXPENSE
                                                                                                          31 December 2021 had grown to      As new state rollouts and betting
                                                                                                          539, up 65% since 31 December      volumes have increased, costs
                                                                                                          2020. Additional support staff     associated with developing,
                                                                                                          are contracted via third party     hosting, operating and securing
                                                                                                          service companies.                 its technology and data
                                                                                                                                             platforms have increased
                                                                                                                                             for the Reporting Period versus
Note:
                                                                                                          AUSTRALIAN MARKETING               the PCP.
1. Average AUD / USD FX rate 0.7319 for 1H FY22 and 0.7230 for 1H FY21;
2. Other income relates to R&D income;                                                                    EXPENSE
3. For detail on normalisation adjustments, please see slide 39;
4. As at 31-Dec-21, PointsBet was live in 8 states versus 5 states in the PCP;
                                                                                                          A$44.7 million for the Reporting
5. For reconciliation of net win to net revenue, please see slide 40.                                     Period

                                                                                                                                                                                    8
1H 22 RESULTS PRESENTATION FEB 2022

SEGMENT RESULTS
SUMMARY

Statutory Results
A$m1                                                                                                          H1 FY21               H1 FY22          Change (%)

Australia Trading                                                                                                  77.1                  97.6                       AUSTRALIA TRADING EBITDA
United States Trading                                                                                            (2.0)                   40.3                       The Company expects the Australian Trading business to
Technology                                                                                                            -                     1.2                     be EBITDA positive for FY22.
Corporate                                                                                                             -                      -                      The Company’s FY22 marketing strategy was to front-end
Statutory Revenue2                                                                                                75.1                  139.1                85%    the marketing expense in H1 22 to take advantage of the
                                                                                                                                                                    Shaquille O’Neal campaign through the Spring Racing
Australia Trading                                                                                                  8.0                  (16.1)                      Carnival.
United States Trading                                                                                          (69.2)                 (94.2)
                                                                                                                                                                    As a result, the H1 22 marketing expense was $44.7 million
Technology                                                                                                       (3.7)                  (6.8)
                                                                                                                                                                    and this has delivered significantly improved brand
Corporate                                                                                                        (6.4)                 (13.5)
                                                                                                                                                                    awareness and customer growth leading into the second
Total Statutory EBITDA                                                                                          (71.3)               (130.6)                (83%)   half which will help contribute significantly to H2 22
                                                                                                                                                                    revenue.
Loss for the year                                                                                              (85.6)                (146.4)
Basic loss per share (cps)                                                                                     (47.6)                 (59.0)                (71%)   The H2 22 marketing expense will be significantly reduced
                                                                                                                                                                    to c. $16 million for the half thus leading to an expected
Normalised Results                                                                                                                                                  EBITDA positive FY22.
A$m1                                                                                                          H1 FY21               H1 FY22          Change (%)
Revenue      2                                                                                                    75.1                  139.1                85%
                                                                                                                                                                    CANADA
Normalised EBITDA                                                                                             (69.0)                 (126.0)                (82%)
                                                                                                                                                                    Canadian operational costs have been allocated to the
Loss for the year                                                                                               (71.8)               (136.6)                (90%)
                                                                                                                                                                    Corporate segment for H1 FY22.
Basic loss per share (cps)                                                                                     (39.9)                 (55.0)

Note:
1. Average AUD / USD FX rate 0.7319 for 1H FY22 and 0.7230 for 1H FY21;
2. Revenue is measured at the fair value of the consideration received or receivable from Clients less GST, free bets, promotions, bonuses and other fair
   value adjustments, B2B revenues and ADW revenues in the US.

                                                                                                                                                                                                                                         9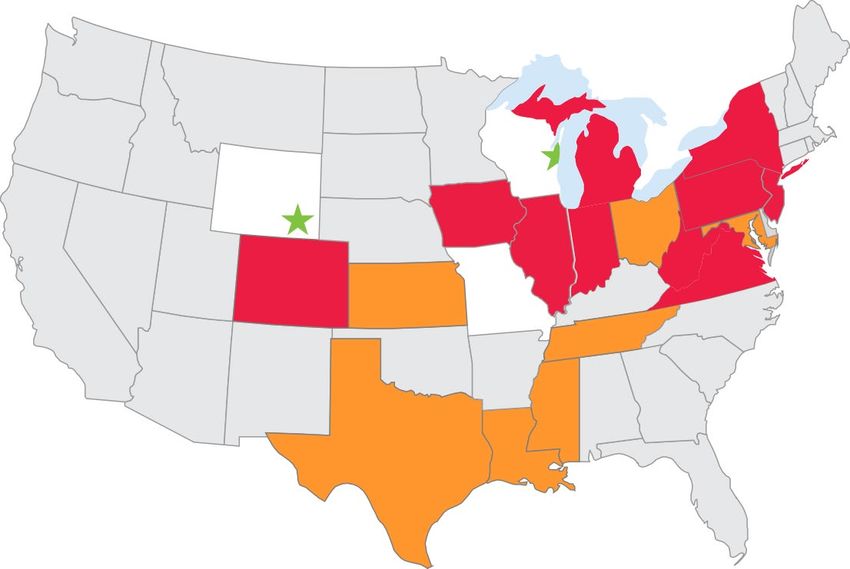
1H 22 RESULTS PRESENTATION FEB 2022

BALANCE SHEET

All amounts in A$m1                                                                                As at 30 Jun 21            As at 31 Dec 21                    CASH AND CASH EQUIVALENTS
                                                                                                                                                                 The group had $569.0 million in cash (of which $45.7 million represented client
Cash and cash equivalents                                                                                        276.2                     569.0
                                                                                                                                                                 cash), a proportion of which is held in USD. The group had no
Intangible assets                                                                                                 142.6                     188.8                borrowings.

Right-of-use assets                                                                                                   9.1                      9.4
                                                                                                                                                                 NET ASSETS
Prepayments        2
                                                                                                                  173.6                      177.4               Net asset movements are driven primarily by:
                                                                                                                                                                 – Cash received upon completion of the $400 million capital raise in
Deposits held in escrow3                                                                                             11.2                     15.4                 August 2021;
Other assets                                                                                                         11.7                      11.3              – Intangible Assets increased as a result of:
                                                                                                                                                                    1.    investment in US licenses and market access fees, in particular a
Total assets                                                                                                    624.4                       971.3
                                                                                                                                                                          US$25 million payment to the New York Gaming Commission for
Lease liabilities                                                                                                    11.6                      12.1                       market access to the State of New York; and
                                                                                                                                                                    2.    Continued investment in our betting platform through the
Trade and other payables                                                                                           39.4                       51.5                        capitalisation of product and technology employee costs and other
                                                                                                                                                                          related development costs;
Player cash accounts                                                                                               26.5                        41.1
                                                                                                                                                                 – Other liabilities also includes an amount received as a partial New York
Financial liability4                                                                                                76.1                     80.6                  licence fee reimbursement from Resorts World Bet, a subsidiary of
                                                                                                                                                                   Genting Group, during the half, as part of our B2B Platform Provider
Other liabilities                                                                                                  22.7                      43.2                  agreement to power the Resorts World Bet online sportsbook operation
                                                                                                                                                                   in New York state. This amount will be recorded as revenue on a
Total liabilities                                                                                                 176.3                    228.5
                                                                                                                                                                   straight-line basis over the life of the agreement.
Net assets                                                                                                       448.1                     742.8
                                                                                                                                                                 EQUITY
Total equity                                                                                                     448.1                     742.8                 In August 2021, the group raised $400 million through an underwritten capital
                                                                                                                                                                 raise comprising an institutional placement to raise $215 million and a 1 for 9
                                                                                                                                                                 pro rata accelerated renounceable entitlement offer with
Note:
1. End of period AUD / USD FX rate 0.7262 for 1H FY22, end of period AUD / USD FX rate for 1H FY21 was 0.7496;
                                                                                                                                                                 retail rights trading to raise $185 million.
2. Prepayments, includes prepayments for future marketing spend of $162 million. The significant majority representing an offset to the total cash marketing commitment across the five years under the NBCUniversal Media Partnership;
3. The deposits held in escrow relate primarily to marketing commitments;
4. Financial liability (non-current) relating to the fair value of the debt component of the share options issued as part of the NBCUniversal transaction. The $80.6 million includes the notional interest charged and fair value loss on the financial liability for the half-year period.

                                                                                                                                                                                                                                                                                                10
1H 22 RESULTS PRESENTATION FEB 2022
CASH FLOWS
STATUTORY
A$m1 H1 FY21 H1 FY22 – At 31 December 2021, the group had a cash balance of $569.0m,
including $45.7m of client cash and $523.3m of corporate cash.
Cash flows from operating activities
Receipts from customers (inclusive of GST) 82.7 162.8
– Total cash receipts from customers were $162.8 million, which
Payments to suppliers and employees (inclusive of GST) (152.0) (256.8) included $146.7 million from Sportsbook and iGaming. The
(69.3) (94.0) balance of $16.1 million includes cash receipts from PointsBet’s
Interest received 0.5 0.3 European B2B operations, US Advance Deposit Wagering
Interest paid on lease liabilities (0.3) (0.4) business, and a partial New York licence fee reimbursement as
Net increase in player cash accounts 20.3 15.8 part of our B2B Platform Provider agreement to power the
Net cash (outflow) from operating activities (48.8) (78.3) Resorts World Bet (subsidiary of Genting Group) online
Cash flows from investing activities sportsbook operation in New York state.
Payments for plant and equipment (3.4) (1.5)
Payments for capitalised software development (5.8) (13.4)
– Net operating outflows excluding movement in player cash
accounts was ($94.1m), whilst revenue grew inH1 FY22 vs the
Payments for market access intangible (14.3) (36.3)
PCP, cash outflows increased as a result of an increased
Rental bond - (0.2)
number of US operating jurisdictions across both US marketing
Payments for funds held in escrow (11.9) (3.8)
and technology, as well as continued to scale operational
Payments to acquire businesses (net of cash acquired) - (0.1) capabilities increasing Full Time Equivalents by 78% since 31
Net cash (outflow) from investing activities (35.4) (55.3) December 2020.
Cash flows from financing activities
Proceeds from issues of shares (net of share issue cost) 341.1 389.5 – Net investing outflows were ($55.3m) as the business continued
Option exercises 0.3 35.0 investment in US licences and market access which was largely
Repayment of leases (0.2) (1.6) represented by US$25m payment for New York market access to
Net cash inflow from financing activities 341.2 422.9 NY Gaming Commission, as well as continued investment in the
Net increase in cash and cash equivalents 257.0 289.3 development of the betting platform.
Cash and cash equivalents at the beginning of the financial year 144.3 276.2
Effects of exchange rate changes on cash and cash equivalents (13.0) 3.5 – Net financing inflows were $422.9m in line with the August 2021
Cash and cash equivalents at end of year 388.3 569.0
capital raising.
Note:
1. End of period AUD / USD FX rate 0.7262 for 1H FY22, end of period AUD / USD FX rate for 1H FY21 was 0.7496.
111H 22 RESULTS PRESENTATION FEB 2022 AGENDA HALF YEAR HIGHLIGHTS GROUP FINANCIAL RESULTS AUSTRALIAN BUSINESS REVIEW US BUSINESS REVIEW OPPORTUNITY TECHNOLOGY OUR PEOPLE BUILDING BLOCKS ARE IN PLACE Q&A APPENDIX
1H 22 RESULTS PRESENTATION FEB 2022

HIGHLIGHTS: AUSTRALIA
H1 FY22 ACHIEVEMENTS

A$1,358.4m                                     A$180.1m                                                                                 POINTSBET AUSTRALIA – PCP PERFORMANCE
                                                                                                                                        (A$)
Turnover / Handle                              Gross Win                                                                                 Key metrics                                              H1 FY21    H1 FY22      Change
UP 27% ON PCP                                  UP 32% ON PCP
                                                                                                                                         Turnover / Handle                                        $1071.0m   $1358.4m     + 27%

A$107.9m                                       13.3%                                    7.9%
                                                                                                                                         Gross Win Margin                                         12.7%      13.3%        + 0.6pp

                                                                                                                                         Gross Win                                                $136.1m    $180.1m      + 32%
Net Win                                        GROSS WIN                                NET WIN
                                                                                                                                         Net Win Margin                                           7.9%       7.9%         + 0.0pp
                                               MARGIN                                   MARGIN
A RECORD, UP 27% ON PCP
                                                                                                                                         Net Win                                                  $84.8m     $107.9m      + 27%

683,000+                                       +15%                                +63%
Melbourne Cup Day Bets                         FTB GROWTH                           CASH ACTIVE CLIENTS
A RECORD                                       VS Q2 FY21                           VS PCP, 232,875 FOR 12M
                                                                                    TO 31-DEC-21

4,000 BETS PER MINUTE
CAUFIELD CUP / EVEREST DAY (AT PEAK)
A RECORD, 2.5X HIGHER THAN PCP

                                 * Marketing expense includes all direct and indirect marketing costs, including production, agency/placement fees and working media, expensed as
                                 incurred during the period including amounts unpaid at the end of the period.
                                 Turnover / Handle is the dollar amount wagered by clients before any winnings are paid out or losses incurred. Gross Win is the dollar amount received from
                                 clients who placed losing bets less the dollar amount paid to clients who placed winning bets, excluding the cost of pricing promotions. Net Win is the dollar

                                                                                                                                                                                                                                            13
                                 amount received from clients who placed losing bets less the dollar amount paid to clients who placed winning bets, less client promotional costs (the costs
                                 incurred to acquire and retain clients through bonus bets, money back offers, early payouts and enhanced pricing initiatives). Active Clients are clients
                                 across all verticals that have placed a cash bet in the 12 months preceding the relevant period end date.
1H 22 RESULTS PRESENTATION FEB 2022
AUSTRALIA CASH ACTIVE CLIENTS1
CLIENTS WHO HAVE PLACED A CASH BET IN THE LAST TWELVE MONTHS
+63%
232,875
on PCP
222,662
142,992
31 MAR 19 30 JUN 19 30 SEP 19. 31 DEC 19 31 MAR 20 30 JUN 20 30 SEP 20 31 DEC 20 31 MAR 21 30 JUN 21 30 SEP 21 31 DEC 21
1. Clients across all verticals that have placed a cash bet in the 12 months preceding the relevant period end date.
141H 22 RESULTS PRESENTATION FEB 2022 AGENDA HALF YEAR HIGHLIGHTS GROUP FINANCIAL RESULTS AUSTRALIAN BUSINESS REVIEW US BUSINESS REVIEW OPPORTUNITY TECHNOLOGY DIVERSITY BUILDING BLOCKS ARE IN PLACE Q&A APPENDIX
1H 22 RESULTS PRESENTATION FEB 2022

HIGHLIGHTS: US
H1 FY22 ACHIEVEMENTS

A$947.5m                                                               A$70.8m
                                                                                                                                                    POINTSBET US – PCP PERFORMANCE (A$)
                                                                                                                                                    Key metrics                                                         H1 FY21                H1 FY22                Change
SPORTS BETTING                                                         SPORTS BETTING                                                               Sports Betting Turnover / Handle                                    $819.1m                $947.5m                + 16%

Turnover / Handle                                                      Gross Win                                                                    Sports Betting Gross Win Margin                                     2.2%                   7.5%                   + 5.3pp

UP 16% ON PCP                                                          UP 299% ON PCP                                                               Sports Betting Gross Win                                            $17.7m                 $70.8m                 + 299%

                                                                                                                                                    Sports Betting Net Win Margin                                       (0.2%)                 3.3%                   + 3.5pp

A$38.8m                                                                7.5%                                   3.3%                                  Sports Betting Net Win                                              ($2.0m)                $31.3m                     n.m

Total Net Win
                                                                                                                                                    iGaming Net Win                                                     –                      $7.6m                  -
                                                                       SPORTS BETTING                         SPORTS BETTING
                                                                       GROSS WIN                              NET WIN                               Total Net Win                                                       ($2.0m)                $38.8m                 n.m
                                                                       MARGIN                                 MARGIN

SPORTS BETTING ONLINE HANDLE MARKET SHARE
Q2’22
 Blended online handle               Illinois      Michigan        Colorado           New           Indiana           Iowa           West
 market share                                                                        Jersey                                         Virginia

 4.2%8                                 7.1%2          5.1%3          3.8%5           3.1%1           2.8%4           2.3%6            1.4%7

1. Based on total New Jersey online sports betting handle for Q2FY22, as reported by the New Jersey Division of Gaming Enforcement. 2. Based on
total Illinois online sports betting handle for Q2FY22 as reported by the Illinois Gaming Board. 3. Based on total Michigan online sports betting
handle for Q2FY22, as reported by the Michigan Gaming Control Board. 4. Based on total Indiana online sports betting for Q2FY22, as reported by
the Indiana Gaming Commission. 5. Based on total Colorado online sports betting handle for Q2FY22, as reported by the Colorado Department
of Revenue – Division of Gaming. 6. Based on total Iowa online sports betting handle for Q2FY22, as reported by the Iowa Racing and Gaming
Commission. 7. Based on total West Virginia online sports betting handle for Q2FY22, as reported by the West Virginia Lottery. 8. Blended online
handle market share is the sum of PBH online handle divided by sum of active states online handle for Q2FY22. Excludes Virginia which launched
on 15 December 2021.

                                                                                                                                                    Turnover / Handle is the dollar amount wagered by clients before any winnings are paid out or losses incurred. Gross Win
                                                                                                                                                    is the dollar amount received from clients who placed losing bets less the dollar amount paid to clients who placed
                                                                                                                                                    winning bets, excluding the cost of pricing promotions. Net Win is the dollar amount received from clients who placed
                                                                                                                                                    losing bets less the dollar amount paid to clients who placed winning bets, less client promotional costs (the costs
                                                                                                                                                    incurred to acquire and retain clients through bonus bets, money back offers, early payouts and enhanced pricing
                                                                                                                                                    initiatives). Active Clients are clients across all verticals that have placed a cash bet in the 12 months preceding the     16
                                                                                                                                                    relevant period end date.
1H 22 RESULTS PRESENTATION FEB 2022
HIGHLIGHTS: US
H1 FY22 HIGHLIGHTS
Launched sports wagering Will be one of only 6 operators
operations in West Virginia, with Tri-State coverage in
Virginia, New York and New York, New Jersey and
Pennsylvania in August, Pennsylvania
December, January and February
respectively
ENHANCEMENT OF PROPRIETARY
PRODUCT
Launched iGaming operations in
New Jersey and West Virginia in Banach NFL in-play upgrade, led to
July and January respectively a 44% increase in NFL in-play
handle
Authorised National Football Live Dealer iGaming successful launched
League (NFL) partner, 1 of 7 in Michigan and New Jersey
operators authorized to advertise
during NFL games
CASH ACTIVE CLIENTS
Cash active clients for the 12 months to
31 December 2021 211,113 +210% vs PCP
Net Win is the dollar amount received from clients who placed losing bets less the dollar amount paid to clients who placed winning bets, less client promotional costs (the costs incurred
to acquire and retain clients through bonus bets, money back offers, early payouts and enhanced pricing initiatives). Active Clients are clients across all verticals that have placed a cash
bet in the 12 months preceding the relevant period end date.
171H 22 RESULTS PRESENTATION FEB 2022
US CASH ACTIVE CLIENTS1
CLIENTS WHO HAVE PLACED A CASH BET IN THE LAST TWELVE MONTHS
+210%
211,113
on PCP
185,880
68,094
31 MAR 19 30 JUN 19 30 SEP 19 31 DEC 19 31 MAR 20 30 JUN 20 30 SEP 20 31 DEC 20 31 MAR 21 30 JUN 21 30 SEP 21 31 DEC 21
1. Clients across all verticals that have placed a cash bet in the 12 months preceding the relevant period end date.
181H 22 RESULTS PRESENTATION FEB 2022
KEY US PARTNERSHIPS
NBC/NFL Partnerships
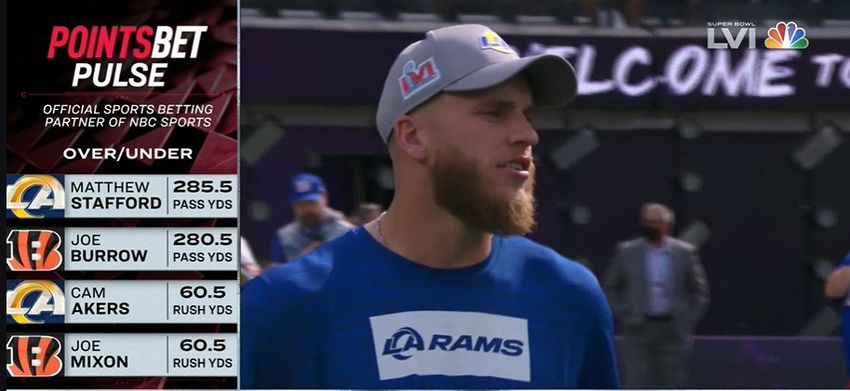
NFL Marketing Strategy Leading Integrations
AUTHORISED NFL PARTNER: – In-game commercial units throughout
the season featuring NFL legend Drew
– PointsBet and NBC developed the first
ever sports betting integration inside
1 OF 7 OPERATORS PERMITTED TO Brees Football Night in America, the number one
ADVERTISE DURING NFL GAMES – National and local betting integrations studio show in the United States
throughout various pregame shows – “PointsBet Pulse” was led by
including FNIA ambassadors Drew Brees and Chris
Simms, and featured PointsBet betting
– Dynamic Digital approach inclusive of markets and analysis
video, podcasts and emails ensured
we reach our audience in the lead up – The segment concludes by driving
to NFL action viewers to our app, promoting
immediacy ahead of game-time.
Leading integrations NBC Free to play App
BUCCANEERS-PATRIOTS SUNDAY NIGHT FOOTBALL (3 OCTOBER)
GAME AVERAGED 28.5M VIEWS INCLUDING STREAMING POINTSBET IS POINTSBET HAS
POINTSBET PULSE FOOTBALL NIGHT IN AMERICA ON FULLY INTEGRATED EXCLUSIVE CONTENT AND
SUNDAY NIGHT FOOTBALL INTO NBC'S FTP APP, ADVERTISING RIGHTS TO
PREDICTOR THE PREDICTOR APP
610,000
POWERED BY
LEADS GENERATED FOR POINTSBET*
* Across all US states as at 31 December 2021
191H 22 RESULTS PRESENTATION FEB 2022
SUPER BOWL LVI
Super Bowl LV Comp 1 Comp 2 Comp 3 Comp 4 Comp 5 Comp 6
RECORD ACTIVITY
Overall
Offered the most in-play and game day markets on
Game Day 932 719 707 512 426 397 298
Super Bowl LVI 1 markets
First ever sports betting integration into Super Bowl In-Play
programming, including Pre-Game Segments and markets 312 261 110 92 92 53 36
NBC Ticker Integration, with viewership in the tens of
millions
On average across all PBH states - 99.9% of bets
placed within target of 1 second, ~90% within 250
milliseconds
Live In-Play NFL Same Game Parlay launched as the
only product of its kind
12x 2020
performance
1 As measured for New Jersey , includes spread markets for overall.
201H 22 RESULTS PRESENTATION FEB 2022 AGENDA HALF YEAR HIGHLIGHTS GROUP FINANCIAL RESULTS AUSTRALIAN BUSINESS REVIEW US BUSINESS REVIEW OPPORTUNITY TECHNOLOGY OUR PEOPLE BUILDING BLOCKS ARE IN PLACE Q&A APPENDIX
1H 22 RESULTS PRESENTATION FEB 2022
US MARKET ACCESS, NEAR-TERM LAUNCHES AND
STRATEGIC PARTNERSHIPS
Maine
Washington Vermont
New
North Dakota
Montana Minnesota Hampshire
Massachusetts
Oregon
New York
Wisconsin Rhode Island
DECEMBER 2021 JANUARY 2022 EXPECTED TO LAUNCH
Idaho South Dakota Connecticut
Michigan
Wyoming2
Pennsylvania New Jersey
FEBRUARY 2022
Iowa
LAUNCHED IN LAUNCHED
PENNSYLVANIA TO
Nebraska Ohio Delaware
NEW YORK
Nevada
VIRGINIA
Indiana
Illinois
Maryland
LAUNCH INCLUDING
West
ONE OF ONLY
Utah
Virginia Virginia
Colorado
9 LICENSED iGAMING
Kansas Missouri
California Kentucky
OPERATORS
North Carolina
Tennessee 2
Oklahoma Arkansas South
Arizona Carolina
New Mexico
Georgia
Mississippi Alabama
Texas4
Louisiana
Florida
Live operations Market access partner States in which the PointsBet’s North American
secured or expected to be Company is assessing Offices
untethered market access opportunities
221H 22 RESULTS PRESENTATION FEB 2022
US & CANADA INCREASING TAM
ADULT POPULATION IN PBH US/CANADA ROADMAP1
160M NORTH AMERICA GGR
2033 TOTAL ADDRESSABLE MARKET
140M
120M
100M
US$18b
iGAMING
80M
60M
40M
US$70b2
OPPORTUNITY
20M
US$10b US$42b
HORSE RACING SPORTS
0
10 LIVE ON 7 MORE END OF
STATES 2022
1. Based on 18+ population in relevant jurisdictions; 2. 2033 sports wagering revenue and iGaming revenue projections
as per Goldman Sachs Global Investment Research dated 17 October 2021.
231H 22 RESULTS PRESENTATION FEB 2022 AGENDA HALF YEAR HIGHLIGHTS GROUP FINANCIAL RESULTS AUSTRALIAN BUSINESS REVIEW US BUSINESS REVIEW OPPORTUNITY TECHNOLOGY OUR PEOPLE BUILDING BLOCKS ARE IN PLACE Q&A APPENDIX
1H 22 RESULTS PRESENTATION FEB 2022
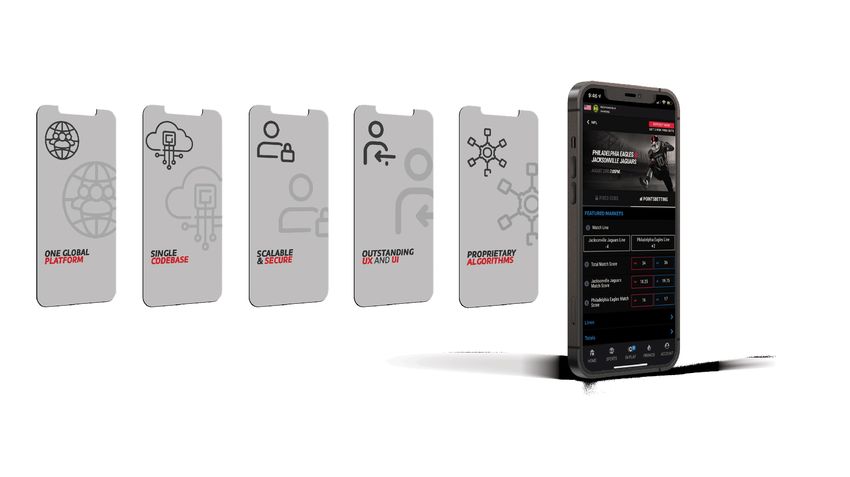
CONTINUED INVESTMENT IN
PRODUCT AND TECHNOLOGY
Delivering
in-play
excellence
and key
product
features
Same Game Parlay,
Name-A-Bet,
PointsBetting, Vision,
Personalisation and
iGaming
– One Global Team – Loosely couple – Proven during peak – Fast, easy to use – 99%+ of bets
and Platform architecture days – Maximum efficiency automatically
delivering – No Monoliths – Melbourne Cup accepted
• Registratio
maximum – Single Code Base – Superbowl • n
KYC – Auto resulting and
synergies – 100% cloud native • Depositing promotional
– Microservices • Withdrawal – Fulfilment
– Extensible
251H 22 RESULTS PRESENTATION FEB 2022
POINTSBET RANKS SECOND IN EILERS & KREJCIK’S APP-BY-APP TESTING
OVERALL APP 100% OWNED
RANK TECH STACK? Overall Rank
1
2nd/34
UNLIKE SPORTSBOOKS
2 / 34 MANY OF
ITS PEERS,
POINTSBET
3 OWNS AND Methodology
CONTROLS
4
ITS OWN Eilers & Krejcik, an independent US research firm, tested 34 US sportsbetting apps in
TECH 4Q21, using a proprietary matrix consisting of the following categories:
1
STACK
5
1. USER EXPERIENCE - app navigation and speed
6 2. BETTING INTERFACE - ease of finding, placing and checking bets
7 3. FEATURES - cash out, live streaming and data visualisation
4. CORE - sign-up, deposits and withdrawals
8
5. AESTHETICS - clean and visually appealing
9
“POINTSBET CRASHES THE PODIUM. PointsBet took second place in our 4Q21
10 testing-its bets-ever ranking. Aesthetics and Core were relatively static scores for
PointsBet, but it reaped the rewards of a well regarded suite of features and some
Source: Eilers & Krejcik, Product Analysis: Testing, Scoring, And Ranking U.S. Sports Betting Apps report, Feb-22 minor improvements in UX and Betting Interface scores. PointsBet’s Features
category performance is especially noteworthy, where it had the second-largest
score increase (+29% vs. 3Q21) among the top 10”
Source: Eilers & Krejcik, Product Analysis: Testing, Scoring, And Ranking U.S. Sports Betting Apps report, Feb-22 26
1. BetMGM rely on Entain’s technology stack.1H 22 RESULTS PRESENTATION FEB 2022
NFL IN-PLAY IMPROVEMENTS
POST BANACH UPGRADE
BETTING EXPERIENCE
+ PRODUCT EXPANSION
= RESULTS
100%
40% 1
4x 1 Industry first in-play uptime
REDUCTION BETTING During NBC's Saturday Playoff Game on
INCREASE IN
January 15th, our customers experienced
44
SUSPENSIONS BETTING MARKETS
100% uptime and no suspensions on in-
50% 1 42% 1
game spread and moneyline bets, which WE
BELIEVE TO BE THE FIRST EVER RESULT OF THIS
KIND IN THE U.S
REDUCTION ENGAGEMENT INCREASE INCREASE INPLAY
REJECTED BETS ON NON CORE MARKETS HANDLE2
+ PLAYER PROPS Launch of
In-Play Same
Game Parlay
+ SAME GAME PARLAY in January
Industry first 2022
for NFL and NBA
+ IMPROVED CASH OUT
This is the FIRST LAUNCH OF THIS
PRODUCT TYPE BY A US SPORTS
1. Compares Weeks 1-9 of NFL 21/22 season (pre Banach upgrade) to weeks 10-18 of NFL 21/22 season (post Banach upgrade); WAGERING OPERATOR
2. Compares Weeks 1-9 of NFL 21/22 season (pre Banach upgrade) to weeks 10-18 of NFL 21/22 season (post Banach upgrade) relative to total NFL handle in respective periods.
271H 22 RESULTS PRESENTATION FEB 2022 AGENDA HALF YEAR HIGHLIGHTS GROUP FINANCIAL RESULTS AUSTRALIAN BUSINESS REVIEW US BUSINESS REVIEW OPPORTUNITY TECHNOLOGY OUR PEOPLE BUILDING BLOCKS ARE IN PLACE Q&A APPENDIX
1H 22 RESULTS PRESENTATION FEB 2022

OUR PEOPLE

POINTSBET INITIATIVES THIS HALF INCLUDE:
1.   Focus on Diversity, Equity and Inclusion (DEI), and Employee Wellness                     3. Employee Wellness has remained incredibly important during the
     program                                                                                      challenges of COVID, we have:
2. Within DEI we have:                                                                               – Launched a new Employee Assistance Program with a range of
                                                                                                       wellbeing solutions; and
      –   Hired a Head DEI;
                                                                                                     – Provided our people with more flexibility as we moved to a Hybrid
      –   Established a Committee of experts;
                                                                                                       workplace
      –   Joined ‘Women in Sports Tech’; and
      –   Worked towards increasing the number of women at PointsBet                           4. We know that investing in our people and building an outstanding team is
                                                                                                  a competitive advantage and will help us deliver on our objectives

     Diversity, Equity & Inclusion                          LEARNING                                                  WELLNESS
     – Established a ‘DEI Committee’ (Diversity, Equity &   – Continued focus on compliance training including        – Launched a new EAP (Employee Assistance
       Inclusion)                                             Anti-Money Laundering and Cybersecurity                   Program) and MindFit App in Australia, with
                                                            – Supporting the prevention of Sexual Harassment            heightened focus on Mental Health and Wellbeing
     – Engaged a Vice President of DEI to lead
       sustainable change                                     and increased Responsible Gambling awareness            – Continued support of employees through Covid
     – Joined ‘Women in Tech’ (WiST) in the US              – Continued investment in technology capability             lockdowns and Return to Work safety measures
                                                              development                                               globally
     – Increased global female participation from 15% to
       18% during 2021

     PERFORMANCE                                            ENGAGEMENT                                                COMMUNITY
     – Improved performance and talent management           – The Global Acquisition and Matching Equity              – Created a global ‘Sustainability Committee’ to
       processes were implemented including                   (GAME) Plan was launched in September 2021,               drive CSR strategy and initiatives
       360-degree reviews, performance reviews, and           allowing employees to participate in the growth         – Increased focus on supporting local charities and
       succession planning                                    of the Company through the purchase and                   community groups including Lifeblood
                                                              matching of shares

                                                                                                                                                                                       29
1H 22 RESULTS PRESENTATION FEB 2022
AGENDA
HALF YEAR HIGHLIGHTS
GROUP FINANCIAL RESULTS
AUSTRALIAN BUSINESS REVIEW
US BUSINESS REVIEW
OPPORTUNITY
TECHNOLOGY
OUR PEOPLE
BUILDING BLOCKS ARE IN PLACE
Q&A
APPENDIX
301H 22 RESULTS PRESENTATION FEB 2022
POINTSBET HAS THE BUILDING BLOCKS IN PLACE TO BE A MARKET LEADER
MARQUEE MEDIA PARTNERSHIP LEADING BRAND AMBASSADORS
LAUNCHED
IGAMING
PRODUCT
MICHIGAN,
NEW JERSEY IN-HOUSE PREMIUM
AND WEST
VIRGINIA MARKET-LEADING STRATEGIC
PARTNERSHIPS
TECHNOLOGY STACK
$523.3M
PROFITABLE AUSTRALIAN BUSINESS CASH
COUPLED WITH GROWING U.S. BUSINESS BALANCE (3)
NORTH AMERICAN MARKET
MARKET-LEADING EXECUTION TEAM
539 EMPLOYEES GLOBALLY(4) ACCESS – OPERATIONAL IN 10
US STATES1 / 72M+ POP1
1. Plus Ontario Canada;
31
2. Estimate of persons 18+, excludes Ontario Canada;
3. Corporate cash as at 31-Dec-21;
4. As at 31-Dec-21. The Company also utilises the services of third-party service operators.1H 22 RESULTS PRESENTATION FEB 2022
APPENDIX
AGENDA
HALF YEAR HIGHLIGHTS
GROUP FINANCIAL RESULTS
AUSTRALIAN BUSINESS REVIEW
US BUSINESS REVIEW
OPPORTUNITY
TECHNOLOGY
OUR PEOPLE
BUILDING BLOCKS ARE IN PLACE
Q&A
APPENDIX
321H 22 RESULTS PRESENTATION FEB 2022 AGENDA APPENDIX HALF YEAR HIGHLIGHTS GROUP FINANCIAL RESULTS AUSTRALIAN BUSINESS REVIEW US BUSINESS REVIEW OPPORTUNITY TECHNOLOGY OUR PEOPLE BUILDING BLOCKS ARE IN PLACE Q&A APPENDIX
1H 22 RESULTS PRESENTATION FEB 2022

STATUTORY P&L

A$m1                                                                                                       H1 FY21                  H1 FY22

Revenue2                                                                                                         75.1                    139.1

Cost of sales                                                                                                 (49.5)                   (84.4)

Gross profit                                                                                                    25.6                     54.7

Other income                                                                                                      0.4                      0.2

Sales and marketing expense                                                                                   (62.9)                   (124.1)

Employee benefits expense                                                                                     (22.6)                   (44.2)

Product and technology expense                                                                                 (6.0)                     (7.9)

Administration and other expenses                                                                              (5.8)                     (9.3)

Total operating expenses                                                                                      (97.3)                 (185.5)

EBITDA                                                                                                        (71.3)                 (130.6)

Net finance costs                                                                                              (0.4)                     (4.5)

Net foreign exchanges gains/(losses)                                                                           (9.6)                        1.6

Depreciation and amortisation expense                                                                          (4.3)                    (12.9)

Loss for the year after tax                                                                                  (85.6)                  (146.4)

Note:
1. Average AUD / USD FX rate 0.7319 for 1H FY22;
2 Revenue is measured at the fair value of the consideration received or receivable from Clients less GST, free bets, promotions, bonuses and
   other fair value adjustments, B2B revenues and ADW revenues in the US.

                                                                                                                                                                                34
1H 22 RESULTS PRESENTATION FEB 2022
RECONCILIATION TO STATUTORY P&L
A$m1 H1 FY22 Adjustments H1 FY22 A$m1 H1 FY222
Normalised Statutory
Revenue3 139.1 - 139.1 Interest on financial liability 2.9
Cost of sales (84.4) - (84.4) Fair value loss on financial liability 1.6
Gross profit 54.7 - 54.7 Share based payments (non-cash) – employee share option plan
5.3
(ESOP) and Key Employee Equity Plan (KEEP)
Other income 0.1 - 0.2
Impact of AASB 16 Leases 0.2
Sales and marketing expense (124.1) - (124.1) Net foreign exchange losses (1.6)
Employee benefits expense (37.8) (6.3) (44.2) Start-up costs for Canadian operation 1.4
Product and technology expense (9.1) 1.2 (7.9) Total significant items and adjustments 9.8
Administration and other expenses (9.8) 0.5 (9.3)
Total operating expenses (180.8) (4.6) (185.5)
EBITDA (126.0) (4.6) (130.6)
Net finance costs 0.4 (4.9) (4.5)
Net foreign exchange gains / (losses) - 1.6 1.6
Depreciation and amortisation expense (11.0) (1.9) (12.9)
Loss for the year after tax (136.6) (9.8) (146.4)
Note:
1. Average AUD / USD FX rate 0.7319 for 1H FY22;
2. An individual significant adjustment may impact multiple P&L line items;
3. Revenue is measured at the fair value of the consideration received or receivable from Clients less GST, free bets, promotions, bonuses and other fair value adjustments,
B2B revenues and ADW revenues in the US.
351H 22 RESULTS PRESENTATION FEB 2022
RECONCILIATION OF NET WIN TO NET REVENUE
A$m1 H1 FY22
Net Win (inclusive of Goods and Services Tax) 146.7
Deduction for Goods and Services Tax (9.8)
Fair Value adjustments and B2B / ADW revenue streams 2.2
Total Reported Revenue 139.1
Note:
1. Average AUD / USD FX rate 0.7319 for 1H FY22.
36You can also read