Gulf coast energy outlook 2022 - David E. Dismukes | Gregory B. Upton, Jr - Louisiana State University
←
→
Page content transcription
If your browser does not render page correctly, please read the page content below

gulf coast
energy outlook
2022

             David E. Dismukes | Gregory B. Upton, Jr.
2022 Gulf Coast Energy Outlook
                                David E. Dismukes – LSU Center for Energy Studies
                                Gregory B. Upton, Jr. – LSU Center for Energy Studies
                                Release Date: Fall 2021

Acknowledgments
The Gulf Coast Energy Outlook (GCEO) would not have been possible without the help of many
who contributed both time and financial resources. First, the input from dozens of industrial, govern-
mental, civic, and trade organizations that requested having the last year’s GCEO presented to their
organizations is much appreciated. The feedback that was provided during these conferences and
individual meetings was instrumental in preparing the current report. While “crunching the numbers”
is an important aspect of any forecasting process, the input provided by stakeholders who have an
“on-the-ground” view of what is occurring in real time is equally valuable.
Special thanks are owed to Marybeth Pinsonneault and Ric Pincomb (Center for Energy Studies) and
Stephen Radcliffe (E. J. Ourso College of Business), for their media, editorial, and production exper-
tise. Sid Narra also contributed to data collection and analysis included in this report.
Last, but certainly not least, a special thanks and appreciation is extended to our sponsors. We know
this has been a difficult two years across all facets of the energy sector, so we are extremely grate-
ful for this financial support:
    > Platinum: Louisiana Mid-Continent Oil & Gas Association (LMOGA) and Phillips 66
    > Silver: Entergy, Enverus, Koch, Louisiana Chemical Association (LCA), and
      Louisiana Oil & Gas Association (LOGA)
    > Bronze: American Electric Power / Southwestern Electric Power Company (AEP/SWEPCO),
      Louisiana Department of Natural Resources (LDNR), and TJC Group
    > Contributor: Fugro, LLOG, and LLOX

LSU Center for Energy Studies                                                                        1
Table of Contents
1. Introduction. . . . . . . . . . . . . . . . . . . . . . . . . . . . . . . . . . . . . . . . . . . . . . . . . . . . . . . . . . . . . . 5
1.1 Recovering from COVID-19. . . . . . . . . . . . . . . . . . . . . . . . . . . . . . . . . . . . . . . . . . 5
1.2 Decarbonization Policies. . . . . . . . . . . . . . . . . . . . . . . . . . . . . . . . . . . . . . . . . . . . 6
1.3 The Future of Offshore Leasing . . . . . . . . . . . . . . . . . . . . . . . . . . . . . . . . . . . . . 7
1.4 Hurricane Ida. . . . . . . . . . . . . . . . . . . . . . . . . . . . . . . . . . . . . . . . . . . . . . . . . . . . . . 8
1.5 Another Round of Trade Negotiations?. . . . . . . . . . . . . . . . . . . . . . . . . . . . . . . . 8
2. Crude Oil and Natural Gas Production and Prices. . . . . . . . . . . . . . . . . . . . . . . . . . . . . . 10
2.1 Recent Market Trends: Production . . . . . . . . . . . . . . . . . . . . . . . . . . . . . . . . . . . 10
2.2 Recent Trends: Commodity Pricing. . . . . . . . . . . . . . . . . . . . . . . . . . . . . . . . . . . 14
2.3 Outlook: Commodity Pricing. . . . . . . . . . . . . . . . . . . . . . . . . . . . . . . . . . . . . . . . . 16
2.4 Outlook: Crude Oil and Natural Gas Production. . . . . . . . . . . . . . . . . . . . . . . . 18
3. Midstream Constraints and Pipeline Activity. . . . . . . . . . . . . . . . . . . . . . . . . . . . . . . . . . 21
4. Power Sector. . . . . . . . . . . . . . . . . . . . . . . . . . . . . . . . . . . . . . . . . . . . . . . . . . . . . . . . . . . . . 25
4.1 Recent Trends: Load Growth . . . . . . . . . . . . . . . . . . . . . . . . . . . . . . . . . . . . . . . . 25
4.2 Recent Trends: Carbon Emissions. . . . . . . . . . . . . . . . . . . . . . . . . . . . . . . . . . . . 26
4.3 Outlook: Capacity Investment . . . . . . . . . . . . . . . . . . . . . . . . . . . . . . . . . . . . . . . 27
5. Energy Manufacturing Activity. . . . . . . . . . . . . . . . . . . . . . . . . . . . . . . . . . . . . . . . . . . . . . 29
5.1 Energy Manufacturing Recent Trends. . . . . . . . . . . . . . . . . . . . . . . . . . . . . . . . . 29
5.2 Energy Manufacturing Outlook . . . . . . . . . . . . . . . . . . . . . . . . . . . . . . . . . . . . . . 30
6. Energy Exports. . . . . . . . . . . . . . . . . . . . . . . . . . . . . . . . . . . . . . . . . . . . . . . . . . . . . . . . . . . 32
6.1 Recent Trends: Refined Product Exports . . . . . . . . . . . . . . . . . . . . . . . . . . . . . . 32
6.2 Recent Trends: Crude Oil Exports. . . . . . . . . . . . . . . . . . . . . . . . . . . . . . . . . . . . 37
6.3 Recent Trends: LNG Exports. . . . . . . . . . . . . . . . . . . . . . . . . . . . . . . . . . . . . . . . . 37
6.4 Outlook: Refined Product Exports. . . . . . . . . . . . . . . . . . . . . . . . . . . . . . . . . . . . 39
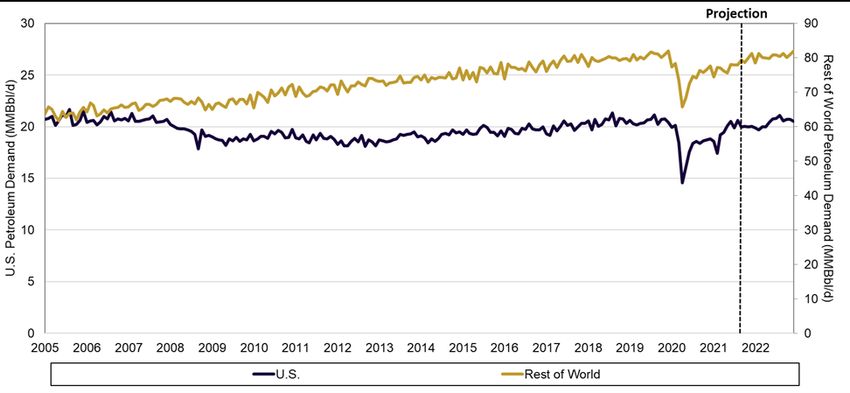
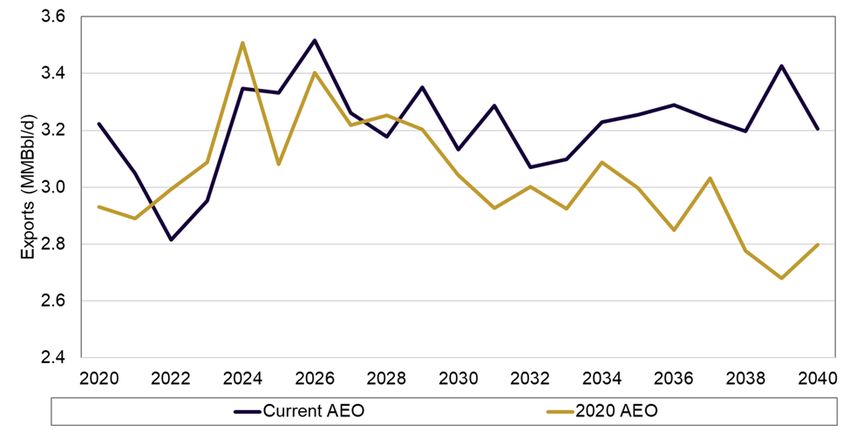
6.5 Outlook: Crude Oil Exports. . . . . . . . . . . . . . . . . . . . . . . . . . . . . . . . . . . . . . . . . . 40
6.6 Outlook: LNG Exports . . . . . . . . . . . . . . . . . . . . . . . . . . . . . . . . . . . . . . . . . . . . . . 41
7. COVID Impacts on Domestic Energy Demand . . . . . . . . . . . . . . . . . . . . . . . . . . . . . . . . . 43
8. Employment Outlook. . . . . . . . . . . . . . . . . . . . . . . . . . . . . . . . . . . . . . . . . . . . . . . . . . . . . . 44
8.1 Employment Forecasts . . . . . . . . . . . . . . . . . . . . . . . . . . . . . . . . . . . . . . . . . . . . . 44
Conclusions. . . . . . . . . . . . . . . . . . . . . . . . . . . . . . . . . . . . . . . . . . . . . . . . . . . . . . . . . . . . . . . . 49
2 Gulf Coast Energy Outlook 2022
List of Figures
Figure 1: U.S. crude oil and natural gas production . . . . . . . . . . . . . . . . . . . . . . . . . . . . . . . . . . . . . . . . . . . . . . . . 10
Figure 2: U.S. crude oil prices and rig count . . . . . . . . . . . . . . . . . . . . . . . . . . . . . . . . . . . . . . . . . . . . . . . . . . . . . . 12
Figure 3: Rig counts in major shale basins. . . . . . . . . . . . . . . . . . . . . . . . . . . . . . . . . . . . . . . . . . . . . . . . . . . . . . . . 13
Figure 4: PADD 3 crude oil and natural gas production. . . . . . . . . . . . . . . . . . . . . . . . . . . . . . . . . . . . . . . . . . . . . 14
Figure 5: Historical inflation-adjusted natural gas price. . . . . . . . . . . . . . . . . . . . . . . . . . . . . . . . . . . . . . . . . . . . 15
Figure 6: Historical inflation-adjusted oil prices . . . . . . . . . . . . . . . . . . . . . . . . . . . . . . . . . . . . . . . . . . . . . . . . . . . 16
Figure 7: Crude oil price outlook. . . . . . . . . . . . . . . . . . . . . . . . . . . . . . . . . . . . . . . . . . . . . . . . . . . . . . . . . . . . . . . . 17
Figure 8: Natural gas price outlook. . . . . . . . . . . . . . . . . . . . . . . . . . . . . . . . . . . . . . . . . . . . . . . . . . . . . . . . . . . . . . 18
Figure 9: Gulf Coast oil production forecast . . . . . . . . . . . . . . . . . . . . . . . . . . . . . . . . . . . . . . . . . . . . . . . . . . . . . . 19
Figure 10: Gulf Coast natural gas production forecast . . . . . . . . . . . . . . . . . . . . . . . . . . . . . . . . . . . . . . . . . . . . . 20
Figure 11: PADD 3 crude oil movements by transportation type. . . . . . . . . . . . . . . . . . . . . . . . . . . . . . . . . . . . . . 22
Figure 12: Henry Hub and Waha natural gas prices. . . . . . . . . . . . . . . . . . . . . . . . . . . . . . . . . . . . . . . . . . . . . . . . 23
Figure 13: U.S. and Gulf Coast electricity sales . . . . . . . . . . . . . . . . . . . . . . . . . . . . . . . . . . . . . . . . . . . . . . . . . . . . 25
Figure 14: U.S. and Gulf Coast industrial electricity sales . . . . . . . . . . . . . . . . . . . . . . . . . . . . . . . . . . . . . . . . . . . 26
Figure 15: U.S. and Gulf Coast carbon dioxide emissions from electricity generation . . . . . . . . . . . . . . . . . . . 27
Figure 16: Gulf Coast power generation capacity and outlook. . . . . . . . . . . . . . . . . . . . . . . . . . . . . . . . . . . . . . . 28
Figure 17: GOM energy manufacturing investments by state. . . . . . . . . . . . . . . . . . . . . . . . . . . . . . . . . . . . . . . . 29
Figure 18: GOM energy manufacturing investments by sector. . . . . . . . . . . . . . . . . . . . . . . . . . . . . . . . . . . . . . . 30
Figure 19: Number and capacity of U.S. refineries . . . . . . . . . . . . . . . . . . . . . . . . . . . . . . . . . . . . . . . . . . . . . . . . . 32
Figure 20: PADD 3 annual refining capacity and utilization . . . . . . . . . . . . . . . . . . . . . . . . . . . . . . . . . . . . . . . . . 33
Figure 21: U.S. and PADD 3 monthly refining utilization . . . . . . . . . . . . . . . . . . . . . . . . . . . . . . . . . . . . . . . . . . . . 34
Figure 22: PADD 3 annual petroleum product supplied . . . . . . . . . . . . . . . . . . . . . . . . . . . . . . . . . . . . . . . . . . . . 34
Figure 23: PADD 3 monthly petroleum product supplied . . . . . . . . . . . . . . . . . . . . . . . . . . . . . . . . . . . . . . . . . . . 35
Figure 24: U.S. annual petroleum product imports and exports. . . . . . . . . . . . . . . . . . . . . . . . . . . . . . . . . . . . . . 36
Figure 25: U.S. monthly petroleum product imports and exports. . . . . . . . . . . . . . . . . . . . . . . . . . . . . . . . . . . . 36
Figure 26: U.S. crude oil exports and imports. . . . . . . . . . . . . . . . . . . . . . . . . . . . . . . . . . . . . . . . . . . . . . . . . . . . . 37
Figure 27: U.S. liquified natural gas exports . . . . . . . . . . . . . . . . . . . . . . . . . . . . . . . . . . . . . . . . . . . . . . . . . . . . . . 38
Figure 28: Gulf Coast energy exports to China. . . . . . . . . . . . . . . . . . . . . . . . . . . . . . . . . . . . . . . . . . . . . . . . . . . . 39
Figure 29: Domestic and world petroleum demand outlook. . . . . . . . . . . . . . . . . . . . . . . . . . . . . . . . . . . . . . . . . 40
Figure 30: U.S. crude oil exports. . . . . . . . . . . . . . . . . . . . . . . . . . . . . . . . . . . . . . . . . . . . . . . . . . . . . . . . . . . . . . . . 41
Figure 31: U.S. LNG exports . . . . . . . . . . . . . . . . . . . . . . . . . . . . . . . . . . . . . . . . . . . . . . . . . . . . . . . . . . . . . . . . . . . . 42
Figure 32: Energy demand and U.S. employment . . . . . . . . . . . . . . . . . . . . . . . . . . . . . . . . . . . . . . . . . . . . . . . . . 43
Figure 33. Louisiana upstream employment forecast . . . . . . . . . . . . . . . . . . . . . . . . . . . . . . . . . . . . . . . . . . . . . . 45
Figure 34. Texas upstream employment forecast. . . . . . . . . . . . . . . . . . . . . . . . . . . . . . . . . . . . . . . . . . . . . . . . . . 45
Figure 35. Louisiana refining and chemical manufacturing employment forecast . . . . . . . . . . . . . . . . . . . . . . 47
Figure 36. Texas refining and chemical manufacturing employment forecast. . . . . . . . . . . . . . . . . . . . . . . . . . 48

LSU Center for Energy Studies                                                                                                                                            3
List of Tables
Table 1: U.S. crude oil and natural gas production COVID recovery . . . . . . . . . . . . . . . . . . . . . . . . . . . . . . . . . . 11
Table 2: Total projected GOM energy manufacturing investment. . . . . . . . . . . . . . . . . . . . . . . . . . . . . . . . . . . . 31

4                                                                                                                 Gulf Coast Energy Outlook 2022
1. Introduction
The annual GCEO is designed to provide stakeholders with a “one-stop” overview of the current
trends and outlook for the region’s energy industry and its various sectors. The GCEO is a work prod-
uct of Louisiana State University’s Center for Energy Studies and has been sponsored by several
companies and institutions looking to assist LSU in disseminating timely information and analysis
impacting the region’s economy and citizenry. The GCEO is also supported by the Center’s general
state appropriation, which represents a generous commitment by Louisiana to support energy-
related research. It would be difficult to produce the GCEO without both sources of support.
Unless stated otherwise, the “Gulf Coast” region specifically refers to the states of Texas, Louisiana,
Mississippi, and Alabama. In some instances, the U.S. Department of Energy reporting conventions
will require references to data collected at the Petroleum Administration for Defense District 3 (PADD
3) level, which includes Arkansas and New Mexico in addition to the Gulf Coast states. Employment
forecasts will focus on Louisiana and Texas. Where not specified, the forecast horizon extends to the
end of 2024, or approximately three years.
The remainder of this introduction will highlight the big picture considerations and assumptions made
in subsequent analysis and forecasting.

1.1       Recovering from COVID-19
Last year’s GCEO was prepared during the midst of the COVID-19 pandemic. For perspective, in
January of 2020, the U.S. economy was in its 126th month of economic growth, the longest in modern
history. By March of 2020, the world changed rapidly when the COVID-19 pandemic shut down entire
segments of the global economy. Oil markets, which were already in a state of downward correc-
tion, were further rocked by a historical decline in demand that was unaided by a failed OPEC+
deal to curtail output. These combined factors (unusually low energy demand, high energy supplies)
created the perfect storm leading to a collapse in global and domestic energy prices. At one point,
West Texas Intermediate (WTI) crude oil prices touched on an unheard-of negative daily price. U.S.
oil production immediately fell in response to these price signals from a record high of 12.97 million
barrels per day (MMBbl/d) in November of 2019 to 9.7 MMBbl/d by May 2020: a 25 percent produc-
tion free-fall in just seven months, the largest percent change in modern history.
But the good news is that this past year has brought recovery. Global, domestic, and regional oil and
natural gas production have all increased from the pandemic trough. The global rebound in aggre-
gate demand has placed upward pressure on both oil and natural gas prices. Drilling activity has not
returned to pre-pandemic levels, but exports of hydrocarbon-based products have. Thus, while the
industry (and world) is still not “back to normal,” there have been substantial improvements.
Last year’s GCEO addressed these COVID-related uncertainties and how short-term recovery may
evolve. This year, the 2022 GCEO will focus on addressing several medium- to longer-term recovery
questions, such as: How did companies respond operationally to a global pandemic? Will some of
these temporary changes implemented persist into a post-pandemic world? Has business travel been
reduced permanently, as companies find virtual meetings more efficient? Will employers embrace
workplace flexibility, allowing for remote work, thus reducing commuting? While specific long-term

LSU Center for Energy Studies                                                                        5
forecasts are not presented, this year’s GCEO will consider whether the fundamental relationships
between energy consumption and economic activity have changed more broadly.
      This year’s GCEO modeling will assume that COVID impacts will continue to attenuate
      globally, and the world will slowly return to some level of normalcy over the next year.
      Another wave of a COVID variant, such as Delta, leading to cascading shutdowns
      would likely result in outcomes that differ from the base 2022 GCEO forecast. This
      year’s GCEO, much like last year, anticipates that long-run energy demand growth will
      lead to increased U.S. energy exports, especially to the growing developing world.

1.2     Decarbonization Policies
Over the past five years, major decarbonization milestones have been reached. In 2016, the Paris
Agreement went into effect. This international treaty on anthropogenic greenhouse gas (GHG) emis-
sions was ratified by 190 countries representing 97 percent of the global population. President
Obama’s administration participated in the negotiation of the Paris Agreement in 2015, and in 2016
the agreement was formally ratified. President Trump withdrew the United States from the agreement
in June of 2017. Then, in January of 2021, one of President Biden’s first actions upon assuming office
was re-entering the agreement. For perspective on the increased attention on this issue, the Kyoto
Protocol signed in 1997 represented just 14 percent of global emissions, compared to 97 percent for
the Paris Agreement.
These GHG policy initiatives and commitments are not restricted to international activities alone. This
past year, Louisiana Governor John Bel Edwards committed Louisiana to considerable GHG emission
reduction targets that include GHG emissions reductions of 25 to 28 percent by 2025 and complete
carbon neutrality by 2050. This makes Louisiana the only Gulf Coast state with such ambitious GHG
emissions reduction targets. Further, Governor Edwards has appointed a Climate Initiatives Task
Force (CTF) composed of a variety of stakeholders that include non-governmental organizations
(NGOs), environmental and social justice groups, industry, state executive agencies, and trade asso-
ciations, among others. The CTF has been tasked with developing a set of priorities and policies for
meeting the governor’s carbon neutrality goals. The final product from the CTF is anticipated in the
upcoming year (2022).
Concurrent with these policy initiatives are the implementation by large international corporations of
“environmental, social, and governance” (ESG) policies that include decarbonization commitments.
For example, some of the largest vertically integrated oil and gas firms, many of which have large
Gulf Coast footprints (ExxonMobil, BP, and Shell) have made specific decarbonization commitments.
Two publicly traded utilities in Louisiana, Entergy and AEP-SWEPCO, have also made decarboniza-
tion commitments.
Increasingly, the refining and chemical manufacturing industries that process hydrocarbons are
making moves to decarbonize through a variety of means that include continued end-use and
process efficiencies, the use of alternative feedstocks, fuel substitution (electrification and hydrogen),
and through the use of carbon capture, utilization, and storage (CCUS). For instance, Air Products
recently announced a $4.5 billion clean energy facility in Ascension Parish, Louisiana, that will include
one of the state’s first carbon capture projects.

6                                                                                 Gulf Coast Energy Outlook 2022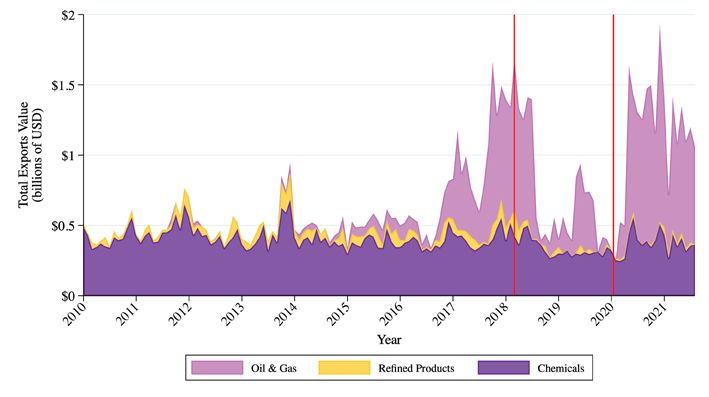
Although decarbonization may lead to near-term challenges for Gulf Coast indus-
          trial expansion, it also creates an opportunity for leadership in developing liquid fuels,
          chemicals, plastics, fertilizers, and other products, historically derived from fossil fuels,
          with lower, or even net zero GHG emissions. Further, industrial decarbonization has the
          opportunity to create a competitive advantage for Gulf Coast industries if done success-
          fully and cost competitively. Over the forecast horizon, the GCEO sees decarbonization
          creating considerable opportunities for continued regional capital investment.

1.3          The Future of Offshore Leasing
In January of 2021, Joseph R. Biden, Jr., was inaugurated as the 46th President of the United States.
Within weeks of the inauguration, the Biden administration announced via executive order plans to
reduce greenhouse gas emissions in light of concerns about global climate change.1 The execu-
tive order called on the Secretary of the Interior to “pause new oil and gas leases on public lands or
in offshore waters pending completion of a comprehensive review and reconsideration of Federal
oil and gas permitting and leasing practices.”2 This created a swift backlash from the oil and gas
industry and states whose economies are impacted by oil and gas activity on federal lands and
waters.3 The executive order prompted the cancelation of an offshore lease sale in the Gulf of Mexico
that had been scheduled for March of 2021. In June of 2021, a federal court preliminary injunction
was granted that allowed the Bureau of Land Management (BLM) and the Bureau of Ocean Energy
Management (BOEM), the agencies responsible for conducting lease sales on federal lands and
waters, to continue the leasing process while the review of federal oil and gas leasing practices was
completed. In October of 2021, BOEM announced a Gulf of Mexico lease sale for November 17, 2021.4
As of this writing, the Department of the Interior has not released its “comprehensive review” of the
leasing process. Offshore activities will be negatively impacted should this review lead to more leas-
ing delays or less favorable leasing terms.
          Therefore, for modeling purposes, the GCEO will assume that offshore activity will
          be continued into the short term, at least over the forecast horizon. The GCEO will
          change negatively, however, if new leasing suspensions are initiated, or if significant
          changes are made to the permitting and leasing processes.
It is difficult to incorporate these offshore policy uncertainties into the forecast modeling, as it requires
specific information about policy changes and the timing of these changes. Consistent with fore-
casting methodology in prior year GCEOs, proposed policy changes will not be incorporated into
forecasts until the policy change is actually enacted. In other words, a business-as-usual assumption
with regard to offshore leasing will be utilized. If significant changes restricting offshore activity are
implemented by the Biden administration, forecasts for upstream oil and gas employment provided
in the GCEO are likely to be too optimistic.

1
  Executive Order on Tackling the Climate Crisis at Home and Abroad. January 27, 2021.
2
  Executive Order on Tackling the Climate Crisis at Home and Abroad. January 27, 2021. Sec. 208.
3
  E.g. Texas: Executive Order by the Governor of the State of Texas. Executive Order GA-33. January 28, 2021. Louisiana: House Committee on Natural Resources and Environment and
  Senate committee on Natural Resources. February 10, 2021. Louisiana State Legislature.
4
  Lease Sale 257.

LSU Center for Energy Studies                                                                                                                                                  7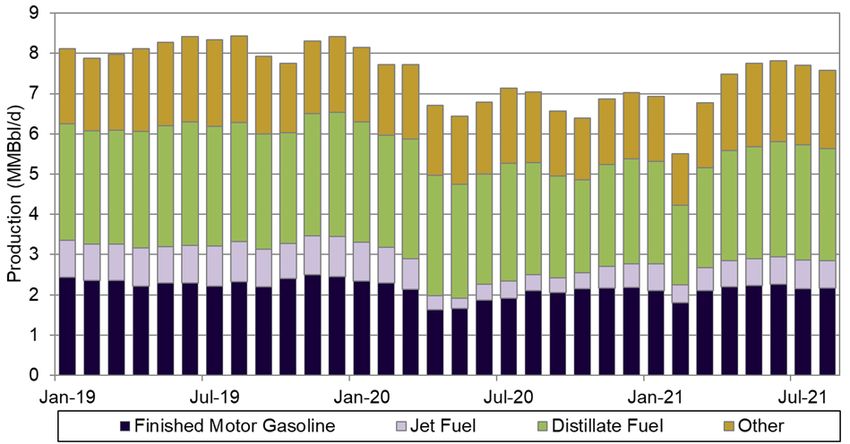
1.4            Hurricane Ida
Hurricane Ida made landfall as a Category 4 hurricane on August 29, 2021, at Port Fourchon, the most
important port for oil and gas activity in the Gulf of Mexico. At the peak, over one million customers
were out of power in the Gulf Coast region, and nine refineries in Louisiana shut down operations
due to the storm, accounting for 2.3 million b/d of refining capacity, or approximately 14 percent of
the total U.S. refining capacity.5 Ida also interrupted over 90 percent of oil and gas production in the
U.S. Gulf of Mexico. Phillips 66 Alliance Refinery in Belle Chase was flooded. Recent media reports
have questioned whether the refinery will restart operations or be transformed into a crude terminal,
which would require significantly fewer workers. Media reports at the time of this writing have indi-
cated that Shell Norco was in the process of restarting, when a fire broke out further delaying the
refinery’s restart.
Not to be overlooked, last year’s tropical season (i.e. 2020) included three major hurricanes: Laura,
Sally, and Delta. Most notable is Hurricane Laura, which made landfall in Cameron Parish, Louisiana.
The southwest region of the state has still not recovered. In fact, Lake Charles is the only MSA in
Louisiana that lost jobs this past year, at least partially due to Hurricane Laura.
Hurricanes cause significant challenges for energy infrastructure, especially aging refineries and
chemical plants. Once significant damage is sustained, facility owners might choose to not return to
normal operations, which can reduce employment in these sectors.
            The GCEO assumes that the majority of the effects of the 2020 and 2021 hurri-
            canes, relative to the energy sector, are short lived and have not materially affected
            companies’ decisions to make regional energy infrastructure investments. The GCEO
            assumes that all existing energy infrastructure is repaired to pre-storm conditions over
            the next year and is not prematurely retired in any significant fashion. While it is true
            that some refineries, in the aftermath of the storm season, are in a tenuous economic
            position relative to continued operations, these tenuous economic conditions existed
            prior to the tropical seasons.

1.5            Another Round of Trade Negotiations?
Last year, the GCEO highlighted former President Trump’s trade negotiations with China. Because
the Gulf Coast region is a net exporter of energy products to both China and the world, and the
region has been in the midst of historic investment in refining, chemicals, and export, the GCEO indi-
cated that trade negotiations were a significant risk for the region.
As discussed in last year’s GCEO, in January of 2020, the U.S. and China signed Phase 1 of a trade
deal that went into effect on February 14, 2020.6 The 91-page agreement includes six chapters cover-
ing topics such as intellectual property, technology transfer, trade in food and agricultural, financial
services, and macroeconomic policies. But China is currently not on track to meet its commitments
made in the trade deal.

5
    U.S. Department of Energy. Office of Cyber Security, Energy Security, and Emergency Response. Hurricane Ida Situation Reports.
6
    Economic and trade agreement between the government of the United States of America and the government of the People’s Republic of China.

8                                                                                                                                        Gulf Coast Energy Outlook 2022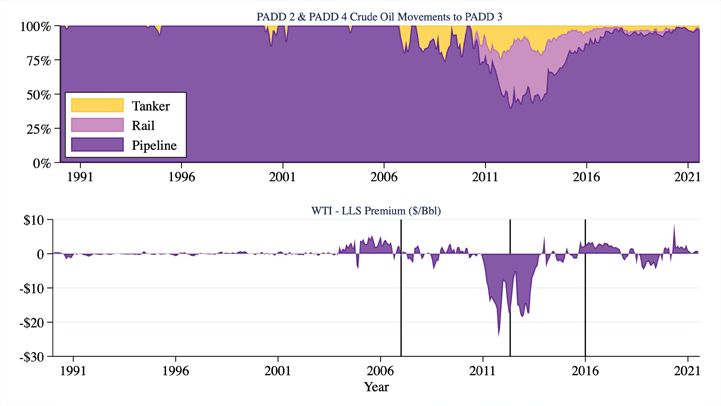
Currently, the Biden administration is in the process of re-entering negotiations with China. Media
reports have indicated that China was perhaps expecting an incoming Biden administration to provide
relief from tariffs implemented by the Trump administration, but this has not occurred to date.
In October of 2021, the Biden administration began unveiling its China trade policy following a review
of import tariffs and other measures imposed by the Trump administration.7 U.S. Trade Representative
Katherine Tai confirmed that upon this review, tariffs would continue while the Biden administration
would begin the process of launching new talks with Beijing.8 This has perhaps exacerbated supply
chain challenges in the U.S., but might also bring China back to the negotiating table with the new
administration.
At this time, it is not clear whether President Biden is negotiating a Phase II (which was anticipated to
be the final trade deal) or the extent to which he intends to hold China’s feet to the fire, so to speak,
on not meeting the commitments made with the prior administration. Perhaps the good news is that
GCEO industry queries, interviews, and research indicate that project developers have not specif-
ically identified these current trade discussions as a major risk when considering regional capital
investment.
             The current GCEO modeling assumes that trade talks with China will not deteriorate,
             that new tariffs will not be implemented, and that these export commitments will not
             have a net negative impact on the demand for Gulf Coast energy products.

7
    Josh Zumbrun. U.S. Poised to Unveil China Trade Policy. Wall Street Journal. October 1, 2021.
8
    Yuka Hayashi and Josh Zumbrun. Biden’s China Tariff Plan Fails to Provide Enough Relief, Businesses Say. Wall Street Journal. October 11, 2021.

LSU Center for Energy Studies                                                                                                                         9
2. Crude Oil and Natural Gas Production and Prices
2.1 Recent Market Trends: Production
The shale revolution has dramatically changed the fortunes of U.S. energy across almost every sector.
The energy supply and pricing changes created by this revolution continues to this day. Despite the
pandemic, both crude oil and natural gas supplies are increasing, albeit at rates slower than origi-
nally anticipated.
Total U.S. crude oil and natural gas production peaked in 2019, averaging 12.3 million barrels per
day (MMBbl/d) of crude oil and 112 billion cubic feet per day (Bcf/d) of natural gas (see Figure 1).9 The
pandemic, however, resulted in significant production declines throughout 2020.
Figure 1: U.S. crude oil and natural gas production
Source: U.S. Energy Information Administration. Petroleum & Other Liquids. Crude Oil Production. Natural Gas Gross Withdrawals.
For perspective, Table 1 shows monthly U.S. and Gulf Coast crude oil and natural gas production
alongside the percent change from the same month in 2019—the year before the COVID-induced
shutdown. Note that peak U.S. oil and natural gas production pre-pandemic occurred in November
and December of 2019, respectively. Monthly data is compared to the same month in the pre-COVID
year to account for seasonal variations.
Table 1 starts with a March date, since March 2020 is the date commonly associated with the U.S.
pandemic shut down. March 2021 marks the pandemic’s one-year anniversary where U.S. crude oil
9
Annual averages provided by EIA listed in text. Monthly data shown in Figure.
10 Gulf Coast Energy Outlook 2022production was at 11.2 MMBbl/d, or 6.2 percent below the pre-pandemic level. From April to July, U.S. production hovered between 4.8 and 7.4 percent below the corresponding month in 2019. August crude oil production decreased and is estimated to be 10.7 percent below prior year August levels. Thus, U.S. oil production has still not recovered entirely from the pandemic. Alternatively, Panel B of Table 1 shows that U.S. natural gas production has consistently been 2.5 to 3.2 percent above pre-pandemic levels. Table 1: U.S. crude oil and natural gas production COVID recovery Figure 2 highlights the devastation that the pandemic has played on U.S. drilling activity. Baker Hughes reported 250 active rigs in August 2020, the lowest active recorded rig count that was 73 percent lower than the prior August (2019). Unsurprisingly, this rig count drop has mirrored the drop in the West Texas Intermediate spot price that bottomed out at less than $17 per barrel in March of 2020. Fortunately, both crude oil prices and rig counts are all reporting recoveries. Baker Hughes reported 508 active rigs in September 2021. Although this is more than double the level at the time of the pandemic trough (August 2020) that rig count level is still less than half that reported in 2018 and 2019. By fall, 2021, WTI spot prices have increased to around $71 per barrel, which should presage continued increases in future drilling activity. However, the GCEO is not anticipating drilling activity to reach pre-pandemic levels over the next year. As will be discussed in Section 8, the GCEO antic- ipates that drilling activity will not likely return to pre-pandemic levels. Thus, the industry has once again evolved to be able to produce more hydrocarbons with fewer inputs. LSU Center for Energy Studies 11
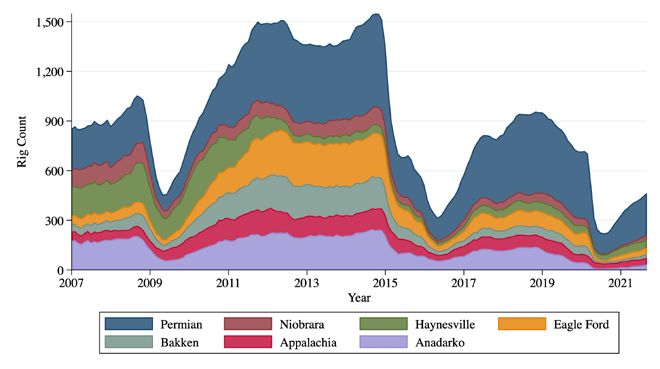
Figure 2: U.S. crude oil prices and rig count

Source: U.S. Energy Information Administration. West Texas Intermediate Spot Price. Baker Hughes Rotary Rig Counts.

Figure 3 displays rig activity levels in seven major U.S. shale plays, as defined by EIA’s Drilling
Productivity Report. Last year’s GCEO noted that the Permian basin has been the predominant U.S.
shale play, accounting for approximately 46 percent of all active 2019 rigs. While the Permian is the
premier basin, it is also the one that has experienced the largest rig count reduction, losing more
than 900 rigs between the beginning of 2019 and the August 2020 post-pandemic trough.
All seven of the basins shown in Figure 3 have experienced rig count increases since September
2020, ranging from a 76 percent increase (Appalachia) to an over 230 percent increase (Anadarko).
Unsurprisingly, the largest absolute increase has been in the Permian Basin, which has experienced
an increase of 240 rigs over the past year.

12                                                                                                                    Gulf Coast Energy Outlook 2022
Figure 3: Rig counts in major shale basins

Source: U.S. Energy Information Administration. Drilling Productivity Reports.

As a corollary to Figure 1, Figure 4 illustrates regional (PADD 3) crude oil and natural gas production.
Table 1, provided earlier, also provides a comparison of changes in total U.S. crude oil and natural gas
production to those experienced in the Gulf Coast region. The comparison provides several notable
observations.
As with U.S. production, Gulf Coast oil and natural gas production were impacted differently by the
pandemic. For oil, like the U.S., the Gulf Coast is still below pre-pandemic levels. In the most recent
month available, August 2021, oil production was 10.7 percent and 12.1 percent below August 2019
levels for the U.S. and Gulf Coast, respectively.
Unlike U.S. natural gas production, though, that is above pre-pandemic levels, Gulf Coast natural gas
production has returned to, but not exceeded, pre-pandemic levels. Gulf Coast natural gas produc-
tion was within 0.3 percent of its pre-pandemic levels by March of 2021. Between March and August
of 2021, Gulf Coast natural gas production has oscillated between two percent above and below
the corresponding month in 2019. Nationally, natural gas production was between 2.5 and 3 percent
above pre-pandemic levels from March to August 2021.
.

LSU Center for Energy Studies                                                                         13
Figure 4: PADD 3 crude oil and natural gas production

Source: U.S. Energy Information Administration. Petroleum & Other Liquids. Crude Oil Production. Natural Gas Gross Withdrawals.

2.2 Recent Trends: Commodity Pricing
Figure 5, as with prior year GCEOs, highlights three different natural gas pricing epochs: (1) the period
spanning the 1990s; (2) the period starting with the natural gas supply/pricing crisis of the 2000s;
and (3) the post-recession period to current. These epochs differ in both their levels and variabili-
ty.10 More recently, natural gas prices spiked during Winter Storm Uri in February 2021 but quickly
returned to pre-Uri levels. As 2021 turns to a close, natural gas prices are at historically high levels.
The GCEO takes the view that this most recent natural gas price run-up has more to do with (a) the
rate at which natural gas production is recovering (as shown in the prior section), (b) the impact that
the post-pandemic economic rebound has had on underground storage levels in North America and
(c) the increasingly integrated nature of world natural gas markets that has been facilitated by U.S.
LNG exports. Thus, the GCEO sees it as unlikely that U.S. natural gas markets are entering into a high
price/high price volatility epoch comparable to that experienced in 2000s.

10
     Variability is shown as the standard deviation in the change in average monthly prices.

14                                                                                                                            Gulf Coast Energy Outlook 2022
Figure 5: Historical inflation-adjusted natural gas price Source: U.S. Energy Information Administration. Henry Hub Natural Gas Spot Price. Inflation adjustment based on U.S. Consumer Price Index sources from the Bureau of Labor Statistics. Figure 6 provides a comparable analysis for crude oil pricing, underscoring again the dramati- cally reduced volatility that current period prices are experiencing relative to past pricing epochs. Pre-pandemic crude oil prices are shown in the middle range of the third epoch. The pandemic, quite simply, crashed crude oil prices in ways never experienced in the past. Crude oil prices bottomed out at a monthly average of less than $17 per barrel in April 2020, but quickly rebounded. The recov- ery of global crude oil demand, coupled with tight supplies and continued OPEC+ discipline, has put upward pressure on prices, which are now at the upper end of the range. Thus, like natural gas, and despite the global economic activity of the past year, the 2022 GCEO takes the view that crude oil prices will continue within this third epoch reflected by relatively low levels and low variability. LSU Center for Energy Studies 15
Figure 6: Historical inflation-adjusted oil prices

Source: U.S. Energy Information Administration. West Texas Intermediate Spot Price. Inflation adjustment based on U.S. Consumer Price Index sources from the Bureau
of Labor Statistics.

2.3 Outlook: Commodity Pricing
Futures markets are indicating downward pressure on both crude oil and natural gas prices. Figure 7
and Figure 8 show current futures prices for oil and natural gas alongside the futures prices from the
last two years’ GCEOs. Examination of not only the current futures price, but also how expectations
have changed, is instructive for understanding market trends.
Figure 7 shows the crude oil futures prices. Last year, oil markets were in contango—meaning that
prices were anticipated to increase in coming years. As it turns out, prices did indeed increase over
the past year, but at a much faster clip than anticipated by futures market. Oil futures markets are now
in backwardation—meaning that prices are expected to fall in the future. Although futures markets
are predicting downward crude oil price pressure, markets are also predicting higher prices over the
next five years or more which differs from trends over the past two years’ GCEOs. Thus, higher crude
oil prices are anticipated to put upward pressure on drilling activity and eventually crude oil produc-
tion. Price-induced increases in drilling activity will, in turn, impact upstream oil and gas employment
forecasts, which will be discussed in greater detail in Section 8.

16                                                                                                                            Gulf Coast Energy Outlook 2022
Figure 7: Crude oil price outlook

Source: New York Mercantile Exchanged West Texas Intermediate Futures Price. Sources from S&P Global Market Intelligence. Most recent future price as of August
31, 2020.

Figure 8 shows the corollary for natural gas futures prices. Like crude oil, natural gas prices have
increased above levels predicted by futures markets over this past year. Natural gas prices are antic-
ipated to increase through the heating season, but then be reduced in 2022 and then again in 2023.
Although prices have increased significantly over the past several months, the GCEO continues to
take the view (as it has for the past several years) that these natural gas prices are a good balance
between being high enough to support increased drilling activity in natural gas-based plays such as
the Haynesville and Appalachia, but low enough to continue to attract investment in chemical manu-
facturing and LNG export in the Gulf Coast region, as will be discussed in Section 5.

LSU Center for Energy Studies                                                                                                                               17
Figure 8: Natural gas price outlook

Source: New York Mercantile Exchanged Henry Hub Futures Price. Sources from S&P Global Market Intelligence. Most recent future price as of August 31, 2020.

2.4 Outlook: Crude Oil and Natural Gas Production
Figure 9 and Figure 10 provide the 2022 GCEO crude oil and natural gas production forecasts for the
Gulf Coast based on the Enverus ProdCast model. Both figures show the current forecast as well as
those in the past two years’ GCEOs.
Figure 9, provides the Gulf Coast crude oil production forecast, which is anticipated to increase
over the forecast horizon.11 Pre-pandemic 2020 regional crude oil production averaged 7.6 MMBBl/d.
The GCEO forecasts that year-end 2021 crude oil production will average 8.0 MMBBl/d, just below
the prior 2019 high. By 2030, the GCEO estimates regional crude oil production of 10.1 MMBBl/d.
Interestingly, and impressively, this 2030 regional crude oil production forecast is at a level equal
to that produced by the entire U.S. back in 2017. Thus, market prices and global demand will likely
be the constraints that limit regional crude oil production over the next decade. Simply put, there is
plenty of oil in the ground to sustain a decade of production growth.

11
     Note that the definition of the Gulf Coast region in the Enverus Prodcast model differs slightly from political boundaries, due to the inherent geological nature of the model. Thus, model
     outputs levels cannot be directly compared to Table 1 and Figure 4.

18                                                                                                                                                   Gulf Coast Energy Outlook 2022
Figure 9: Gulf Coast oil production forecast
Source: Enverus ProdCast.
Figure 10 shows that Gulf Coast natural gas production is also anticipated to continue to grow over
the next decade.12 In 2020, Gulf Coast natural gas production was about 44.3 Bcf/d, and anticipated
to increase to 45.7 Bcf/d, on average, in 2021. Remarkably, current natural gas production levels,
if they continue at their current pace, will be approximately 3 percent above pre-pandemic 2020
natural gas production levels. This forecast outcome is even more interesting considering that last
year’s GCEO forecast flat Gulf Coast natural gas production until approximately 2025, at which point
production would increase marginally. In fact, current year natural gas production is at levels higher
than each of the annual natural gas production levels projected in the 2021 GCEO.
12
Ibid.
LSU Center for Energy Studies 19Figure 10: Gulf Coast natural gas production forecast Source: Enverus ProdCast. 20 Gulf Coast Energy Outlook 2022
3. Midstream Constraints and Pipeline Activity
Geographic differences in crude oil and natural gas prices often drives pipeline development. If
prices at “Point A” are higher than “Point B” at a given time, firms have the incentive to develop trans-
portation resources to capture this price differential (or “basis”).
Figure 11 compares differences in prices of West Texas Intermediate (WTI) and Louisiana Light Sweet
(LLS). Three vertical lines are drawn. The first vertical line marks pricing levels as of January 2007,
the date at which the EIA began tracking crude oil and natural gas unconventional production in its
Drilling Productivity Report. The second line marks pricing levels as of May 2012, when the Seaway
pipeline was reversed. Seaway initially moved crude from Freeport, Texas, on the Gulf Coast, to
Cushing, Oklahoma, where WTI is priced. After Seaway was reversed, the pipeline carried crude
produced in the Mid-Continent to Gulf Coast refineries. This line divides a regime of increasing inter-
nal shipping constraints from a regime where those constraints were relieved. The third line marks
pricing levels as of December 2015, when the U.S. government lifted the crude oil export ban.
The top panel of Figure 11 shows the share of crude oil transported from PADD 2 to PADD 4 in the
Mid-Continent (states in the Rocky Mountain and Midwestern regions) to PADD 3 on the Gulf Coast.
From 1990 to 2007, almost all crude was transported from the mid-continent to the Gulf Coast via
pipeline. Shippers used pipelines because rail and tankers were more expensive on the margin.
During this time WTI and LLS moved in lockstep. In fact, by April 2012, more than half of the crude
shipped from the mid-continent to the Gulf Coast went via high-cost barge and rail, as pipelines were
at full capacity. Almost immediately after the reversal of the Seaway pipeline, this trend stopped, and
the share of crude shipped via pipeline began to recover.
The LLS-WTI premium closely mirrors changes in the mode of transport over the 2007-to-2015 time
period. This close correlation between shipping and prices can explain between half to three-quar-
ters of relative price movements. Prior empirical research has investigated the degree to which
refinery composition, captured by API crude oil gravity, can explain these differentials.13 Evidence of
shipping constraints, but not refining constraints, is observed.
This analysis provides strong evidence that shipping constraints between the Mid-Continent and Gulf
Coast were the culprit for the price discount. The good news is that at the time of this writing, crude
markets are approximately in balance, with a slight premium for LLS. The GCEO anticipates a small
premium will persist over the forecast horizon and that more than 95 percent of crude shipped from
the Mid-Continent to the Gulf Coast will continue to come from pipelines. Although oil production is
anticipated to increase, due to the investment in pipeline infrastructure over the past decade, the
need for increased barge and rail shipments is unlikely at this time. Thus, significant investment in
crude oil pipelines is likely not needed at this time to continue moving crude from the Mid-Continent
to the Gulf Coast region for refining and/or export.

13
     Agerton & Upton, 2019. Decomposing Crude Price Differentials: Domestic Shipping Constraints or the Crude Oil Export Ban? The Energy Journal, Vol. 40, No. 3.

LSU Center for Energy Studies                                                                                                                                       21
Figure 11: PADD 3 crude oil movements by transportation type Source: U.S. Energy Information Administration, West Texas Intermediate Spot Price and Light Louisiana Sweet First Purchase Price. Movements between PADD Districts, by pipeline, tanker and barge, and rail Recent natural gas constraints over the past several years have been focused in differing areas. The relevant natural gas transportation constraint is not between the mid-continent and the Gulf Coast region (as has been the case for crude oil), but instead moving natural gas out of the Permian Basin to other consuming or export locations.14 The Permian exhibits three specific transportation-ori- ented constraints. The first is characterized by limited in-field gathering system capabilities in some areas. The second is defined by limited natural gas processing, while the third includes the need for additional longer-haul transmission pipeline capacity to move natural gas out of the Permian to Gulf Coast markets.15 Collectively, these three constraints can lead to two outcomes: (1) wellhead flaring of natural gas and (2) inter-region natural gas pricing discounts, as seen in the Henry Hub/Waha pricing. Figure 12 illustrates both trends, focusing on the Permian basin and comparing Henry Hub and Waha natural gas prices. Pre-2018, these two hubs traded at very similar prices, with Henry Hub receiving a small premium, on average, due to its proximity to many large sources of natural gas demand. Also, flar- ing in the Permian basin was consistently less than 0.1 bcf/d; however, as Permian basin production ramped up, markets began to experience the emergence of significant Waha price discounts rela- tive to Henry Hub. On some days, natural gas at Waha has traded at negative prices. These price 14 Note that while there is natural gas flaring in the Bakken, natural gas volumes from that region are much less likely to end up in the Gulf Coast region, and therefore the focus will be on constraints coming from the Permian basin. 15 For a detailed discussion of the value chain moving natural gas from wellhead to market, see recent research. Agerton, Gilbert & Upton, 2020. The Economics of Natural Gas Flaring in U.S. Shale: An Agenda for Research and Policy. Rice University’s Baker Institute for Public Policy Working Paper. USAEE Working Paper No. 20-460. 22 Gulf Coast Energy Outlook 2022
discounts moved in lockstep with flaring in the Permian, and at its peak the Permian basin was flaring
more than one-half billion cubic feet of natural gas per day.
Fortunately, both flaring and price differentials have been declining over the past few years. But at
the time of this writing, still more than 150 million cubic feet of natural gas is being flared or vented
in the Permian basin per day. According to EIA, in 2020, more than 417 Bcf of natural gas was flared
or vented in the United States. This level of flaring, for perspective, represents about one percent of
current U.S. natural gas production.16 If the flared natural gas volumes were instead used to gener-
ate electricity, those volumes would have generated enough to power 7.2 million households for a
year.17 If this flared natural gas had gotten to market, it would have had a value of $1.65 billion dollars
in 2020.18 This represents an economic incentive to, instead of flaring, invest in pipeline capacity.
During the past two years, the GCEO has forecast that pipeline investments would alleviate much of
this constraint, and that Waha prices would likely converge with Henry Hub. Interestingly, while prices
have converged for the most part, with a price difference at less than 30 cents per Mcf, flaring levels
have not dropped off as steeply over the past year. With increased oil and natural gas production
forecasted from the Permian basin, it is therefore likely that additional natural gas gathering, process-
ing, and transmission pipeline investment will continue as the global economy recovers. In fact, some
energy analysts are anticipating that the Waha Hub natural gas prices may experience deep basis
discounts over the next year.19

Figure 12: Henry Hub and Waha natural gas prices

Source: Texas Railroad Commission.

16
   Source: Natural Gas Gross Withdrawals and Production. Gross Withdrawals compared to Vented and Flared in Annual-Million Cubic Feet. Accessed Oct 2020.
17
   See Agerton, Gilbert & Upton (2020) for more discussion and calculations.
18
   Using a market price of $3 per MCF.
19
   E.g. RBN Energy, LLC. “Play It Again – Permian Natural Gas Markets Singing a Familiar Tune as Constraints Loom.” 10/25/2021.

LSU Center for Energy Studies                                                                                                                               23
The constraints discussed above have led to the current planning of approximately 40 Bcf/d of
regional natural gas pipeline capacity expansions through 2024 (almost entirely in Texas).20 These
transmission pipeline projects, alongside continued investment in gathering and natural gas process-
ing, should help to alleviate current incentives for Permian Basin flaring. But whether increased flaring
and Waha basis discounts are exacerbated or relieved over this next year will be determined by the
speed in which production comes back online relative to these infrastructural investments coming
online.
Other things equal, the GCEO anticipates that some level of flaring and price discounts could persist
in the long run if the capital cost of pipeline investments is considerably larger than the benefits of
moving this flared natural gas to the market. Further, continued flaring could have negative implica-
tions for Gulf Coast LNG exporters who are increasingly attempting to quantify the life-cycle emissions
of their products to market their exports as low carbon. This could also create challenges for elec-
tricity generators that are switching from coal to natural gas in hopes of reducing their system-wide
carbon footprint. Thus, the implications flaring has for decarbonization should not be overlooked.
Lastly, changes in environmental regulations could significantly modify future flaring incentives. The
EPA has recently announced its intention to conduct a rulemaking addressing a wide range of well-
head methane releases and flaring. The outcome of the rulemaking will likely also impact the degree
to which pipeline development progresses.

20
     Source: U.S. Energy Information Administration. Natural Gas Pipeline Projects. Includes natural gas pipelines in the construction or planning phase.

24                                                                                                                                                 Gulf Coast Energy Outlook 2022
4. Power Sector 4.1 Recent Trends: Load Growth Figure 13 shows a number of interesting trends in both U.S. and regional electricity sales. First, U.S. electricity sales growth has been relatively flat over the past decade. For instance, compare total sales in MWhs to all customers in the United States in 2007 (the highest load year before the Great Recession) to the most recent full year available (2020). In fact, current (2020) electricity sales are 2.6 percent lower than those reported in 2007 (the last highest annual sales level). The Gulf Coast, however, has seen differing trends with electricity sales increasing by 11 percent over this same time period. Gulf Coast retail electricity sales, as a share of total U.S. electricity sales, has increased from 15 percent to 17 percent over this time period. Focusing on the most recent full year of data, 2020, which coincided with the pandemic, electricity demand is down by 3.9 percent nationally and 4.9 percent along the Gulf Coast. Thus, the Gulf Coast experienced a larger relative reduction in electricity sales relative to national averages; however, as will be discussed later, current regional electricity sales are now back to pre-pandemic levels. Figure 13: U.S. and Gulf Coast electricity sales Source: U.S. Energy Information Administration. Retail sales of electricity to ultimate consumers. Figure 14 focuses specifically on industrial electricity sales for both the U.S. and Gulf Coast region. U.S. industrial electricity sales are down by 11 percent over the 2007-to-2020 time period, while Gulf Coast industrial demand is up by five percent, increasing the region’s relative share of total indus- trial electricity sales. These relative increases are largely the result of the rapid expansion of energy manufacturing along the Gulf Coast starting around 2008. LSU Center for Energy Studies 25
Figure 14: U.S. and Gulf Coast industrial electricity sales

Source: U.S. Energy Information Administration. Retail sales of electricity to ultimate consumers.

4.2 Recent Trends: Carbon Emissions
Greenhouse gas (GHG) emissions associated with power generation are provided in Figure 15.
Since 2013, U.S. and Gulf Coast power generation related GHG emissions are down 20.7 percent
and 15.8 percent, respectively.21 These decreases are attributable, in part, to the development of a
greater level of renewable energy, and, more importantly, considerable thermal efficiency gains by
the region’s utilities, particularly in Louisiana. These power generation related GHG emission trends
are addressed in greater detail in CES’ recent GHG inventory report.22

21
   Note that this only includes data to 2019, and thus emissions are likely significantly lower in 2020 due to the recession. Due to data lags, 2019 is the most recent year of data currently
 available.
22
   Dismukes, DE. Louisiana 2021 Greenhouse Gas Inventory. Prepared on behalf of the Governor’s Office of Coastal Activities. October 2021. LSU Center for Energy Studies.

26                                                                                                                                                 Gulf Coast Energy Outlook 2022
Figure 15: U.S. and Gulf Coast carbon dioxide emissions from electricity generation

Source: U.S. Energy Information Administration. Electricity. Emissions by plant and by region.

4.3 Outlook: Capacity Investment
Figure 16 shows historic and projected power generation capacity by fuel source for the Gulf Coast
region. Projections are developed by S&P Global Market Intelligence.23 Interestingly, over 45,000
MW of solar generating capacity is currently in the planning phase or under construction in the Gulf
Coast region according to S&P. While not shown in this Figure, in MISO alone, Louisiana currently has
over 6,000 MW of solar capacity in the interconnection queue. For perspective, solar capacity was
less than 100 MW in the Gulf Coast region as recently as 2011.
Figure 16, also shows as much as 17,000 MW of wind capacity in the planning phase. In third place,
natural gas has approximately 11,000 MW of capacity currently being planned in the region.
Note that while solar capacity will likely experience significant growth, in 2020 solar PV nationally
had a capacity factor of approximately 25 percent, compared to 35 percent for wind and 57 percent
for combined-cycle natural gas.24 Thus, although solar capacity might very well grow over the next
five years or so, this is still anticipated to be a small share of total electricity generated for the fore-
seeable future.

23
  Future capacity is based on actual planned and under construction projects, and not based on any projections of unreported new developments or retirements.
24
  U.S. Energy Information Administration. Electric Power Monthly. Table 6.07.B. Capacity Factors for Utility Scale Generators Primarily Using Non-Fossil Fuels. Table 4.08.A. Capacity
 Factors for Utility Scale Generators Primarily Using Fossil Fuels.

LSU Center for Energy Studies                                                                                                                                                     27
Figure 16: Gulf Coast power generation capacity and outlook

Source: S&P Global Market Intelligence, Historical and Future Power Plant Capacity.

28                                                                                    Gulf Coast Energy Outlook 2022
5. Energy Manufacturing Activity
5.1         Energy Manufacturing Recent Trends
While the recent pandemic slowed regional industrial development, it has certainly not halted that
development. In fact, regional capital investment continues to show resiliency despite the global
economic slowdown. The Gulf Coast remains an important location for energy manufacturing given
its proximity to low-cost and abundant hydrocarbon feedstocks and the ability to leverage a wide
range of supporting energy infrastructure; however, an increasingly large part of this industrial devel-
opment is dedicated to supporting energy exports, particularly liquefied natural gas (LNG).
Figure 17 updates a regular GCEO chart highlighting regional capital investment trends by Gulf Coast
state. Since 2011, the Gulf Coast has supported over $141.5 billion in capital investments. These
investments have been close to equally shared between Texas (49 percent) and Louisiana (50.5
percent), with much smaller shares allocated to Mississippi and Alabama (0.5 percent). Most of the
historic investments have leaned towards traditional chemical sector activities (at $81.6 billion) with a
smaller, yet significant amount in LNG (at $59.8 billion).
As anticipated in last year’s GCEO, and despite the pandemic, 2021 represented a year in which a
backlog of capital investments came on-line, reversing a 2018-to-2020 relative lull in capital invest-
ment activity. Investments in 2021 were strong relative to the prior two years, even though they were
slightly off announced levels.

Figure 17: GOM energy manufacturing investments by state

Source: Center for Energy Studies, authors’ construct from publicly reported data.

LSU Center for Energy Studies                                                                         29
Last year’s GCEO noted $38.2 billion in new 2021 capital investment based on publicly available
project announcements. The 2021 GCEO handicapped this publicly announced level down to $21.7
billion due to the uncertainty about the pandemic – about $16.5 billion below the publicly-announced
2021 level. Actual 2021 energy manufacturing investments, however, were more resilient than antic-
ipated in last year’s GCEO and reported in at $35.2 billion. Therefore, the bad news is that while
actual investments were down by $3 billion relative to prior announced levels, those investments
were considerably higher than last year’s GCEO ($13.5 billion over forecast).
This past year’s capital investments also reveal an important and gradual shifting of priorities across
energy manufacturing investment types, as shown in Figure 18. Prior to 2021, there was a slight bias
in favor of chemical industry investments (crackers, methanol, ag chemicals) relative to LNG export
facilities. This past year, LNG investments began to dominate the data and are anticipated to continue
to dominate investment trends in future years.

Figure 18: GOM energy manufacturing investments by sector

Source: Center for Energy Studies, authors’ construct from publicly reported data.

5.2 Energy Manufacturing Outlook
The 2022 GCEO estimates as much as $190 billion in capital development up to 2029. The relative
shift in potential capital investments away from chemical industry activities, and towards LNG export
facilities is expected to continue into the near future (see Table 2). Total LNG related investments,
for the region, are anticipated to surge to $120 billion, whereas non-LNG investments (mostly chem-
ical-related) are anticipated to grow by $70 billion across the entire region.

30                                                                                   Gulf Coast Energy Outlook 2022
Table 2: Total projected GOM energy manufacturing investment

Louisiana leads the region in total energy manufacturing capital investment potentials with as much
as $125.6 billion by 2029. Most of these announced energy manufacturing investments are allocated
to LNG export facilities ($86.1 billion). A smaller yet significant level of investment is associated with
the chemical sector ($39.4 billion). Equally important, and as discussed earlier, is the fact that a grow-
ing number of these investments will be dedicated to industrial decarbonization activities such as
blue ammonia, blue hydrogen, and other biofuels.
Texas holds a distant second place to Louisiana in projected energy manufacturing investment
announcements. The 2022 GCEO estimates as much as $57 billion in new Texas energy manufac-
turing investments with a close to even distribution between LNG-export related investments ($26.3
billion) and new chemical/refining related investments ($30.7 billion).
There is also about $8 billion in LNG related investments announced for the Mississippi and
Alabama region.

LSU Center for Energy Studies                                                                           31
You can also read