GROWING BETTER TOGETHER - 2017 SUSTAINABILITY REPORT - Amazon AWS
←
→
Page content transcription
If your browser does not render page correctly, please read the page content below

GROWING
   BETTER
  TOGETHER
 2017 SUSTAINABILITY REPORT

BETTER PLANET   BETTER LIVES   BETTER PARTNER

GROWING BETTER TOGETHER
                                 Farming has always been about connections.                  I’m proud to share with you Monsanto’s 2017
                                 The Earth, its resources and the families who               Sustainability Report, which has been prepared
                                 steward the land are all fundamentally connected            in accordance with the new Global Reporting Initiative
                                 to what we grow – both in the fields and in our             Standards in our first reporting cycle since the Standards
                                 communities.                                                were released. Here you’ll find information about our
                                 Modern agriculture plays a leading role in building         commitments to environmental sustainability, human
                                 those connections, combining tradition with technology      rights, inclusion, philanthropy and transparency about
                                 to help farmers grow better harvests using less land,       our business practices. You’ll also find progress on our
                                 less water and less energy. You can’t always see them,      continuing commitment to the United Nations Global
                                 but the connections are there – from billions of soil       Compact and Sustainable Development Goals.
                                 microbes interacting with crop roots to millions            Today, our company is building another important
                                 of data points reaching growers via satellite about         connection – one that will help continue to grow
                                 the health of their fields.                                 modern agriculture’s investment in innovation and
                                 As a global community, we face a wide range                 the growers who need it. In 2016, we entered into
                                 of challenges – a growing population, a changing            an agreement to be acquired by Bayer, a company that
                                 climate and an increase in food insecurity in many          shares our understanding of the world’s sustainability
                                 parts of the world. At Monsanto, we’re committed            challenges and agriculture’s unique position to help
                                 to helping create solutions to these challenges             address them. I believe the combination of Bayer
                                 while helping to take care of our planet, our people        and Monsanto will accelerate the pace of innovation
                                 and the communities where we live and work.                 to more comprehensively address the challenges faced
                                                                                             by growers, consumers, our population and our planet.
                                                                                             We’re proud of the progress we’ve made on our
                    "At Monsanto, we’re committed to helping                                 sustainability commitments, but we know there’s
                     create solutions to these challenges while                              more work to do. We look forward to continuing
                     helping to take care of our planet, our                                 to connect growers with sustainable solutions
                                                                                             for better harvests worldwide.
                     people and the communities where we live
                     and work."                                                              Best regards,

                                                                                             Hugh Grant
                                                                                             Chairman and CEO

EXECUTIVE SUMMARY       GROWING BETTER TOGETHER               BETTER PLANET               BETTER LIVES             BET TER PARTNER                        2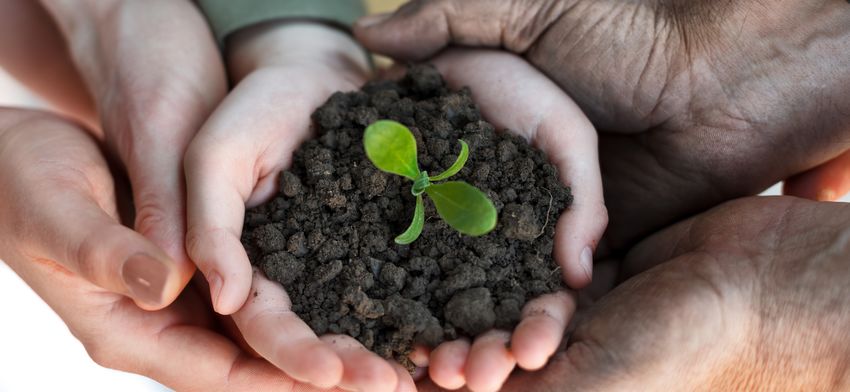
TABLE OF CONTENTS

                         11    Our Company and                                  30       Increase Food Availability
                               Sustainability Framework                                  and Access, and Improve
                                                                                         Lives for Farmers and Society

                                                          18    Take Action on Climate
      04     Sustainability in Modern
                                                                Change and Use Fewer

                                                                                                          40
                                                                Natural Resources
             Agriculture: Highlights
             and Commitments                                                                                     Act with Integrity
                                                                                                                 and Transparency

EXECUTIVE SUMMARY          GROWING BETTER TOGETHER             BETTER PLANET             BETTER LIVES          BET TER PARTNER        3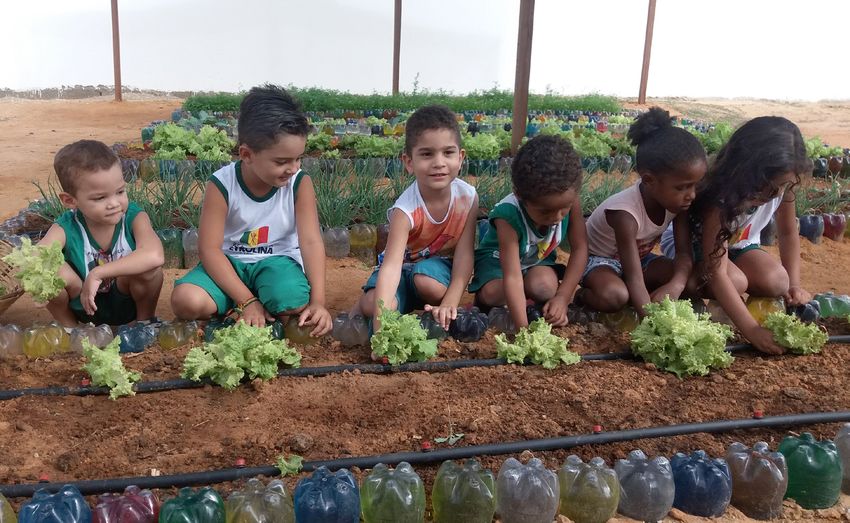
EXECUTIVE
SUMMARY

        F Sustainability in Modern Agriculture    05
        F Better Planet Highlights           		 07
        F Better Lives Highlights     			         08
        F Better Partner Highlights   			         09
        F Progress Against Commitments       		   10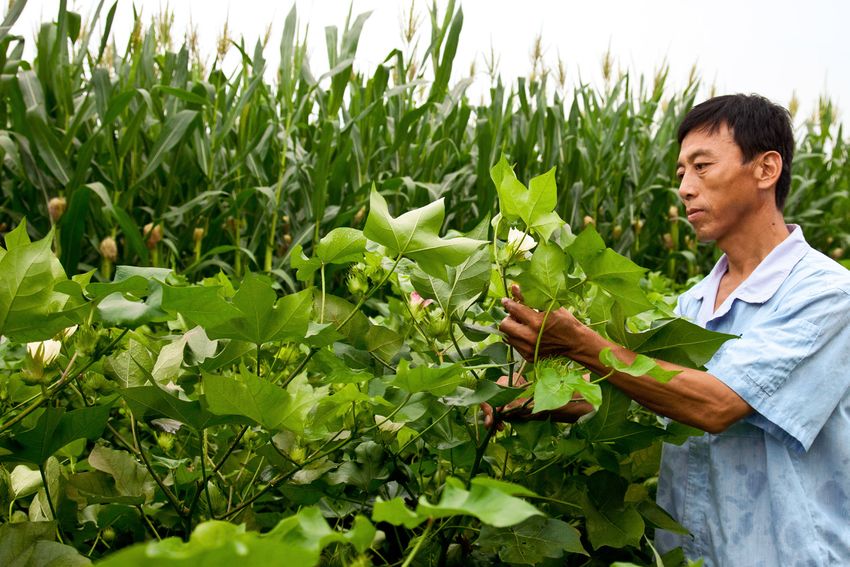
SUSTAINABILITY IN                 MODERN AGRICULTURE

   MODERN AGRICULTURE helps make farming more sustainable by giving farmers digital tools and other advancements to grow crops using fewer natural
   resources. At Monsanto, our sustainability strategy is all about Growing Better Together on a foundation of principled business and human rights across
   three main focus areas: Better Planet, Better Lives and Better Partner. We have established specific goals and commitments within each focus area
   (see table on Page 10), but these reflect just some of the work we are doing in each category.

                                                                               OUR APPROACH IS INFORMED by our own global materiality assessment
                                                                               (see Pages 15-16) and globally agreed upon agendas and accords like the
         By 2050 we must                                                       2030 Development Agenda of the United Nations and its 17 Sustainable
           collectively:                                                       Development Goals (SDGs) and the UN Global Compact, among others.
               Produce up to

           50%
                                                                               Monsanto’s work contributes to each of the 17 SDGs. Through an extensive mapping
                                                                               process, we have identified six SDGs that are particularly relevant to Monsanto's
                                                                               business and three that are of significant importance to how we work.

        MORE FOOD                                                              BETTER PLANET
                 GLOBALLY                                                      Take Action on Climate
                                                                               Change and Use Fewer
                                                                               Natural Resources
           DOUBLE
          THE FOOD
           SUPPLY                                                              BETTER LIVES
                                                                               Increase Food Availability and
        in areas of greatest need                                              Access, and Improve Lives for
                                                                               Farmers and Society

           AND FEED
           2.5B                                                                BETTER PARTNER
                                                                               Act with Integrity
      MORE PEOPLE                                                              and Transparency

         using the same amount
          of farmland as today
                                                           To quickly access information in this report that demonstrates how we’re supporting each of the 17 SDGs, please reference
        SOURCE: Adapted from information
                                                           the Reporting Index starting on Page 59.
        from the Food and Agriculture
        Organization of the United Nations

EXECUTIVE SUMMARY                     GROWING BETTER TOGETHER                 BETTER PLANET                         BETTER LIVES                    BET TER PARTNER                    5
SUSTAINABILITY IN MODERN AGRICULTURE

          A farmer makes 40+ key decisions that influence how successful their harvest
           will be each growing season. Modern agriculture provides the tools to help.

                     Improved Seeds                                      Ag Biologicals                                 Crop Protection Systems
               Biotechnology and advanced                         Microbials are applied to the                         A systems approach to crop
               breeding create seed varieties                    seed before planting to deliver                      protection with integrated pest
              that enable better harvests and                  more nutrients in early development.                    management reduces loss and
              more efficient use of resources.                  Some can help lower the carbon                        facilitates sustainable practices.
                                                                     footprint of agriculture.

                                                                           Digital Tools
                         Data science facilitates more precise agronomic decisions that improve the efficiency and sustainability of farming.

        Field Insights           Nutrient Management                Irrigation Water Application             Pesticide Application              Weather Data

EXECUTIVE SUMMARY              GROWING BETTER TOGETHER                    BETTER PLANET                 BETTER LIVES                BET TER PARTNER            6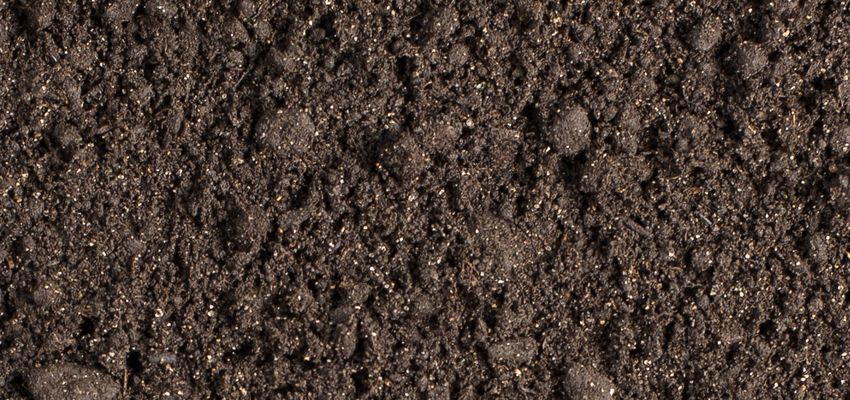
BETTER PLANET HIGHLIGHTS
    TAKE ACTION ON CLIMATE CHANGE AND USE FEWER NATURAL RESOURCES
                                                                                                                                               Reached our goal three years
                                                                                                                                               early to help farmers use
                                                          INVESTED                                                                             nutrients more efficiently and

                        70+
                    ESTABLISHED
                                                    $5M+                                                REACHED

                                                                                                      92 %
                                                                                                                                               curb GHG emissions on

              habitats for monarch
            butterflies at our facilities
                                                   annually in honey bee health
                                                       research since 2013                        of our goal to reduce
                                                                                                 GHG emissions intensity
                                                                                                                                               1M  acres in the U.S.
            through 2016, surpassing                                                            from our crop protection
                     our goal                                                                         operations by
                                                                                                      22% by 2020

Progressed toward                      IMPROVED OUR
   achieving a                       OVERALL IRRIG ATION                                                                                                               IMPROVED
                                                                                                                    CONTINUED TO
 CA RBON                             WATER APPLICATION                                                            HELP FARMER S USE                                     HABITATS

                                                                                                                          1/3
                                       EFFICIENCY TO

                                            77 %
                                                                                                                                                                 Since 2015, we’ve more
 NE UT RA L                                                                                                                                                     than doubled our number
FOOT PRI N T                                                                                                                                                     of sites certified by the
  by 2021 through                                                                                                                                                Wildlife Habitat Council
                                                                                                                   FEWER RESOURCES

                                                                                                                                                                  15 37
     operational                    and completed our third year                                                         PER UNIT                                         FROM
   improvements,                     as a United Nations CEO
 new products and                                                                                                   of corn, soybeans and
                                    WATER MANDATE Steering                                                             cotton by 2030                                       TO
working with contract                   Committee member
    seed growers

          COLLABORATED WITH
          CONSERVATION
          INTERN ATION AL
          TO HELP PROTECT
                                                5M ACRES of                 89%
                                                                                                        of our waste was diverted globally from landfills. Earned Gold
                                                                                                        Level Distinguished Zero Waste Facility Certification in Hawaii
                                                                                                        for diverting waste from landfills, incineration and the
                                                    FOREST                                              environment at our Upper Kunia, Hawaii Farm.
                          since 2008 and, in 2017, began building                                       Sites are reducing the amount of waste being sent to landfills
                           a multi-stakeholder coalition in Brazil                                      with a focus on waste minimization, recycling and reuse.

                                                                            More detailed information on progress against our goals can be found in the chart on Page 10.

EXECUTIVE SUMMARY                    GROWING BETTER TOGETHER                 BETTER PLANET                       BETTER LIVES                     BET TER PARTNER                            7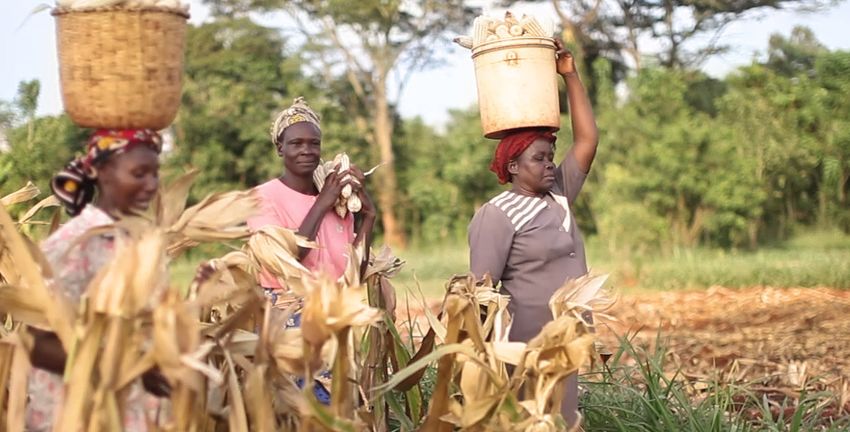
BETTER LIVES HIGHLIGHTS
  INCREASE FOOD AVAILABILITY AND ACCESS,
  AND IMPROVE LIVES FOR FARMERS AND SOCIETY

                                                                                                   Helped improve
                                                                                                   food security for                                          Established unified

                                                                                              1.5M PEOPLE
                TRAINED                                                                                                                                          approach to

     2.5M+
                                                         Continued to help
                                                        improve the lives of                                                                                  FOOD & NUTRITION

                                                            5M
                                                                                                                                                                 SECURITY to:
                                                                                                                    in sub-Saharan                            - Enable Consistent
           SMALLHOLDER                                                                                              Africa through our                          Availability
             FARMER S                                                                                               participation
                                                       RESOURCE-POOR                                                   in Water                                - Support Access
       on sustainable farming                           FARM FAMILIES                                                  Efficient                               - Promote Healthier Use
          practices in 2017                                by 2020                                                     Maize for
                                                                                                                       Africa
                                                                                                                       (WEMA)

   100K 400
    REACHED
                                                                                                                                                           Continued to help farmers

             FARMER S
                               in
                                    VILLAGES IN INDIA                                                                                                      DOUBLE
             through Project SHARE 2, an initiative to train
             smallholder farmers on sustainable agriculture                                                                                                YIELDS      BY 2030

                                                                                                                                                                  Corn, soybeans,
                                                                                                                                                                 cotton and canola

 3.7K
                                                                     86%
                             EMPLOYEES                                                                                           AWARDED

                                                                                                                          $6M
                 volunteered                                                              of our sites have

 90K+
                                                                                                                                                          IN GRANTS IN 2017
                                                                                          formal community
                                                                                                                                                          from Monsanto Fund to rural
                                                                     ENG AGEMENT PLANS                                                                    communities through the
                               HOUR S
                                                                     as of 2017, in pursuit of 100% by 2018                                               America’s Farmers programs
     across many countries in 2016
     (most recent data available; based on calendar year)

                                                                                     More detailed information on progress against our goals can be found in the chart on Page 10.

EXECUTIVE SUMMARY                          GROWING BETTER TOGETHER                    BETTER PLANET                       BETTER LIVES                     BET TER PARTNER               8
BETTER PARTNER HIGHLIGHTS
  ACT WITH INTEGRITY AND TRANSPARENCY

             CLEAN WATER, SANITATION
                                                                                                1,750
UNDERTOOK                                                                                       TRAINED
             AND HYGIENE PROJECTS                                                                                             COMPANY LEADERS
             at our facilities and in surrounding communities                                                                  in unconscious bias in 2017
             in support of our Water, Sanitation and Hygiene                                    bringing our total to 4,800 to meet our target of 5,000 by 2018
             (WASH ) commitment

         CONDUCTED                                                                                                     REDUCED BY
                                                                                                                                               our worker injury

       49K             AS SES SM ENT S                                                                                 49%                     severity rate since
                                                                                                                                               2011 in pursuit of a

             of our global business partners as part
             of our effort to advance human rights
                                                                                                                         50%             REDUCTION
                                                                                                                                           by 2020

                    IMPLEMENTED OUR

                    SUPPLIER           with 62K suppliers
                                       in pursuit of 100%                                    REACHED
                    CODE OF
                    CONDUCT
                                       implementation
                                                                                             18.4M+ PEOPLE                                           through 3,000+ in-person
                                                                                                                                                     Off-the-Job safety events
                                                                                                                                                     and social media

                               F 2017 Fortune Magazine World’s Most Admired Companies           F 2017 DiversityInc Top 50 Companies for Diversity
                               F 2017 Human Rights Campaign: Corporate Equality Index score of 100, earning Best Places to Work for LGBT equality
       EXT ER N AL             F 2017 Working Mother 100 Best Companies       F 2017 Military Friendly Employer        F 2017 Science Magazine Top 20 Employers
   R ECOG N IT I O N           F 2017 CPA-Zicklin Index – Named Trendsetter for Political Disclosures (score of 90+% )
                               F ComputerWorld Best Places to Work in IT 2017       FWildlife Habitat Council's Corporate Conservation Leadership Award

                                                                    More detailed information on progress against our goals can be found in the chart on Page 10.

EXECUTIVE SUMMARY           GROWING BETTER TOGETHER                  BETTER PLANET                       BETTER LIVES                     BET TER PARTNER                        9
PROGRESS AGAINST COMMITMENTS
BASELINE GOAL PROGRESS
FOCUS AREA GOAL/COMMITMENT YEAR YEAR 2015 2016 2017
Data modeling/sharing results, new products, operational improvements, working
Achieve operational carbon neutral footprint N/A 2021
with contract seed growers and farmers; offset 200K metric tons of CO²e
Reduce greenhouse gas emissions intensity by 22% on
2010 2020 73% of goal 89% of goal 92% of goal
a per product basis from crop protection operations
Better
Planet Increase irrigation water efficiency of global seed production by 25% 2010 2020 35% of goal 47% of goal 59% of goal
Help farmers use nutrients more efficiently and curb GHG emissions
2014 2020 20% of goal 20% of goal 100% of goal
on 1M U.S. acres
Percent of goal: Percent of goal: Percent of goal:
Help farmers use one-third fewer resources per unit Corn: 18% Corn: 43% Corn: 72%
2000 2030
of corn, soybeans and cotton¹ Cotton: 67% Cotton: 80% Cotton: 101%
Soybeans: 45% Soybeans: 40% Soybeans: 54%
Create monarch butterfly habitats at 70 of our facilities
2015 2016 Goal surpassed in 2016: 72 monarch habitats
in North America
Percent of goal: Percent of goal: Percent of goal:
Canola: 30% Canola: 44% Canola: 46%
Help farmers double yields in corn, soybeans, cotton and canola² 2000 2030 Corn: 21% Corn: 33% Corn: 35%
Cotton: 37% Cotton: 28% Cotton: 32%
Better Soybeans: 13% Soybeans: 21% Soybeans: 24%
Lives 4.2M 4.2M 4.4M
smallholder smallholder smallholder
farmers; $50B farmers; $50B farmers; $59.9B
Improve the lives of 5 million resource-poor farm families³ 2000 2020
in additional in additional in additional
net income net income net income
(since 2008) (since 2008) (since 2008)
Increase annual training of smallholder farmers on sustainable
2017 2020 N/A N/A 2.5M
farming practices from about 2.5 million to 4 million
Production sites: 100% Production sites: 100%
Establish sustainability and community engagement site plans Production sites:
2016 2018 Plant Breeding Plant Breeding
at 100% of our breeding and production sites 100%
sites: 20% sites: 66%
Continuous improvement of sanitation at company-operated sites
Ongoing See Page 48
to fulfill WBCSD WASH pledge
Better Continue to assess business partners in seed production fields
Partner to eradicate child labor
Ongoing See Page 48
2011
Reduce worker injury severity index by > 50% (Index = 1.36 ) 2020 Index = .74 Index = .70 Index = .70
Train 5,000 employees, with a focus on our leaders, to advance 4,800 since 2014
2014 2018
inclusion and collaboration 1,750 in 2017
Implement the Supplier Code of Conduct across 100% of our
Ongoing 100%
global supply chain
To review the footnotes contained in this chart, click on any footnote to be taken to Page 67 or simply visit that page.
EXECUTIVE SUMMARY GROWING BETTER TOGETHER BETTER PLANET BETTER LIVES BET TER PARTNER 10GROWING
BETTER
TOGETHER
at Monsanto
F Our Company 12
F Sustainability Governance and Engagement 14
F Sustainability Material Topics 15
11OUR COMPANY
GROWING BETTER TOGETHER AT MONSANTO
Monsanto is a modern agriculture company, helping farmers large and small grow food more sustainably. From seed to software, we’re developing tools
to help growers protect natural resources while providing nourishment to the world. In the face of a changing climate and other environmental challenges,
we help to ensure our agricultural systems continue to suit the needs of everyone.
We are a diverse collection of more than 20,000 food enthusiasts, moms and dads, innovators, botanists, farmers and thinkers. Through programs
and partnerships, we collaborate with others to help tackle some of the world’s biggest challenges.
Global Locations with
S T. Significant Operations:
LO U I S, ~350 F A C I L I T I E S
in 60 C O U N T R I E S
MISSOURI,USA
Global Headquarters
2017 Revenue:
$14.6B 20K+
Employees Globally
See our 2017 Form 10-K for
Complete Financial Information See our 2017 Form 10-K for details
EXECUTIVE SUMMARY GROWING BETTER TOGETHER BETTER PLANET BETTER LIVES BET TER PARTNER 12OUR COMPANY
INVESTING IN AN INDUSTRY LEADING PRODUCT PORTFOLIO
Best in class. Safe. Sustainable. We are dedicated to providing farmers innovative, high-quality crop production products and services that are most effective when
used as part of an integrated systems approach. For more information visit our website.
Seeds and Traits
We use plant breeding and modern
Global Licensing of new
scientific techniques to develop Gene-editing Techniques
row crop and vegetable seeds that
enable better harvests while using Gene-editing techniques, including CRISPR-Cas, offer scientists another way to integrate
resources more efficiently. the most desirable plant traits into seeds for farmers with more efficiency and precision
than ever before. While we have been researching gene-editing techniques for years,
we’ve recently announced several licensing agreements with the Broad Institute
(September 2016, January 2017 ), Dow AgroSciences, TargetGene Biotechnologies,
Crop Protection ToolGen and Nomad Bioscience to integrate additional technology into our portfolio.
We work to create sustainable
solutions to help protect crops,
promote plant health and
minimize environmental impact. MONSANTO GROWTH VENTURES
10
Monsanto Growth Ventures (MGV), the venture capital arm of our company, has invested in about a
dozen independent companies that are contributing to advancements in agricultural productivity,
1 01
01
digital agriculture and biologicals. Some examples are highlighted below. Learn more on our website.
1 0
1 Data Science
We help farmers use data,
algorithms and simulations to
farm more sustainably. With Discovers and Works to transform Uses computer vision
information at their fingertips, develops biologicals, field pennycress and machine learning for
they can make decisions in real traits and innovative into a commercially precision weeding and
time about how best to apply biofungicide products viable cover crop herbicide application
resources, increasing efficiency.
EXECUTIVE SUMMARY GROWING BETTER TOGETHER BETTER PLANET BETTER LIVES BET TER PARTNER 13SUSTAINABILITY GOVERNANCE AND ENGAGEMENT
Governing and Managing Our Sustainability Commitments For more information on our governance structure, please see Page 56 and our Reporting Index.
BOARD OF Reviews and EXECUTIVE Assesses global challenges and A cross-functional team of leaders who have
DIRECTORS monitors our SUSTAINABILITY opportunities, sets direction, specific responsibilities for aligning and embedding
SUSTAINABILITY overall corporate AND PRODUCT reviews goals and commitments, OFFICE OF sustainability throughout the company. Accountable
AND CORPORATE sustainability STEWARDSHIP and aligns the resources SUSTAINABILITY to the ESPSC and works closely with our Global
RESPONSIBILITY performance. COMMITTEE needed to achieve them. Business Operations and Executive Teams.
COMMITTEE (ESPSC)
Working Collaboratively and Transparently
We interact in a transparent way with organizations and individuals on an ongoing basis as part of regularly planned visits, technical
seminars, conferences and updates. Although the frequency and types of our engagements vary, the intent to stay engaged in areas of External Charters
mutual interest is foremost in our minds. We have also developed and co-sponsored online forums where consumers can ask questions and Principles
about where their food comes from and other topics of interest. These include The Conversation, La Conversación, GMO Answers Monsanto’s policies and business activities
and Hablemos Claro. are informed by a variety of external
We engage with stakeholders that have interests in agriculture production • water • soil health • human rights charters and principles. Some of these
• climate change • food and nutrition security • biodiversity • food labeling • science and technology • business practices include, but are not limited to:
• innovation • inclusion and diversity • youth development • community health and other topics related to our business. F American Business
Act on Climate Pledge
This table provides just a sampling of the numerous stakeholders with whom we engage around the world. F Customs-Trade Partnership Against
Terrorism (C-TPAT)
ADVOCACY AND PROFES SIONAL GROUPS F International Labour Organization’s
Fundamental Principles
1890s Land Grant Institutions • Academy for Nutrition and Dietetics • African Agricultural Technology Foundation (AATF )
and Rights at Work
• Borlaug Training Foundation • Business for Social Responsibility (BSR ) • Climate Leadership Group • Field to Market Alliance
• Honey Bee Health Coalition • Institute for Sustainable Agriculture • International Institute of Tropical Agriculture (IITA) F Privacy and Security
• National Black Growers Council • Network USA of United Nations Global Compact • Soil Health Partnership Principles for Farm Data
• Wildlife Habitat Council • World Economic Forum (WEF ) New Vision for Agriculture F Sustainable Development Goals
INDUSTRY GROUPS F United Nations Global Compact
(UNGC)
American Production and Inventory Control Society (APICS) • Biotechnology Innovation Organization • Clean Cargo Working Group
F UNGC CEO Water Mandate
(CCWG) • Council of Supply Chain Management Professionals (CSCMP) • CropLife International and Regional CropLife entities
• Excellence Through Stewardship • Global Sourcing Council • Grocery Manufacturers Association • International Seed Federation F Universal Declaration
• National and Regional Seed and Crop Industry Associations • National, Regional and Local Farmers' Associations of Human Rights
F World Business Council on
DIVER SIT Y GROUPS
Sustainable Development
Black Data Processor Association • Business and Professional Women's Foundation • DiversityInc. • Federacion Mexicana (WBCSD) WASH Pledge
De Empresarios LGBT (FME LGBT ) • Integrare • Mid-States Minority Supplier Development Council • National Gay and Lesbian
Chamber of Commerce (NGLCC ) • National Minority Supplier Development Council (NMSDC ) • Society of Women Engineers
• Southern Regional Minority Supplier Development Council • St. Louis Minority Business Council • Veteran Business Resource Center
• Vital Voices • WEConnect International • Women’s Business Development Center (WBDC ) • Women’s Business Enterprise Council
South • Women’s Business Enterprise National Council • Women’s Minority Business Development Agency Business Center Chicago
EXECUTIVE SUMMARY GROWING BETTER TOGETHER BETTER PLANET BETTER LIVES BET TER PARTNER 14SUSTAINABILITY MATERIAL TOPICS
MONSANTO WORKED WITH Business for Social Responsibility (BSR) to identify the sustainability topics that matter most to the success of our company and to our
many stakeholders, both internal and external. This process, known as a materiality assessment, was conducted in 2015, and we expect the results to be relevant for at least
several years. The assessment is designed to inform our sustainability strategy, business actions and the content of this report.
The chart below summarizes the identified
topics and how they map with perspectives
from external stakeholders and across our
ry
global business. Please visit our website for
st
du
detailed definitions of each material topic.
a
a
In
ic
ic
t
a
er
er
in
en
s
si
s
er
o
ra
Am
Am
ic
rs
/A
m
nt
s
s
um
em
/G
lie
rn
er
er
pe
sa
a
h
th
s
od
m
m
pp
ve
ad
ric
ns
GO
ro
ut
on
Material Topics
or
r
r
Fo
Go
Co
Ac
So
Eu
Su
Fa
Fa
Af
M
N
N
Product Safety and Stewardship • • • • • • • • • •
Modern, Innovative Agricultural
• • • • • • • • • • •
Technologies and Products
Climate Change Mitigation and Adaptation • • • • • • • • • • • •
Sustainable Chemistry • • • • • • • • • • •
Water Consumption and Management • • • • • • • • • • • Stakeholders that identified
topic as important
Business Practices and Competition • • • • • • • • • •
Global Hunger and Nutrition Security • • • • • • • • • • •
Business Ethics and Transparency • • • • • • • • • •
Positive Relationships with Local
• • • • • • • • • •
Communities and Society
Regulatory Approval Systems • • • • • • • •
Serving Smallholder Farmers • • • • • • •
Regions where Monsanto employees
Land Use and Deforestation • • • • • • • • • • • identified topic as important
Soil Health • • • • • • • • • • •
Human Rights • • • • • • • • • • • •
Patents and Plant Variety Rights • • • • • • • • • •
Talent Management, Diversity and Benefits • • • • • •
Food Labeling • • • • • • • • •
Biodiversity and Ecosystems • • • • • • • • • • •
Occupational Health, Safety and Wellness • • • • • •
Where in our business
Data Security, Management and Access • • • • • • • value chain impacts occur
Political Spending • • • • • • •
EXECUTIVE SUMMARY GROWING BETTER TOGETHER BETTER PLANET BETTER LIVES BET TER PARTNER 15SUSTAINABILITY MATERIAL TOPICS/COMMITMENTS
CONNECTING COMMITMENTS TO MATERIAL TOPICS
Most of our sustainability commitments relate to multiple material topics,
ts
and virtually all of our material topics are positively impacted by at least
uc
od
one of our commitments. The chart below draws these connections,
Pr
s&
some of which may be more obvious than others. In addition to setting
es
ie
og
iti
n
commitments, we manage our material topics through an array
un
ol
s
tio
es
hn
m
ta
ln
t
om
y
en
ec
of policies, positions and other guiding principles, including
el
ap
rit
n
s
lT
W
em
io
lC
fit
Ad
ts
cu
y
tit
ra
nc
ne
gh
y&
p
those topics for which we have not established formal
ca
ag
Se
s
s
hi
&
tu
pe
m
re
n
er
Be
Ri
Lo
an
ds
et
io
n
ul
on
te
s
pa
m
rm
m
tio
ty
M
at
af
commitments, such as Food Labeling, Data Security
ar
ric
&
w/
ys
Co
iti
ns
te
ie
,S
Fa
st
ew
&
ga
ity
ry
lS
Ag
tr
ps
ar
ys
a
re
lth
s&
n
ist
iti
Tr
Nu
er
rs
va
St
Management and Access, and Political Spending.
tV
hi
os
io
fo
e
M
ve
ea
ld
em
ro
tiv
ns
&
i ce
pt
y&
Ec
De
an
&
ho
Di
ge
lH
pp
ics
io
va
um
Ch
ct
er
Pl
ts
&
et
d
all
lat
an
t,
no
yA
na
th
ra
ng
an
gh
ns
nd
af
ity
gm
le
Sm
Ch
Re
lth
sP
sE
io
In
tS
Hu
Ri
or
ab
Co
rs
sa
e
M
at
ea
Us
n
i ve
es
es
e
g
lat
i ve
ain
uc
an
er
up
nt
at
al
in
er
nt
il H
G Commitment Topic F
sin
sin
sit
gu
nd
m
od
ob
od
od
im
rv
te
st
at
cc
le
Hu
Bu
Bu
Po
So
Su
Re
Se
Pa
La
Ta
Pr
W
Gl
Cl
Bi
M
O
Achieve operational carbon neutral footprint • • • • • • • • • • •
Reduce greenhouse gas emissions intensity by 22%
on a per product basis from crop protection operations • • • • • • • • • •
Increase irrigation water efficiency of global seed production
by 25% • • • • • • • • • • •
Help farmers use nutrients more efficiently and curb
GHG emissions on 1M U.S. acres • • • • • • • • • • •
Help farmers use one-third fewer resources per unit
of corn, soybeans and cotton¹ • • • • • • • • • • • • • •
Create monarch butterfly habitats at 70 of our facilities
in North America • • • • • •
Help farmers double yields in corn, soybeans, cotton and canola³ • • • • • • • • • • • • •
Improve the lives of 5 million resource-poor farm families⁵ • • • • • • • • • • • • • •
Increase annual training of smallholder farmers on sustainable
farming practices from about 2.5 million to 4 million • • • • • • • • • • • • • •
Establish sustainability and community engagement site plans
at 100% of our breeding and production sites • • • • • • • • •
Continuous improvement of sanitation at company-
operated sites to fulfill WBCSD WASH pledge
• • • • •
Continue to assess business partners in seed production fields
to eradicate child labor
• • •
Reduce worker injury severity index by > 50% • • • •
Train 5,000 employees, with a focus on our leaders, to advance
inclusion and collaboration
• •
Implement the Supplier Code of Conduct across 100% of our
global supply chain • • • • • • • • • • • • • •
EXECUTIVE SUMMARY GROWING BETTER TOGETHER BETTER PLANET BETTER LIVES BET TER PARTNER 16BETTER
PLANET
F Better Planet: Management Approach 18
F Driving Climate-Smart Agriculture 19
F Product Breakthroughs 23
F Managing Water Resources 24
F Advocating for Biodiversity 25
F Environmental Footprint Data 27
EXECUTIVE SUMMARY GROWING BETTER TOGETHER BETTER PLANET BETTER LIVES BET TER PARTNERBETTER PLANET MANAGEMENT APPROACH
Our commitment to a Better Planet is managed strategically from within and in collaboration with many
external stakeholders. We have established a portfolio of guidelines, position statements and best practices
that inform our actions, and we have voluntarily set ambitious environmental goals (see Page 10). We evaluate
the effectiveness of these management systems in light of progress against our goals and input from external stakeholders.
M AT E R I A L TO P I C S CO V E R E D
CLIMATE CHANGE WATER
SUSTAINABLE LAND USE & SOIL BIODIVERSITY
MITIGATION & CONSUMPTION
CHEMISTRY DEFORESTATION HEALTH & ECOSYSTEMS
ADAPTATION & MANAGEMENT
Our Environmental Management Guidelines highlight our commitment We have committed to achieving a carbon neutral footprint
to environmental management systems such as ISO 14001. Notably, by 2021 and are promoting climate-smart crop production in the
100 percent of our global crop protection chemical production sites are broader agriculture industry in a manner aligned with the USDA’s
externally validated through the ISO 14001 or RC14001® and all of our seed 10 Building Blocks for Climate-Smart Agriculture plan. Soil health
production locations have comprehensive environmental management is central to both our climate action strategy and our approach to
systems in place. We periodically audit all of our manufacturing and biodiversity. The initiatives and collaborations outlined in this section detail
research and development locations and regularly report the progress how we’re working to mitigate climate change through reducing agriculture
to the highest levels of management and our board of directors. related emissions and helping farmers around the world adapt to its effects.
ENVIRONMENTAL MANAGEMENT CLIMATE ACTION & SOIL HEALTH
BIODIVERSITY WATER
Our Biodiversity Position aligns with the United Nations Convention We map water risks at all of our facilities across the globe using the
on Biological Diversity, our business goals and the needs of farmers World Resources Institute Aqueduct Map and create risk management
and society. It consists of the following components: plans as needed. We have set a broad-based irrigation water application
• Protect species • Promote sustainable landscapes efficiency goal that encompasses our contract seed growers. Monsanto
is also a member of the UN Global Compact CEO Water Mandate, and
• Preserve and improve plant varieties and share benefits
we’re in our third year of serving on the Mandate’s Steering Committee.
EXECUTIVE SUMMARY GROWING BETTER TOGETHER BETTER PLANET BETTER LIVES BET TER PARTNER 18DRIVING CLIMATE-SMART AGRICULTURE
CLIMATE CHANGE is one of the biggest challenges we face in agriculture, as well as one of the most pressing challenges facing humanity. According to the World
Economic Forum, climate change is fourth on the list of top global challenges. It is bad for the environment, bad for agriculture and poses a threat to food security.
Year after year, farmers have had to adapt to severe droughts, unpredictable temperatures and more erratic precipitation and weather patterns.
GLOBAL
24% MODERN AGRICULTURE AND CLIMATE-SMART
of human-related GHG emissions PRACTICES ARE PART OF THE SOLUTION
GREENHOUSE
GAS come from agriculture, forestry Digital tools and other advancements enable farmers
to help mitigate climate change and adapt to its effects
EMISSIONS
and other changes in land usage. on agricultural productivity, while continuing to be a positive
Fifth Assessment Report of the force in the fight against it.
Intergovernmental Panel on Climate Change
CLIMATE-SMART PRACTICES
BIOTECH REDUCED COVER MICROBIALS HIGHLY DATA ENABLED
SEEDS & CROP TILLAGE CROPS Promote PRODUCTIVE PRECISION AG
PROTECTION Helps protect Protect root growth CROPS Enables better
Enables no-till soil structure soil between and nutrient Improve harvests informed decisions
farming and keeps carbon growing uptake and land use about applying inputs
in the soil seasons
ABSORBS CARBON CUTS CARBON
from the atmosphere emissions from tilling
BENEFITS OF
CLIMATE-SMART
PRACTICES RETURNS CARBON STORES CARBON
to the soil in the soil
EXECUTIVE SUMMARY GROWING BETTER TOGETHER BETTER PLANET BETTER LIVES BET TER PARTNER 19DRIVING CLIMATE-SMART AGRICULTURE: OUR PATH TO CARBON NEUTRALITY
GETTING TO CARBON NEUTRALITY AT MONSANTO ... AND BEYOND
Agriculture is uniquely positioned to deliver climate change solutions. Monsanto is committed to achieving an operational carbon neutral footprint by 2021.
But collectively we can and need to do even more. That’s why we’re leading by example as we engage in collaborations with business partners, NGOs, farmers and
others to advance environmental sustainability and reduce the global carbon footprint of agriculture.
TAKING A PORTFOLIO APPROACH TO CARBON NEUTRALITY
AT MONSANTO AND PROMOTING CLIMATE-SMART AGRICULTURE
IMPROVEMENTS WITHIN JOINT EFFORTS WITH FARMERS BREAKTHROUGH PRODUCTS
OUR OPERATIONS AND GLOBAL PARTNERS Our product portfolio will play
We have reduced the carbon intensity of our F WIDESPREAD ADOPTION an important role in achieving our
crop protection business and offset our carbon of climate-smart products and goal and in helping to reduce the carbon
footprint by more than 200K metric tons through: practices by commercial farmers footprint of agriculture. Examples include:
F Driving annual greenhouse can dramatically reduce agriculture’s F MICROBIALS and other products have
gas emission reductions through carbon footprint significant potential to help crops absorb
operational improvements like energy F We have joint efforts in place with and store more greenhouse gas in the soil
efficient technologies, cleaner power six leading retail partners to F DIGITAL TOOLS help farmers optimize
and investments in alternative drive adoption of climate-smart resources like nitrogen that can have
energy sourcing practices a positive impact on reducing
F Working with our contract seed F We expect more than 100 farmers greenhouse gas emissions
growers to encourage climate-smart to participate
crop production methods
EXECUTIVE SUMMARY GROWING BETTER TOGETHER BETTER PLANET BETTER LIVES BET TER PARTNER 20DRIVING CLIMATE-SMART AGRICULTURE: OUR PROGRESS
~$1M
in annual savings Improving
Applying Expertise
and Rigor to Our
501 Transportation
metric tons
By implementing digital tools
Carbon Neutral Converting to that increase real-time decision-
LED Lighting
Commitment of greenhouse making and help standardize
Our seed production and crop gas emissions end-to-end transportation
We established the protection sites in Brazil are processes around the world,
avoided
Carbon-Neutral Collaborative, converting thousands we’ve cut costs Example: 2016-2017
a group of experts in agricultural of conventional light and saved fuel. Results in Brazil
greenhouse gases, to help chart bulbs to LED technology.
our path to carbon neutrality and LEDs consume less power, TAKING CLIMATE
provide advice. last longer and create
ACTION INSIDE
The National Corn Growers
Association (NCGA), Monsanto
less waste.
1.4M
miles of vehicle travel eliminated
and others joined forces to
develop a formal accounting
framework to measure how
Converting to
Cleaner Burning
2.5K
estimated metric
agricultural practices can Natural Gas
tons of greenhouse
mitigate greenhouse gas
emissions. Together, we applied 42K Our Muscatine, Iowa, plant’s
boiler, used to provide
gas emissions
avoided annually
for and secured a USDA metric tons of greenhouse steam for operations, was
Conservation Innovation gas emissions expected converted from coal to
Grant of $1M to match to be avoided annually cleaner burning natural
Monsanto’s contribution gas in September 2017.
of $1.6M and in-kind giving
of resources.
QUANTIFYING AGRICULTURE’S ABILITY TO COMBAT CLIMATE CHANGE
Monsanto commissioned third-party expert ICF International to study agriculture’s potential for reducing greenhouse gas emissions in the
U.S. Corn Belt. The resulting report concluded that widespread adoption of sustainable farming practices could reduce over 100M metric tons of emissions.
100M Metric Tons EQUALS 21M Automobiles
of emissions potentially taken off the road
eliminated by 2030 annually
EXECUTIVE SUMMARY GROWING BETTER TOGETHER BETTER PLANET BETTER LIVES BET TER PARTNER 21DRIVING CLIMATE-SMART AGRICULTURE: COLLABORATIONS
Great progress has already been made to reduce agriculture’s carbon footprint. But, to sustainably feed 9.6 billion people by 2050, we must work collectively to
do even more.
SOIL HEALTH PARTNERSHIP ( SHP ) HEALTHY SOIL FIGHTS
Monsanto has invested significantly in better understanding prosperous, productive soils and the CLIMATE CHANGE
modern agriculture practices that promote soil health. We are a founding sponsor and steering
team member of the Soil Health Partnership (SHP), an initiative of the National Corn Growers
Healthy, untilled soil stores carbon that’s
Association (NCGA). We are working with SHP, the Walton Family Foundation, other industry
been absorbed through crops and plant
leading companies and key environmental NGO advisors to optimize and increase climate-smart
materials and keeps it from the air where
farming adoption, improve soil health and provide economic and environmental benefits.
it might otherwise have contributed to
climate change.
MIDWEST ROW CROP
COLLABORATIVE
111 $1M $1.6M
Monsanto actively serves in the Midwest Row
Crop Collaborative, a collaboration of nine
major corporations focused on improving
FARMS ACROSS NINE grant from the U.S. Department investment from Monsanto the environmental impacts of the agriculture
MIDWESTERN STATES of Agriculture — Natural Resources to support the pursuit of value chain, starting with essential practices
participated in field testing Conservation Service to NCGA a framework to account that improve soil health on U.S. farmlands.
to help quantify the impact for the environmental Monsanto joined forces with Cargill, General
of climate-smart farming benefits of farm systems Mills, Kellogg’s, Land O’Lakes, McDonald’s,
practices and to match PepsiCo, UniLever and Walmart to support
agricultural systems approaches to improve
soil health, protect watersheds and steward
the environment.
CLIMATE-SMART AGRICULTURE 2018-2020 LCTPi ACTION AREAS: 1) Build Resilience and 2) Implement Sustainable Land-Use
(CSA) WORKING GROUP Commitments and Zero Agriculture-Driven Deforestation through additional partnerships, financial
Kellogg's, PepsiCo, Monsanto and Olam, products, field tests and scale-up activities.
co-chair the CSA Working Group, which is part of
WBCSD’s Low Carbon Technology Partnerships “Working with the CSA has had the dual benefits of making
initiative (LCTPi) aiming to expand adoption of me a more productive and sustainable farmer while also
climate-smart agricultural systems worldwide.
See the Low Carbon Technology Partnerships
helping to address climate change.”
Initiative Report 2017 for more information. - Fred Yoder, Row Crop Farmer, United States
EXECUTIVE SUMMARY GROWING BETTER TOGETHER BETTER PLANET BETTER LIVES BET TER PARTNER 22PRODUCT BREAKTHROUGHS
BIODIRECTTM TECHNOLOGY
We are developing products that
engage a naturally occurring process
called RNA interference (RNAi) to Agricultural Biologicals are derived from MICROBIALS
NATURAL MATERIALS A tablespoon of soil contains
help farmers protect crops against
or use around 50 billion naturally occurring
damaging pests and weeds.
microbes. Microbes have been used
NATURALLY OCCURRING in our food for thousands of years.
processes to provide benefits to crops For agriculture, products containing
these tiny organisms can be applied
to the surface of seeds to complement
The Climate Corporation , a Monsanto subsidiary, aims to help farmers — or provide an alternative to —
sustainably increase their productivity with digital tools. chemical agricultural products.
Through the BioAg Alliance, we’re
120M acres of farmland mapped Manual Fertility Scripting partnering with Novozymes on research
in The Climate Corporation’s FieldView™ platform, is The Climate Corporation’s next step and development of microbial technology
the most widely adopted digital agriculture platform in developing a comprehensive fertility solution to improve productivity of crops around
in the industry. In January 2017, The Climate for farmers. Farmers can create a customized the world.
Corporation announced its industry-leading R&D management plan for nitrogen, phosphorus,
pipeline of more than 35 projects, the first in-depth potassium and lime tailored to their unique Benefits for Crops:
pipeline of its kind in the digital agriculture industry. goals, saving time, optimizing inputs and F Make better use of nutrients
In August 2017, the company announced that it’s improving on-farm productivity. In addition
continuing to help move farming forward with several to new fertility prescription tools, Climate F Enhance root growth
projects advancing quickly through its innovation FieldView offers nitrogen monitoring tools F Protect against pests and disease
pipeline to help farmers harness their data that can help farmers use nitrogen more
F Improve tolerance to harsh weather
to identify and better manage variability in their efficiently, reducing impacts from greenhouse
fields, tailoring inputs to sustainably optimize yield. gas emissions and water runoff.
Today, BioAg
Alliance products
80M
Acres
are used on
By 2025,
estimated
product
250-500M
use is Acres Globally
EXECUTIVE SUMMARY GROWING BETTER TOGETHER BETTER PLANET BETTER LIVES BET TER PARTNER 23MANAGING WATER RESOURCES
USING WATER
UN CEO WATER MORE EFFICIENTLY
MANDATE
Fresh In support
25% in irrigation water
water
Monsanto is a member
of our goal efficiency of global
of the UN Global Compact increase
to achieve a seed production by 2020
CEO Water Mandate and
was invited to serve on the is becoming
increasingly scarce,
9.6M+
Mandate’s Steering Committee Because droughts can last for years
for a third year. so we must optimize our
in India, we installed harvesting pits
water use and provide farmers Liters of that collect rainwater at our breeding
with tools to do the same, while rain water and supply chain sites in Bangalore
also helping them adapt in times recycled and Hyderabad.
of water scarcity. Better use
of this precious resource also
protects water quality and
reduces the potential for 15-20% using sub-surface drip irrigation
and soil moisture sensors
nutrient runoff. Water in South America at our
Reduction research sites in Brazil
ADDRESSING and Chile.
WATER RISKS
2015: Mapped water risks
at all of our global facilities
using the World Resources Institute
Aqueduct Map. Identified 14 facilities
in high-risk areas and developed HydroBio was acquired
corrective action plans by our subsidiary The Climate
2016: Tracked progress against Corporation after being a part PURSUING GLOBAL
plans; identified and shared of Monsanto Growth Ventures’ IRRIGATION EFFICIENCY
best practices investment portfolio. Using
satellite imagery, soil data and We installed high efficiency drip
2017: Remapped water risks and and center pivot irrigation systems
hyper-local weather data, HydroBio
reduced high-risk designations in production fields located in France,
helps farmers improve water-use
to 13 facilities, which continue Hungary and Romania and continue
efficiency and gain better harvests.
to make progress to update our irrigation systems
in Argentina, Brazil and the
United States.
EXECUTIVE SUMMARY GROWING BETTER TOGETHER BETTER PLANET BETTER LIVES BET TER PARTNER 24ADVOCATING FOR BIODIVERSITY
MODERN AGRICULTURE PRACTICES can positively affect biodiversity. Through our efforts and
collaborations, we’re working to protect species and promote sustainable landscapes. Learn more online.
BIODIVERSITY
Supporting is the variability among
living organisms from all
the Flight of NATIONAL FISH AND WILDLIFE sources, including terrestrial
the Monarch FOUNDATION (NFWF) and aquatic ecosystems and the
Each year, in one Monsanto is the primary corporate funder ecological complexes of which
of the NFWF Monarch Butterfly Conservation they are part; this includes
of nature’s greatest
Fund, a partnership that supports priority diversity within species,
spectacles, monarch between species and
butterflies migrate from conservation needs.
of ecosystems.*
parts of the United States
and Canada to a winter MONSANTO COMMITMENT
site in Mexico. For a variety
of reasons, the monarch $3.6M over three years,
starting in 2014
populations that make
this trip are declining, Activity 2017 To Date
which is why we are With our financial
collaborating on outreach support Monarch
and habitat expansion Projects Funded 23 70 Watch has produced
to promote a resilient and distributed 200,000
monarch population. Acres Restored/ milkweed plants, the
Enhanced 43,000+ 127,000+ only source of food for
monarch caterpillars.
Monarch Sanctuary
In February 2017, Monsanto and others Seedlings
visited Reserva de la Biosfera Mariposa Planted 131,000 790,000
Monarca, the winter home to millions We’re working with
of monarch butterflies in Mexico as part collaborators on a program
of an immersion experience to bring U.S. Workshops/
Webinars Hosted ~210 ~730 that encourages farmers
agriculture and conservation leaders to participate in voluntary
together to help preserve species. conservation efforts to
See HuffPost for more information. increase monarch habitats.
*Biodiversity definition adapted from the UN Convention on Biological Diversity
EXECUTIVE SUMMARY GROWING BETTER TOGETHER BETTER PLANET BETTER LIVES BET TER PARTNER 25ADVOCATING FOR BIODIVERSITY
Investing in Honey Bee Health
Habitats and
Sustainable Landscapes
1 in 3 Bites of Our Food 5M ACRES with improved
protection since 2008 70 + POLLINATOR-FRIENDLY
HABITATS planted at our
Relies on Honey Bee Pollination in partnership with
Conservation International with
sites in conjunction with
Pheasants Forever
37
Honey bees face many challenges to their health, especially whom we’re now building a coalition
HABITATS CERTIFIED
the parasitic varroa mite. We are working hard with strategic of farmers, government and
by the Wildlife Habitat
partners to help find solutions to this complex challenge. agribusiness to deliver climate-
Council (WHC ) at
smart agriculture practices in Brazil
Monsanto sites
We played a significant role in the formation of the Honey Bee
Health Coalition (HBHC) and remain active in the organization. AWARDED THE 2017 CORPORATE CONSERVATION
LEADERSHIP AWARD, WHC’S TOP RECOGNITION
70K U.S. farmers received $100 million in incentives
from Monsanto for using Roundup Ready PLUS®
Crop Management Solutions, a platform to encourage
the use of multiple herbicides from different companies
HBHC RECENT ACTIVITIES HBHC FAST FACTS to guard against weed resistance.
Tools for Varroa Management • 40 members from
guidebook (sixth edition) downloaded nonprofits, government, Responsible and Systematic Pest Control
50,000 times, developed by HBHC academia and business Farmers seek systematic ways to protect their fields from weeds, disease
with help from Monsanto • Convened by the and insects. Modern agriculture offers farmers increased precision, more
Keystone Policy Center effective crop protection approaches, and digital tools that can help them
The Bee Integrated Demonstration
• Supports a apply the protection needed in the right amount, in the right place and
Project will bring together
healthy honey at the right time. Innovation and increased precision supports an integrated
beekeeper-farmer pairs to show
bee population pest management (IPM) system, helping farmers use resources more
how a suite of best practices
efficiently and effectively.
can be implemented together
in agricultural landscapes
The Bee Nutrition Challenge
Innovation Award is an HBHC
contest seeking creative, practical
solutions to accelerate and pioneer
$5M+ Invested annually by Monsanto in R&D on varroa mites – the largest
factor in the decline of honey bees. Field trials to test a topical
the field of honey bee nutrition treatment applied to honey bee hives are underway.
EXECUTIVE SUMMARY GROWING BETTER TOGETHER BETTER PLANET BETTER LIVES BET TER PARTNER 26ENVIRONMENTAL FOOTPRINT DATA
CROP PROTECTION SEEDS & TRAITS COMPANY TOTALS
See page 68 for Independent Data Assurance Statement.
FY '15 FY '16 FY '17 FY '15 FY '16 FY '17 FY '15 FY '16 FY '17
ENERGY CONSUMPTION
Direct Energy Consumption (1000 gigajoules) - Scope 1 10,600 9,640 9,910 3,690 2,700 2,960 16,500 14,400 15,100
Natural Gas and Other Gaseous Fuels 6,230 5,460 5,700 2,800 1,900 2,140 9,030 7,360 7,840
Oil (including Diesel) 423 444 569 891 797 820 3,530 3,320 3,650
Coal, Coke and Other Solid Fuels 1,360 1,300 1,180 0.2 0.4 0.2 1,360 1,300 1,180
Waste Fuel 2,590 2,440 2,460 - - - 2,590 2,440 2,460
Indirect Energy Consumption (1000 gigajoules) - Scope 2 8,980 8,860 8,790 1,880 1,650 1,730 10,900 10,500 10,500
Purchased Electricity 6,910 6,780 6,790 1,880 1,650 1,730 8,780 8,420 8,520
Purchased Steam 2,070 2,080 2,000 - - - 2,070 2,080 2,000
Primary Sources in Electricity Generation
Hydro, Biomass, Geothermal, Nuclear, Solar, Wind 49% 57% 48% 37% 36% 36% 46% 53% 45%
Natural Gas and Other Gaseous Fuels 18% 16% 15% 19% 18% 15% 18% 16% 15%
Coal, Coke and Other Solid Fuels 31% 26% 36% 38% 42% 45% 33% 29% 38%
Oil (including Diesel) 1% 1% 1% 6% 4% 4% 3% 2% 2%
Total Energy Consumption (1000 gigajoules) - Scope 1 and 2 19,600 18,500 18,700 5,560 4,340 4,690 27,400 24,900 25,700
Energy Intensity (gigajoules per $1,000 Revenue) - Scope 1 and 2 - - - - - - 1.82 1.85 1.75
GREENHOUSE GAS EMISSIONS
Direct GHG Emissions - Scope 1 (1000 metric tons CO₂e) 1,330 1,290 1,300 219 159 174 1,700 1,590 1,620
Indirect GHG Emissions - Scope 2 (1000 metric tons CO₂e) - 964 827 984 277 246 265 1,240 1,070 1,250
Location Based
Indirect GHG Emissions - Scope 2 (1000 metric tons CO₂e) - - 837 984 - 249 266 - 1,090 1,250
Market Based
Total GHG Emissions - Scope 1 and 2 (1000 metric tons CO₂e) - 2,300 2,110 2,280 496 406 438 2,940 2,660 2,870
Location Based
GHG Emissions Intensity (metric tons per $1,000 Revenue) - - - - - - - 0.196 0.197 0.196
Location Based
Total GHG Emissions - Scope 1 and 2 (1000 metric tons CO₂e) - - 2,130 2,280 - 408 440 - 2,670 2,870
Market Based
GHG Emissions Intensity (metric tons per $1,000 Revenue) - - - - - - - - 0.198 0.196
Market Based
See page 29 for key for environmental data tables and footnotes
EXECUTIVE SUMMARY GROWING BETTER TOGETHER BETTER PLANET BETTER LIVES BET TER PARTNER 27ENVIRONMENTAL FOOTPRINT DATA
CROP PROTECTION SEEDS & TRAITS COMPANY TOTALS
FY '15 FY '16 FY '17 FY '15 FY '16 FY '17 FY '15 FY '16 FY '17
OTHER EMISSIONS
Sulfur Oxide (SOx) Emissions (metric tons) 1,520 1,410 1,280 *59.4 *57.6 74.8 *1,580 *1,470 1,350
Nitrous Oxides (NOx) Emissions (metric tons) 3,280 3,030 2,940 *770 *664 700 *4,050 *3,690 3,640
Volatile Organic Compound (VOC) Emissions (metric tons) 93.0 88.6 88.5 *96.4 *94.4 108 *189 *183 197
WATER USE
Fresh Water Withdrawal (1000 cubic meters) *26,500 26,600 24,800 *24,400 *22,400 17,400 *50,900 *49,000 42,200
Surface Water 5,750 5,720 5,620 8,130 5,480 3,430 13,900 11,200 9,050
Ground Water *19,300 19,500 17,700 *9,810 *12,600 9,400 29,100 32,100 27,100
Municipal Water 1,340 1,180 1,150 6,000 3,790 4,080 7,350 4,970 5,240
Collected Rainwater 87.2 39.1 89.9 275 168 128 362 207 218
Purchased Wastewater for Reuse - - - 186 396 309 186 396 309
Misc. Water Purchases (bulk, deionized and bottled) 0.6 180 249 3.6 4.6 6.7 4.2 185 256
Water Reuse and Recycling (1000 cubic meters) 337,000 336,000 357,000 2,870 2,600 3,680 340,000 339,000 361,000
Volume of Condensate/Cooling Tower Water Recyled/Reused 334,000 332,000 355,000 2,820 2,560 3,650 337,000 334,000 359,000
Volume of On-Site Process Wastewater Recyled/Reused 3,390 4,860 1,960 52.4 36.0 32.5 3,450 4,900 1,990
Process Wastewater Discharged (1000 cubic meters) 19,400 17,400 18,500 664 630 798 20,100 18,000 19,300
Discharged to Off-Site Treatment (e.g. publicly owned 720 594 614 409 400 638 1,130 995 1,250
treatment works)
Permitted Discharges to Subsurface (e.g. deepwell/leachfield) 2,020 2,150 2,260 - - 0.6 2,020 2,150 2,260
Permitted Discharges to Surface (e.g. river) 16,700 14,700 15,600 255 230 160 17,000 14,900 15,700
Process Wastewater Quality for Direct Surface Water Discharges
(metric tons)
Biological Oxygen Demand 52.3 60.0 56.5 - - - 52.3 60.0 56.5
Nitrates/Nitrogen to Surface Water (as N) 44.8 65.9 86.4 - - - 44.8 65.9 86.4
Phosphates (as PO4) 216 364 383 - - - 216 364 383
Total Suspended Solids 37.6 92.0 54.6 - - - 37.6 92.0 54.6
See page 29 for key for environmental data tables and footnotes
EXECUTIVE SUMMARY GROWING BETTER TOGETHER BETTER PLANET BETTER LIVES BET TER PARTNER 28ENVIRONMENTAL FOOTPRINT DATA
CROP PROTECTION SEEDS & TRAITS COMPANY TOTALS
FY '15 FY '16 FY '17 FY '15 FY '16 FY '17 FY '15 FY '16 FY '17
WASTE
Hazardous Waste (metric tons) 2,930 4,370 7,200 6,310 8,030 4,110 9,240 12,400 11,300
Energy Recovery 544 197 449 72.4 261 775 617 458 1,220
Incineration 2,180 3,780 5,970 4,700 5,400 1,540 6,880 9,180 7,510
Landfill 44.1 238 252 242 304 320 286 542 572
Reuse/Recycling/Composting 158 161 520 1,300 2,060 1,480 1,460 2,220 2,000
Non-Hazardous Waste (metric tons) *21,200 *25,700 35,900 *195,000 *256,000 323,000 *216,000 *282,000 358,000
Energy Recovery *150 468 423 *89,000 *105,000 94,700 *89,100 *106,000 95,200
Incineration 1,310 1,430 1,760 4,770 5,530 15,100 6,080 6,960 16,900
Landfill *12,600 *16,800 23,300 17,400 17,400 17,800 30,000 34,200 41,100
Reuse/Recycling/Composting 7,140 7,030 10,400 *83,500 128,000 195,000 90,600 135,000 205,000
Total Waste (metric tons) *24,200 *30,100 43,100 *201,000 *264,000 327,000 *225,000 *294,000 370,000
Landfill Diversion Rate 48% 43% 45% 91% 93% 94% 87% 88% 89%
LOGISTICS &
CONTRACTED LAND SCOPE 3 TOTALS
SCOPE 3 - OUTSIDE OF THE ORGANIZATION BUSINESS TRAVEL
FY '15 FY '16 FY '17 FY '15 FY '16 FY '17 FY '15 FY '16 FY '17
Energy Consumption - Direct and Indirect (1000 gigajoules) 1,940 2,030 2,100 4,990 5,070 5,900 6,930 7,100 8,000
GHG Emissions - Direct and Indirect (1000 metric tons CO₂e) 162 170 186 371 379 441 533 549 627
Fresh Water Withdrawal (1000 cubic meters) 677,000 618,000 680,000 - - - 677,000 618,000 680,000
KEY FOR ENVIRONMENTAL DATA TABLES
CO₂e = carbon dioxide equivalent • GHG = Greenhouse gases • " -" = Not Applicable or Data Not Collected
* = Fiscal years 2015 and 2016 items noted were updated from what was previously reported to reflect corrections and/or changes to the data or calculation methodology.
Reported data in the environmental tables are rounded to three significant digits or, for small values, presented as no less than one-tenth the indicator reporting unit. This approach enhances data
usability while providing sufficient detail without becoming numerically cumbersome.
Energy and greenhouse gas (GHG ) emissions data for Company Vehicles ( 2,260,000 gigajoules and 154,000 metric tons for fiscal year 2017 ) are included in Company Total.
GHG emissions increased in fiscal year 2017 due to increased production and increased USEPA eGRID emission factors in the U.S. Northwest subregion. GHG emissions are calculated using various
standardized emissions calculation methodology and factors, including the World Resources Institute and World Business Council on Sustainable Development. Greenhouse Gas Protocol, USEPA GHG
Reporting Program and Emission Factors, and location-based factors: USEPA eGRID, IEA Country Specific factors, and other site or case specific factors and calculations as reviewed by our third-party
assurance auditors. “Market Based” values based on residual emission factors from the 2016 Reliable Disclosure Systems for Europe – Phase II for European sites, plus location-based values for all other sites.
Starting with fiscal year 2016 in reporting for Scope 2 (Indirect) GHG Emissions, both “Location Based” and “Market Based” reporting are provided per the GHG Protocol Scope 2 Guidance. A location-based
method reflects the average emissions intensity of grids on which energy consumption occurs, while a market-based method reflects emissions from electricity that sites have purposefully chosen (or their
lack of choice). Please see GHG Protocol Scope 2 Guidance for additional details.
Waste Shipped Off-Site: The increase from fiscal year 2016 was mainly driven by increased production and construction related disposal. Non-Hazardous Waste Energy Recovery was revised
to include Biomass Fuels Shipped Off-Site for Energy Generation. Landfill Diversion Rate represents the percentage of total waste not using landfill as disposal method. On-site treatment,
storage, and recycling of waste not included in totals. Hazardous waste was not exported or imported by Monsanto across country borders.
EXECUTIVE SUMMARY GROWING BETTER TOGETHER BETTER PLANET BETTER LIVES BET TER PARTNER 29You can also read